From Unit Economics To Negative Churn: Hitchhiking To SaaS Growth
20 MIN READ
|
Updated on October 6, 2022
Optimizing for growth in SaaS comes down to identifying the metrics that matter most, the levers that move them, and the relationships they share.
However, the journey starts from a single unit that adds value to a business and is quantifiable. It could refer to your subscribers or the products that you’re selling. The quantification of how much profit your business makes through “one unit” is where unit economics comes in.
Most financial administrators examine a company’s financials from a company-wide perspective by doubling down on various SaaS metrics. But reviewing a company on a unit-level basis can give them a much better chance of predicting potential growth values.
Unit economics is considered foundational for analyzing a company’s performance and forecasting its future growth potential. Through this post, you’ll get more of an idea of this concept and how to use it to understand the financial viability of your business.
So, let’s delve further into a SaaS company’s path to growth – starting from unit economics, weaving our way through important SaaS metrics, and how each of these characters shows us a new perspective on reaching our destination to sustained growth and profitability.
Unit economics expresses a company’s costs and revenue on a per-unit basis, making it a primary financial indicator. Usually, a unit in SaaS refers to customers rather than products. Hence, unit economics in the SaaS industry refers to the addition or loss of a new customer and its impact on its bottom line. It includes considering the cost of acquiring a customer, the revenue generated by that customer, and how long you can keep them happy (i.e., customer lifetime value).
The importance of unit economics stems from the fact that it helps calculate profitability at the unit level, making unit economics fundamental to most pursuits of growth and profitability. If you are profitable per unit, you must be profitable overall. So understanding unit economics also allows a business to make informed decisions with cost in mind. For instance, if you know that a specific customer segment is costing you more, there are a few ways to reduce the cost. You may choose to adjust the pricing tiers or restructure the product offering to make the customer segment more profitable.
While there are several options you can take, you can only move forward with confidence by understanding your unit costs.
Going further, we’ll take two routes to break down the concept of unit economics: the metrics that make it, and pricing your services accurately, so you gain the most value from your “unit,” be it your subscriber or product.
In understanding unit economics, we meet the first two characters on this journey – Lifetime Value (LTV) and Cost of Acquiring Customers (CAC).
Unit Economics = LTV/CAC
Lifetime Value acts like a Plimsoll line and helps keep acquisition costs in check. Spend any more than your customers’ lifetime value, and you are no longer profitable with that cohort.
Ideally, the best SaaS businesses have an LTV to CAC ratio higher than 3, sometimes as high as 7 or 8.
LTV = Average duration of customer contracts x ARPA x % Gross Margin
Note: Gross margin is just as critical as revenue. It’s a result of operational efficiency and so sits on a tangent that we’ll pick up another day. To keep things simple, I’ve opted to keep % gross margin entirely out of this post.)
For the sake of simplicity, we’ll discuss more on LTV and its two components – ARPA (avg. revenue per account) and churn – in this post. Before doing so, here’s a basic understanding of the other metrics mentioned in the formula above:
CAC is the average amount of money spent to acquire a customer. Understanding CAC is critical for determining how cash efficient your SaaS business is and how successful it can be in the future. It is an important metric that frequently determines a company’s marketing budget. A clear picture of your CAC provides you with a better perspective, allowing you to balance your spending and move better closer to profitability.
CAC = total marketing & sales spend for a given period / the number of customers gained during that period
After deducting the cost of goods sold, the revenue is referred to as the gross margin (COGS). It is commonly expressed as a percentage of total revenue.
Gross Margin (%) = (Revenue – COGS) / Revenue
The average customer contract duration is the average length of time your customers continue to subscribe to your product or service.
The average duration of customer contracts = 1/(dollar churn)
Customer Lifetime Value is the average revenue you can generate from a customer throughout their account’s lifetime. In layman’s terms, it’s the money you’d make from a customer before they churned.
For example, if a customer signs up for your product for seven months, his lifetime value is determined by the amount he pays during that time.
LTV is an important metric because it provides you with a customer-centric perspective to guide some of your subscription business’s critical marketing and sales strategies, such as acquisition, retention, cross-selling, upselling, and support.
Note: If all your customers belong to one pricing plan and pay you equally on average, (1/customer churn) would tell you how long each customer stays. But if you are like most companies, some customers pay much more than others. Consequently, how long each dollar stays is a better ratio for calculating LTV.
LTV=ARPA/Dollar Churn
The relationship between ARPA and dollar churn reveals the two levers that, when moved in the right direction, yield better LTV, profitability, and growth – i.e., better unit economics.
Then, to increase LTV, you need to either reduce revenue churn or increase ARPA.
The churn rate is the frequency with which your customers cancel their subscriptions (the percentage of subscribers who no longer pay you). Your subscription business relies on customer retention, and the churn rate is the hole in that bucket. (I’ll throw in a quick formula here: 1 – Churn Rate = Retention Rate.)
If this isn’t reason enough to pay attention to churn, here’s another one:
The LTV/CAC ratio (unit economics!) is the ultimate metric for most SaaS companies. Like we discussed, it is a financial viability check for your business, where CAC and LTV will give you a rough image of how your business’ future looks and help you align with your objectives.
Now that your churn rate is one of the primary determinants of LTV, a decrease in your churn rate will invariably increase the metric’s value. As a result, even a minor error in your churn calculation will wreak havoc on your company’s unit economics.
Hence, fighting churn is an inevitable battle. What’s critical, though, is to remember that, as with all metrics, churn is simply the reading on a gauge – like a temperature on a thermometer – it only detects the presence of a problem. It assigns a degree of intensity to it.
The problem lurking behind the symptom needs to be understood deeply. Account churn can happen for a variety of reasons. One helpful way is to think about involuntary churn (customer’s payment attempt fails, leading to subscription cancellation) and voluntary churn (customer could not achieve their desired outcomes, hence, cancels their subscription).
Translating these customer churn numbers into a revenue figure, we get gross churn, i.e., the total revenue lost from a cohort due to logo, customer, or account churn.
When we talk about lowering churn, it’s usually the avoidable or voluntary gross churn we are talking about. I should hasten to point, though, that not everything that seems unavoidable is so. Involuntary churn, like voluntary churn, can be reduced with the right strategies in place.
How do you stay clear of them? Check out our Complete Guide to Analyzing and Reducing Customer Churn.
Now, let’s come to the numerator:
The revenue generated from each paid subscription over some time, typically per month or year, is referred to as ARPU (Average Revenue Per User). Depending on how you price your customers, ARPU is also known as Average Revenue Per Account (ARPA) and Average Revenue Per Subscription (ARPS).
ARPA (monthly) = Total MRR / Total Active Subscriptions (Users)
(We will discuss monthly recurring revenue further in the article.)
ARPA is a crucial unit economics indicator that tells you how well your business performs. It enables the analysis of a company’s revenue generation and per-unit growth. A use-case of ARPA (among others) is while running pricing experiments – it can indicate whether you’ve priced your product correctly. A SaaS with a low ARPA may be underpricing its product, indicating that there is room for pricing increases and running experiments to see if people are willing to pay more for your product.
So, coming back to increasing the numerator – how can the ARPA of any given cohort increase over time? Think expansion revenue.
Now, why would any customer want to pay you more, progressively?
Nobody wants to. But they’d be willing to progressively pay more if they can get more value out of your product.
Enter scalable pricing.
Quick Recap: So far, we’ve discussed unit economics (LTV/CAC) and ways to increase LTV to increase the value of the unit economics ratio. LTV = ARPA/Churn, and to increase LTV; we need to decrease churn (which we’ve discussed) or increase ARPA. How do we increase ARPA? Through expansion revenue, which can be achieved by scalable pricing.
There are two things to begin with when we talk about pricing. The extent to which a product is used and the benefits are realized vary across customers. And the costs incurred in serving different customers speak for similar variations.
In the case of a Helpdesk, customer A, which employs 50 seats, arguably, finds more value and costs more in operating costs than customer B that employs five agents. It feels unfair that both these customers pay the same.
What’s required, then, is a pricing model that scales along with the value your customers expect.
But how do you know what customers perceive as value?
Easy; price for usage. More usage – seats, bandwidth, contacts, anything – must mean value.
Wrong.
More usage doesn’t necessarily mean more value.
For instance, imagine one library (A) that charges users based on the number of books borrowed, and another (B) that charges based on the number of visits to the library.
Which library would you rather be a member of? No points for guessing.
A higher number of visits does indicate more usage. But would a person be immediately able to correlate number-of-visits with the value they expect – to access and read books? Unlikely.
If it’s any consolation, pricing isn’t easy to grasp. It’s complex and determined by various factors such as product features, demographics, and industry, among others. While there is no set formula or rule for pricing, some well-known pricing strategies and models help you price your services accurately.
Popular pricing strategies include
Among these pricing strategies, one makes it easy to justify the price to be paid when successfully pulled off. And that’s value-based pricing.
Almost all SaaS companies use value-based pricing for the simple reason that on any given day, it is preferable to slapping a random markup via cost-plus pricing. Furthermore, relying on competitor pricing may not be sustainable in the long run because you must evolve your pricing strategy based on your product rather than what others offer. What matters is the value of your product and its differentiation, which the value-based pricing strategy attempts to capture.
Additionally, You must keep in mind that value-based pricing may not provide you with a single magical price point but rather a range of prices. You can package it with the help of various pricing models.
Popular pricing models include usage-based pricing, tiered pricing, and more. You can check out our Definitive Guide to SaaS Pricing Models for more information.
Let’s look at the concept of pricing based on value by discussing value metrics.
How do you price based on value? You begin by figuring out your customers’ Willingness To Pay (WTP). You can do this through statistical research like conjoint analysis, where you ask users to directly compare different features to determine how they value each one.
The next step is to figure out a “value metric” you can base your pricing on. It is the unit upon which the buyer perceives value out of your product or service.
Value-metrics-based pricing reduces prospects’ anxiety when they try to figure out ‘is this worth the money they are asking for?’, by aligning pricing with a metric that clearly and immediately indicates a realizable value from the product.
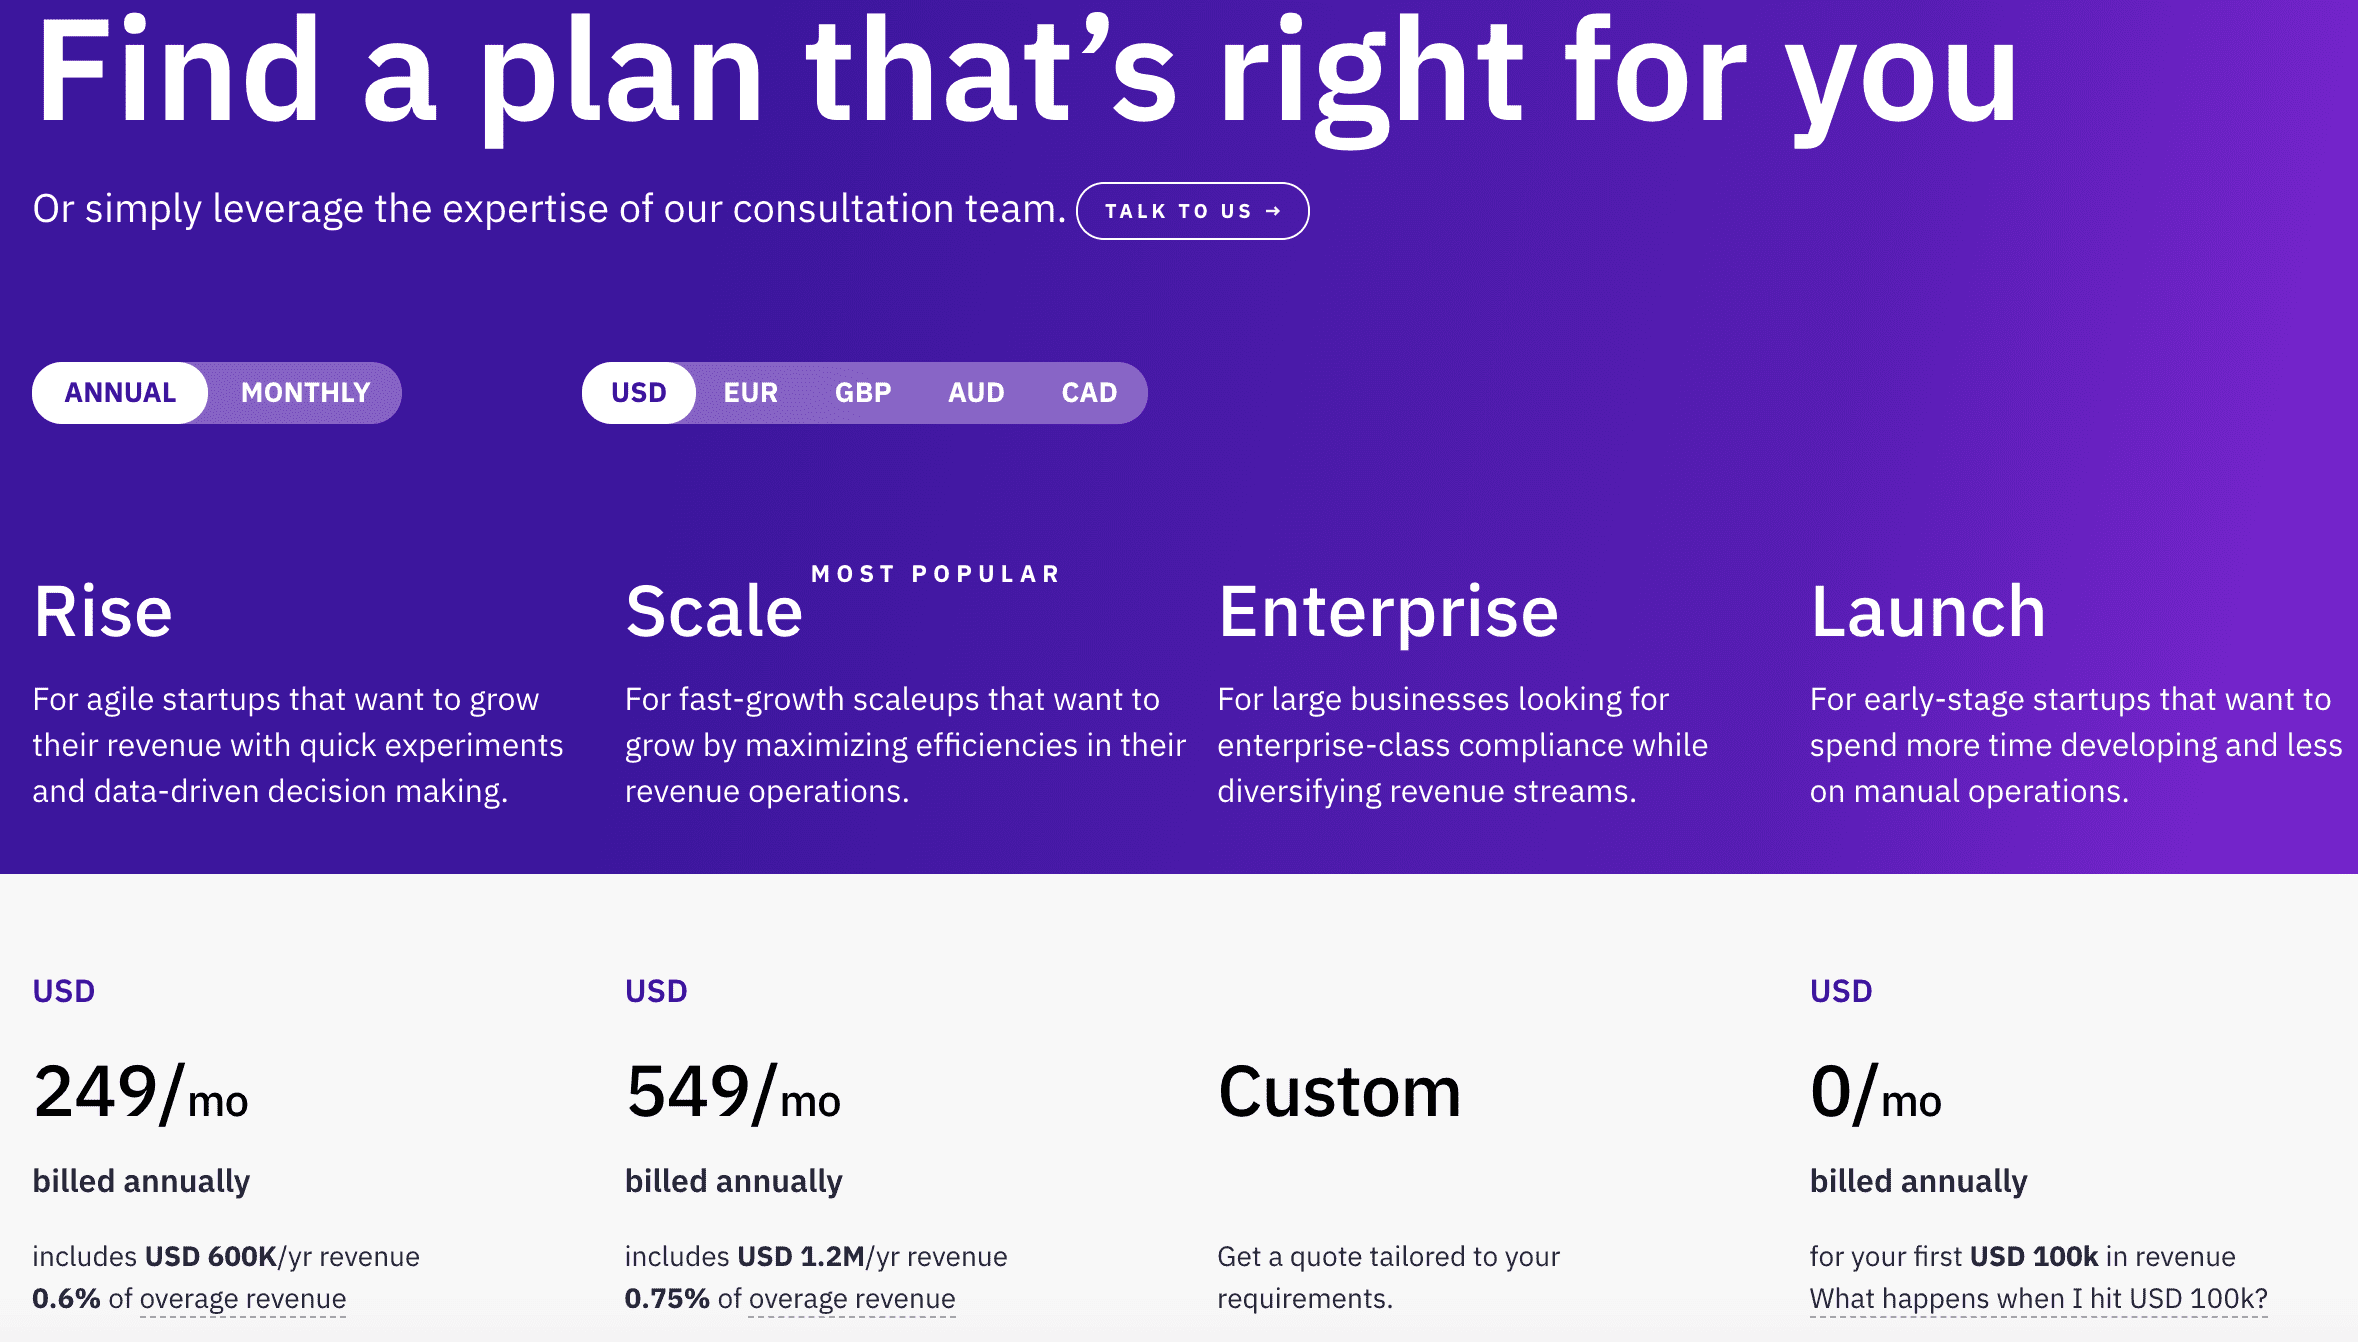
For instance, at Chargebee, we use ‘revenue’ as a value metric since we derive value from the revenue that our customers process through our solution (refer to the image below).
Similarly, other SaaS companies base their pricing on their value metrics. For HubSpot, its marketing contacts, and for Freshdesk, its sales agents.
By getting the value metrics right, the customer success team can focus on reducing dollar churn and getting customers successful faster, and let your pricing axes (your value metrics) take the heavy-lifting towards expanding MRR.
Before discussing expansion MRR, let’s talk about MRR. Monthly Recurring Revenue (MRR) is the consistent recurring revenue generated by subscriptions in a given month. It includes recurring subscription items such as coupons, discounts, recurring add-ons, and so on. (One-time charges such as setup fees, non-recurring add-ons, any non-recurring ad hoc charges, and taxes are not included.)
MRR is nothing but the sum of all the money received from your paid subscriptions/customers. But if you know your ARPA,
MRR = ARPA * Number of paid customers
Now, let’s talk about the MRR expansion. Expansion Monthly Recurring Revenue (Expansion MRR) is the extra monthly recurring revenue generated in the current month over the previous month, excluding MRR contributed by new customers/new MRR. Simply put, it is the amount of additional revenue coming in from existing customers. Additional revenue is generated through upsells, cross-sells, add-ons, and reactivation.
Why is expansion MRR important? Because additional revenue from existing customers indicates customer satisfaction and loyalty, which is beneficial in the long run since it increases LTV. The primary advantage of expansion MRR is that companies incur no additional costs to earn additional revenue. It means that no CAC is involved in the generation of expansion MRR. “Most of the best later-stage SaaS companies get a significant portion of their growth from existing customers,” says Christopher Janz, co-founder and managing partner of Point Nine Angel VC.
Let’s tie what we’ve discussed so far back to value-based pricing and unit economics.
Pricing based on value helps you get more revenue out of existing customers:
And better unit economics precede better profitability.
We’ve come a long way in our journey of SaaS growth. But let’s not stop here.
You’ve paved the way for greater expansion revenue by getting value metrics spot on.
What if we could do better?
There’s a glorious singularity waiting round the corner.
Imagine having just one pricing plan with a base monthly subscription price of $200.
The value metric is unique visitors, increasing by $10 per 1000 visitors MoM.
Now, let’s look at a cohort: In January, your business starts with 100 customers, paying $200 each. The cohort experiences a 3% monthly customer churn, while retained customers expand by 1000 visitors/month and pay $10 more, MoM.
Let’s take a look at the net MRR growth and net revenue churn:
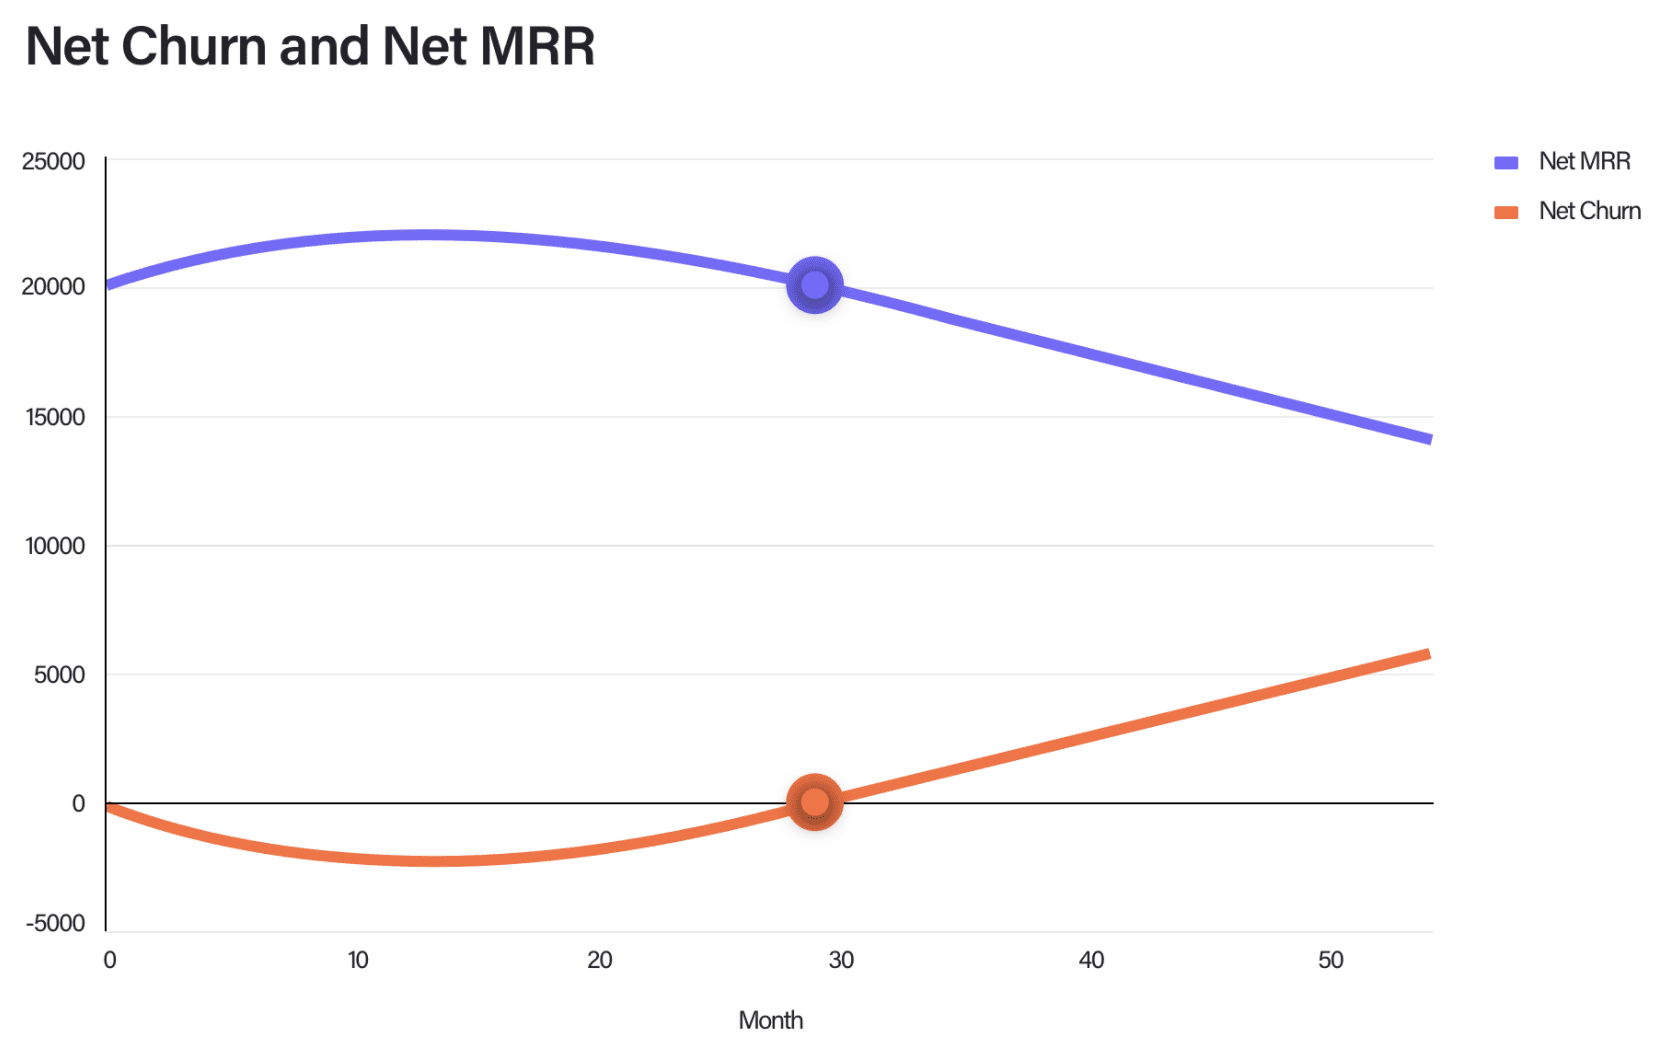
Pay close attention to the purple curve that indicates the net MRR. Initially, even as the customer churn happens at 3% month-on-month, the net MRR from the cohort increases for a good 12 months.
If you look closely, it reflects in the curve for net churn.
During the first year, thanks to the extra $10 each remaining customer started paying (i.e. expansion MRR), the net reduction in MRR (net churn) of the cohort, is negative! In other words, even while you were losing customers, the cohort shows a net growth in dollar terms.
We’ve reached a singularity in the universe of SaaS metrics – negative churn.
Negative churn is a specific state of the net churn of a subscription business when it’s able to add more in expansion revenue than it’s losing as churned MRR.
It ensures that the additional revenue you get from existing customers outpaces the revenue you lose from cancellations and downgrades month after month. While having a low gross churn rate is always preferable, achieving net negative churn means your company can not only survive but also grow during periods of higher-than-normal churn or lower-than-normal customer acquisition. In a nutshell, building negative churn into your SaaS business from the start gives you an unfair advantage at growth, making it one of the most important SaaS metrics to monitor.
In our pursuit of profitability, we optimized for ARPA enough to change the character of another – revenue churn.
Spare a moment to reevaluate the relationship that formed the basis for our journey:
LTV = ARPA/Dollar Churn
The equation assumed dollar churn to be always positive. Yet, as seen in this simulation, it’s possible to achieve an expansion MRR that not just compensates for the revenue churn, but dominates it and turns it negative.
In evolving from positive dollar churn to negative net churn, the relationship it shares with LTV has changed.
Simplistic LTV calculations no longer make sense.
Make no mistake, your unit economics have never been better. Negative churn is a great state to be in. It’s just that, it’s going to take some doing to quantify your LTV.
To make sense of this new reality – the singularity of negative churn – and compute the correct LTV, David Skok explains how discounted cash flow needs to be brought into the picture. Ferenc Huzar does a good job of addressing the issue using net present value.
Coming back to the simulation, you’ll see that over time, for the cohort, net churn turns positive, at which point (around the 28th month), net MRR begins to fall under the $10,000 that the cohort began with. But this cross-over back to positive churn is not inevitable.
Some of the most successful SaaS companies with billion-dollar valuations have grown through negative churn rates – Zendesk (123%), NewRelic (115%), Box (130%).
While unit economics helps forecast and maximize profitability, being profitable is not the end goal.
With companies going for multiple rounds of funding, today, the goal is sustainable growth.
Not long ago, investors blindly rewarded high-growth companies without looking at the costs. Consequently, companies used to thrive for years at the expense of their investors, and when they tried to go public, they usually hit a brick wall. There has been a pivot in the VC mindset since then, especially after COVID-19, where investors seek entrepreneurs who know their unit economics. They want to know that you, the entrepreneur, know where you’re going and that you’re measuring the right economic indicators to steer the ship in the right direction, even if the economic indicators will straighten out in a few years. Today, a VC’s point of attraction isn’t high-growth only, but sustainable and efficient growth.
Let’s discuss further the importance of unit economics and its relationship with growth.
While keeping the LTV-CAC ratio in check is the most obvious (and excellent) benefit of tracking unit economics, here are a few other advantages:
Early success evaluation
Unit economics are critical in determining how much you can spend on acquisition and how much you can expect to get in return in the early stages of a business. They’re a highly reliable indicator of your company’s long-term financial health.
Changes are being assessed
Changes to your marketing strategy or budget, pricing model, or any other changes that may affect sales or churn rates can all be measured using unit economics. Knowing whether or not sales are increasing isn’t enough. You should reconsider your decision if the LTV to CAC ratio changes unfavorably.
Organizing your finances
Combining unit economics with your acquisition rate will give you an estimate of how much money your company will bring in, which will help you plan your finances and your company’s growth.
The LTV:CAC ratio shows you exactly how much you’re spending versus how much you’ll get back. Your business will stay lean and fit if you track these metrics from the beginning.
Forecasting growth
It’s simple to predict growth using unit economics. As long as your LTV remains above your CAC, you are making a profit on your existing customers. If your customer base is expanding while you maintain that ideal LTV:CAC ratio, your company is on the right track.
Investing in capital
You need to grow quickly when you’re first starting out. However, if you spend too much too soon, your company will sink rather than grow. It’s simple to calculate how many months you’ll need to recoup your CAC expenses once you know your unit economics. This will give you an idea of how quickly your capital can be spent on marketing.
Staying on the path of efficient growth
Starting a business or launching a new product isn’t cheap. In those cases, you must reach a specific dollar amount in order to break even. Knowing your LTV and CAC will help you estimate when you’ll reach break-even. Tracking this over time will also reveal whether you’re on the right track or heading in the wrong direction.
A crucial part of charting a path to sustainable growth is figuring out if the weapons you are using will continue to work for you in the battles that lie ahead. With a powerful weapon in your arsenal, you can accentuate your strengths and accelerate your growth.
And this is where we can help you.
Chargebee enables you to achieve and sustain high growth rates for your SaaS:
Subscription Workflow Automation
Concentrate on increasing revenue rather than worrying about whether your billing system can handle the increased volume of transactions. Make expansion plans without being concerned about the operational challenges of accepting different currencies or complying with multiple international regulations. Analyze pricing strategies rather than dreading the prospect of implementing a price change.
Here’s how you can ignite growth with billing automation.
Rapid Pricing Experimentation
Launch, experiment, and iterate pricing structures in minutes. Not months.
Here’s how you can unlock revenue hidden within your pricing structures.
Compliant Revenue Recognition
Move away from the complications of spreadsheets and automate your revenue workflow right from sales order to revenue recognition. Drive accuracy into your revenue reports by making your billing platform the single source of truth.
Here’s how you can unburden your finance team with Chargebee RevRec.
Smart SaaS Analytics
Drive data-backed decisions that keep your business aligned with growth. Get 360° business visibility with subscription analytics and insight-driven dashboards.
Here’s how you can take decisive actions with comprehensive subscription analytics.ƒ
Upgrade finance, accounting, CRM, and more, on a revenue engine that scales with you. To know more, take the product for a spin with a free trial or schedule a customized demo with us.