AR Dashboard
Overview
Note
To see the homepage dashboard, you need to log in first.
Chargebee Receivables has a built-in dashboard that allows you to better track account receivables and collection activity in one place. Once you import financial and customer data into Receivables, you can then summarize it from the dashboard. It gives you an overview of how your business's collections are performing and helps you keep track of receivable status and take action if necessary. The dashboard gathers and analyzes all imported data, as well as collection activities performed on the platform, and gives you a comprehensive report on customers' outstanding balances, aging, collection status, and customer engagement. It includes several key components and features that help you view crucial information related to your customers' payables and, most importantly, collection data.
With easy-to-use, interactive dashboard components, you can drill down into your customer and transaction information. In addition, it allows you to view and track cases, issues, or any follow-ups associated with customers.
The dashboard contains the following components that display crucial information about receivables data:
- Metrics bar
- Know your receivables
- Know your collector queue
- Know your client engagement
Dashboard components
The dashboard components give you the ability to navigate through receivables and collections data represented by charts and widgets. They help you identify key performance indicators, such as a summary of receivables data, cases, issues, and communication with clients as of today.
Note
The reports in dashboard components are synced automatically based on your actions on receivables data.
Metrics bar
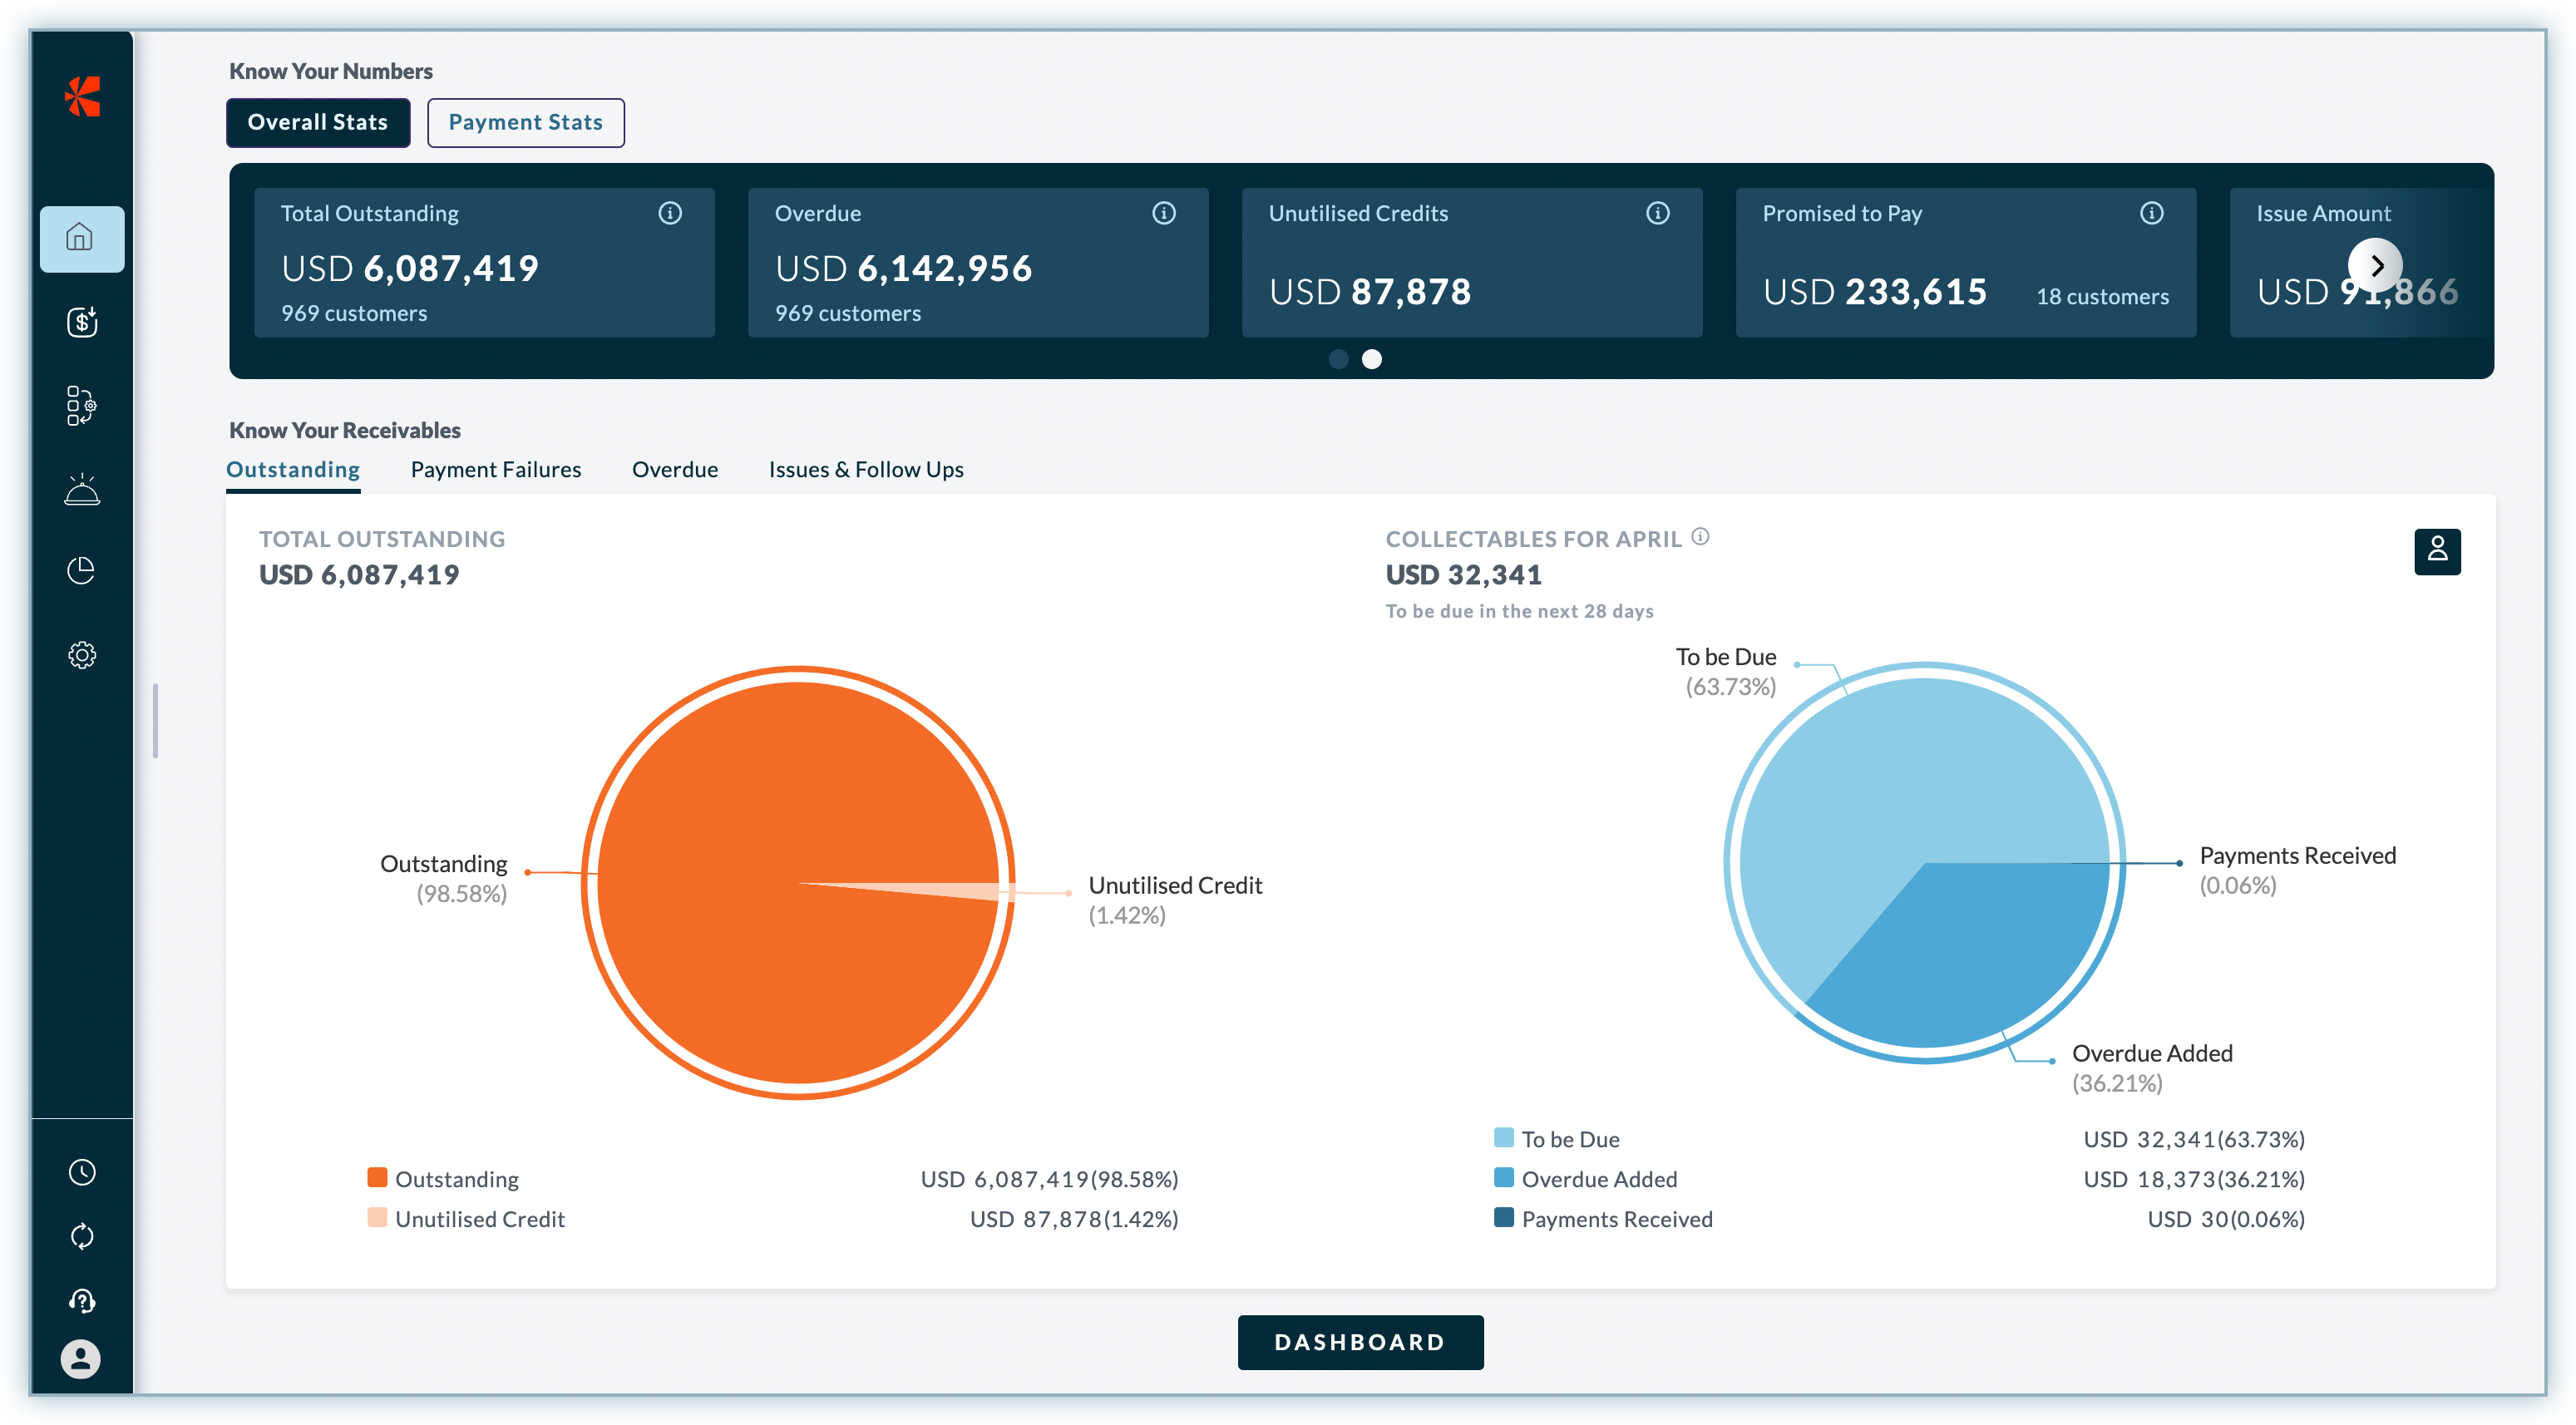
The metrics bar at the top of the homepage dashboard gives you an overview of your account receivables and highlights collection activities from all your assigned customers.
The following are the key metrics of the metrics bar that help you gain an overall understanding of AR and collection activity in your business:
- Total outstanding: Total outstanding is the amount that the customer owes to the company as of today. It includes the total outstanding amount for all pending amounts related to purchases, cash advances, interest, or charges on the product or service you provide to your customers.
- Overdue: Overdue amount represents the total amount from all overdue invoices that are unpaid. It includes invoices, debit notes, or any debit entries that are past the due date.
- Promised to pay: The total amount that customers have promised to pay. It includes the amount from all open PTP cases, i.e., the amount that a client has promised to pay on a certain date.
- Issue amount: The issue amount is the aggregated amount that has remained unaddressed in issues as of today. It includes the amount of all open issues for your clients.
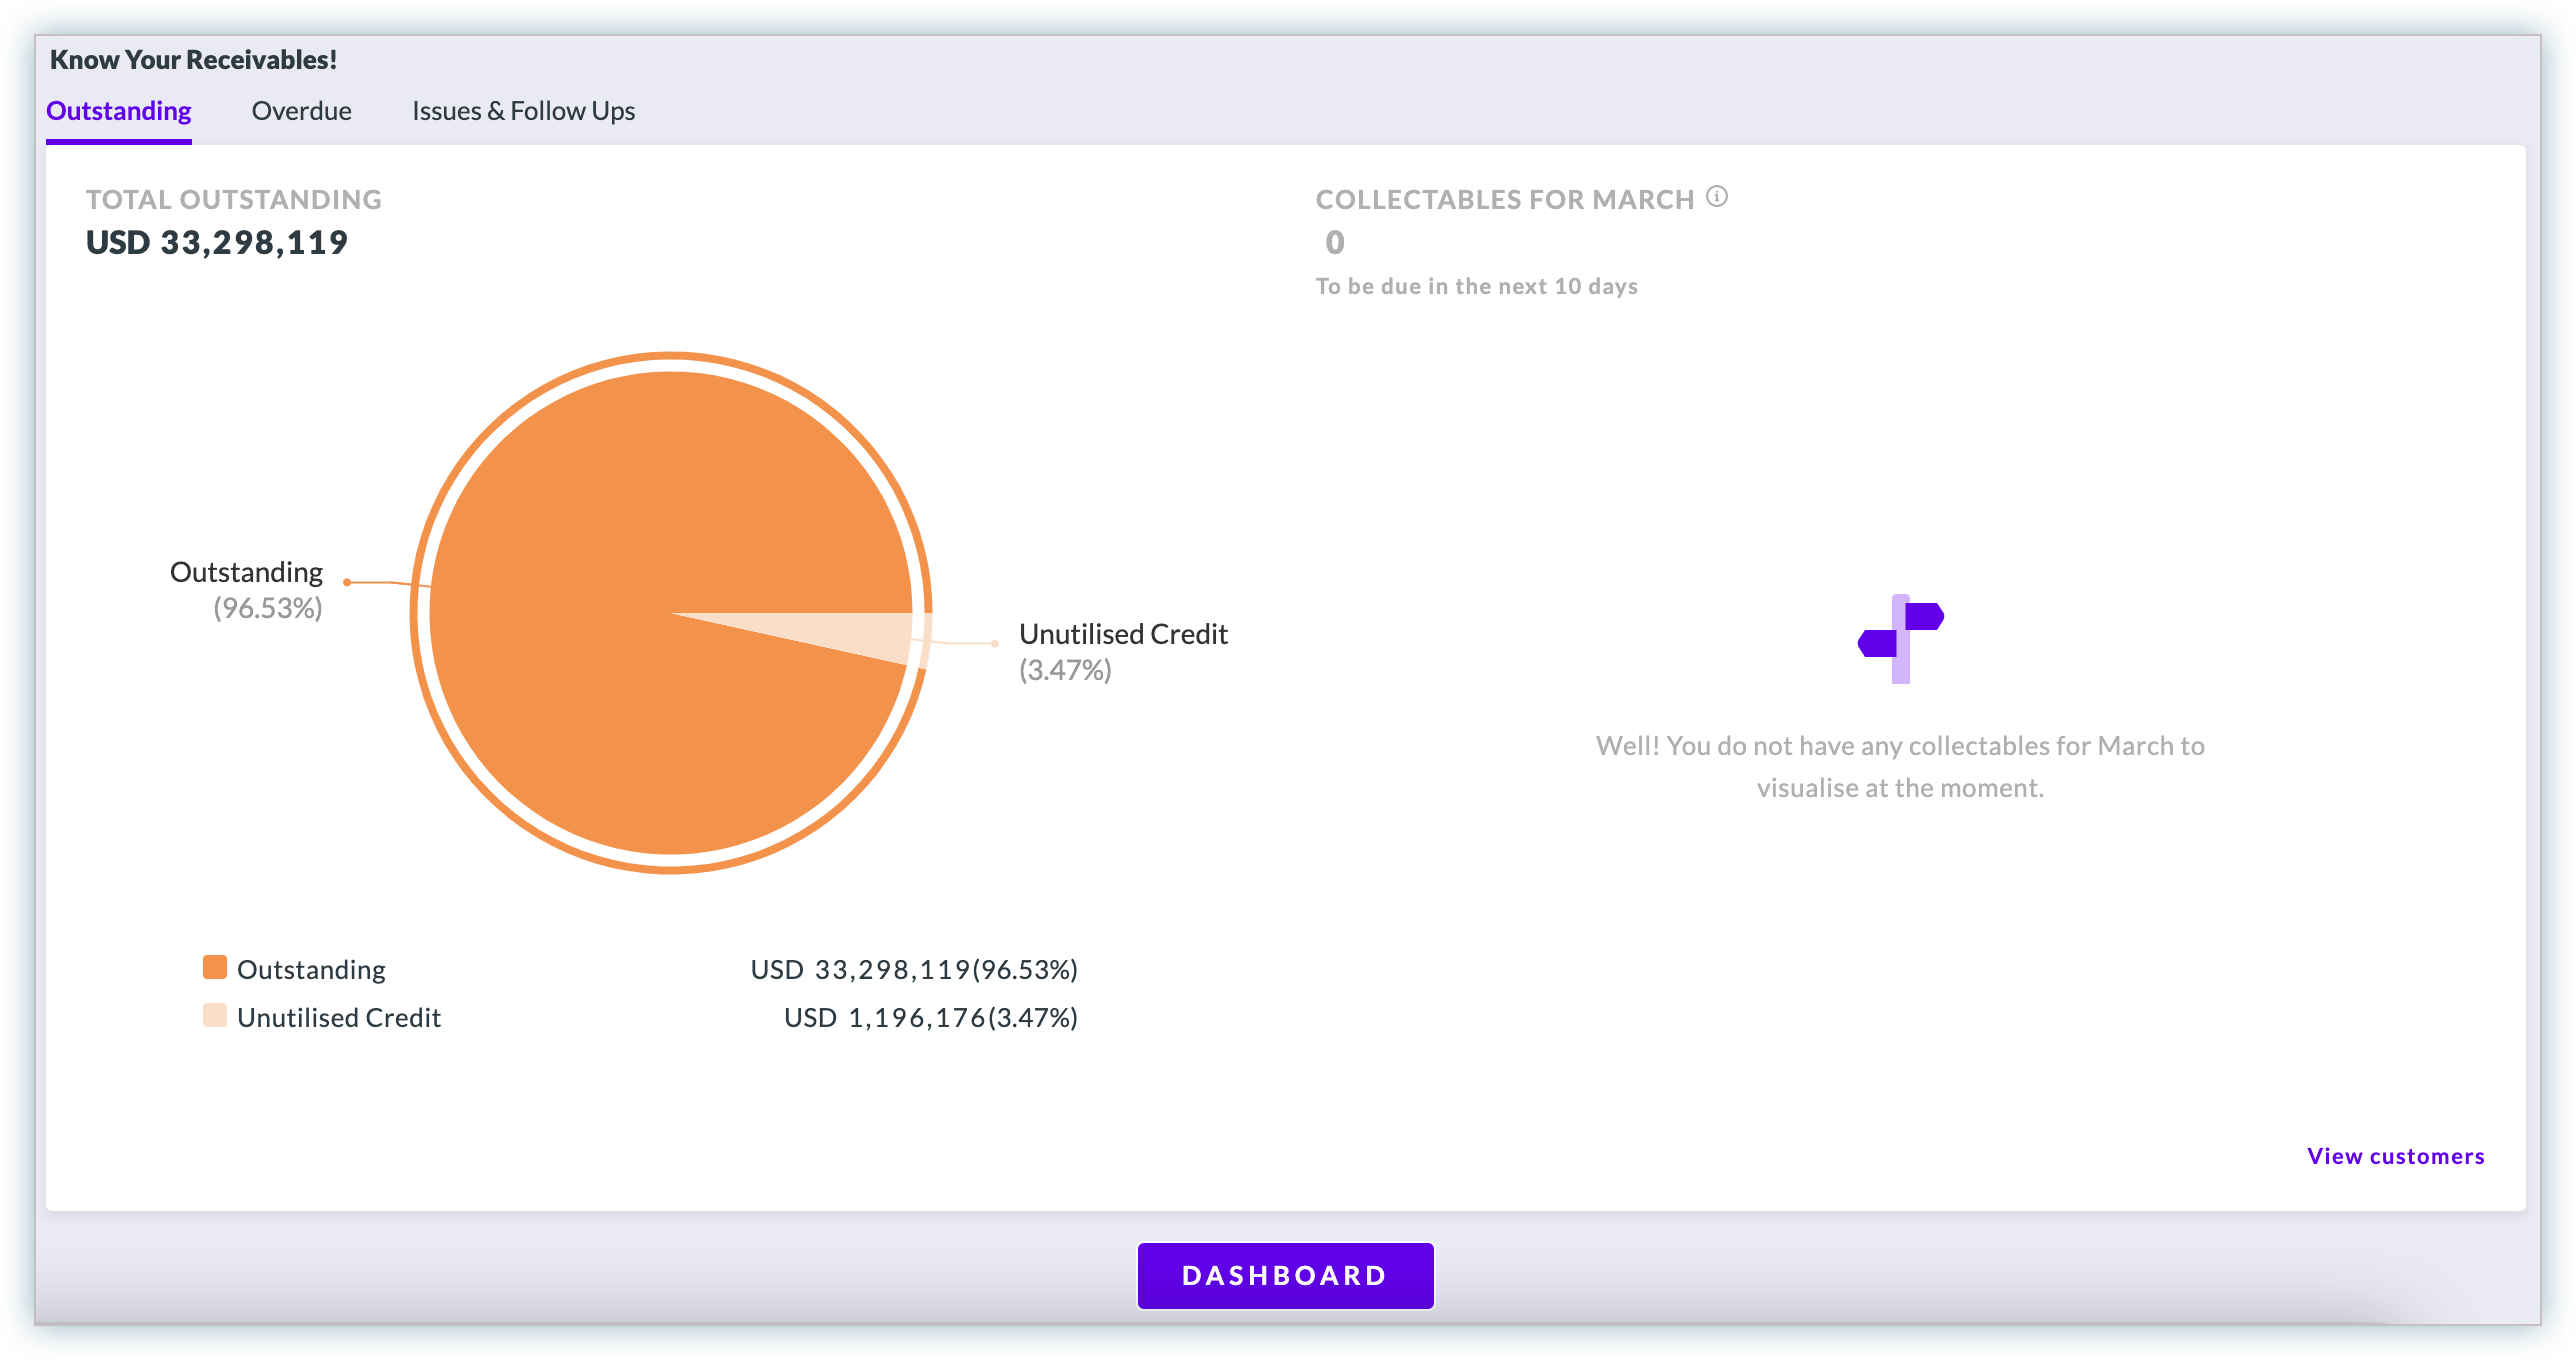
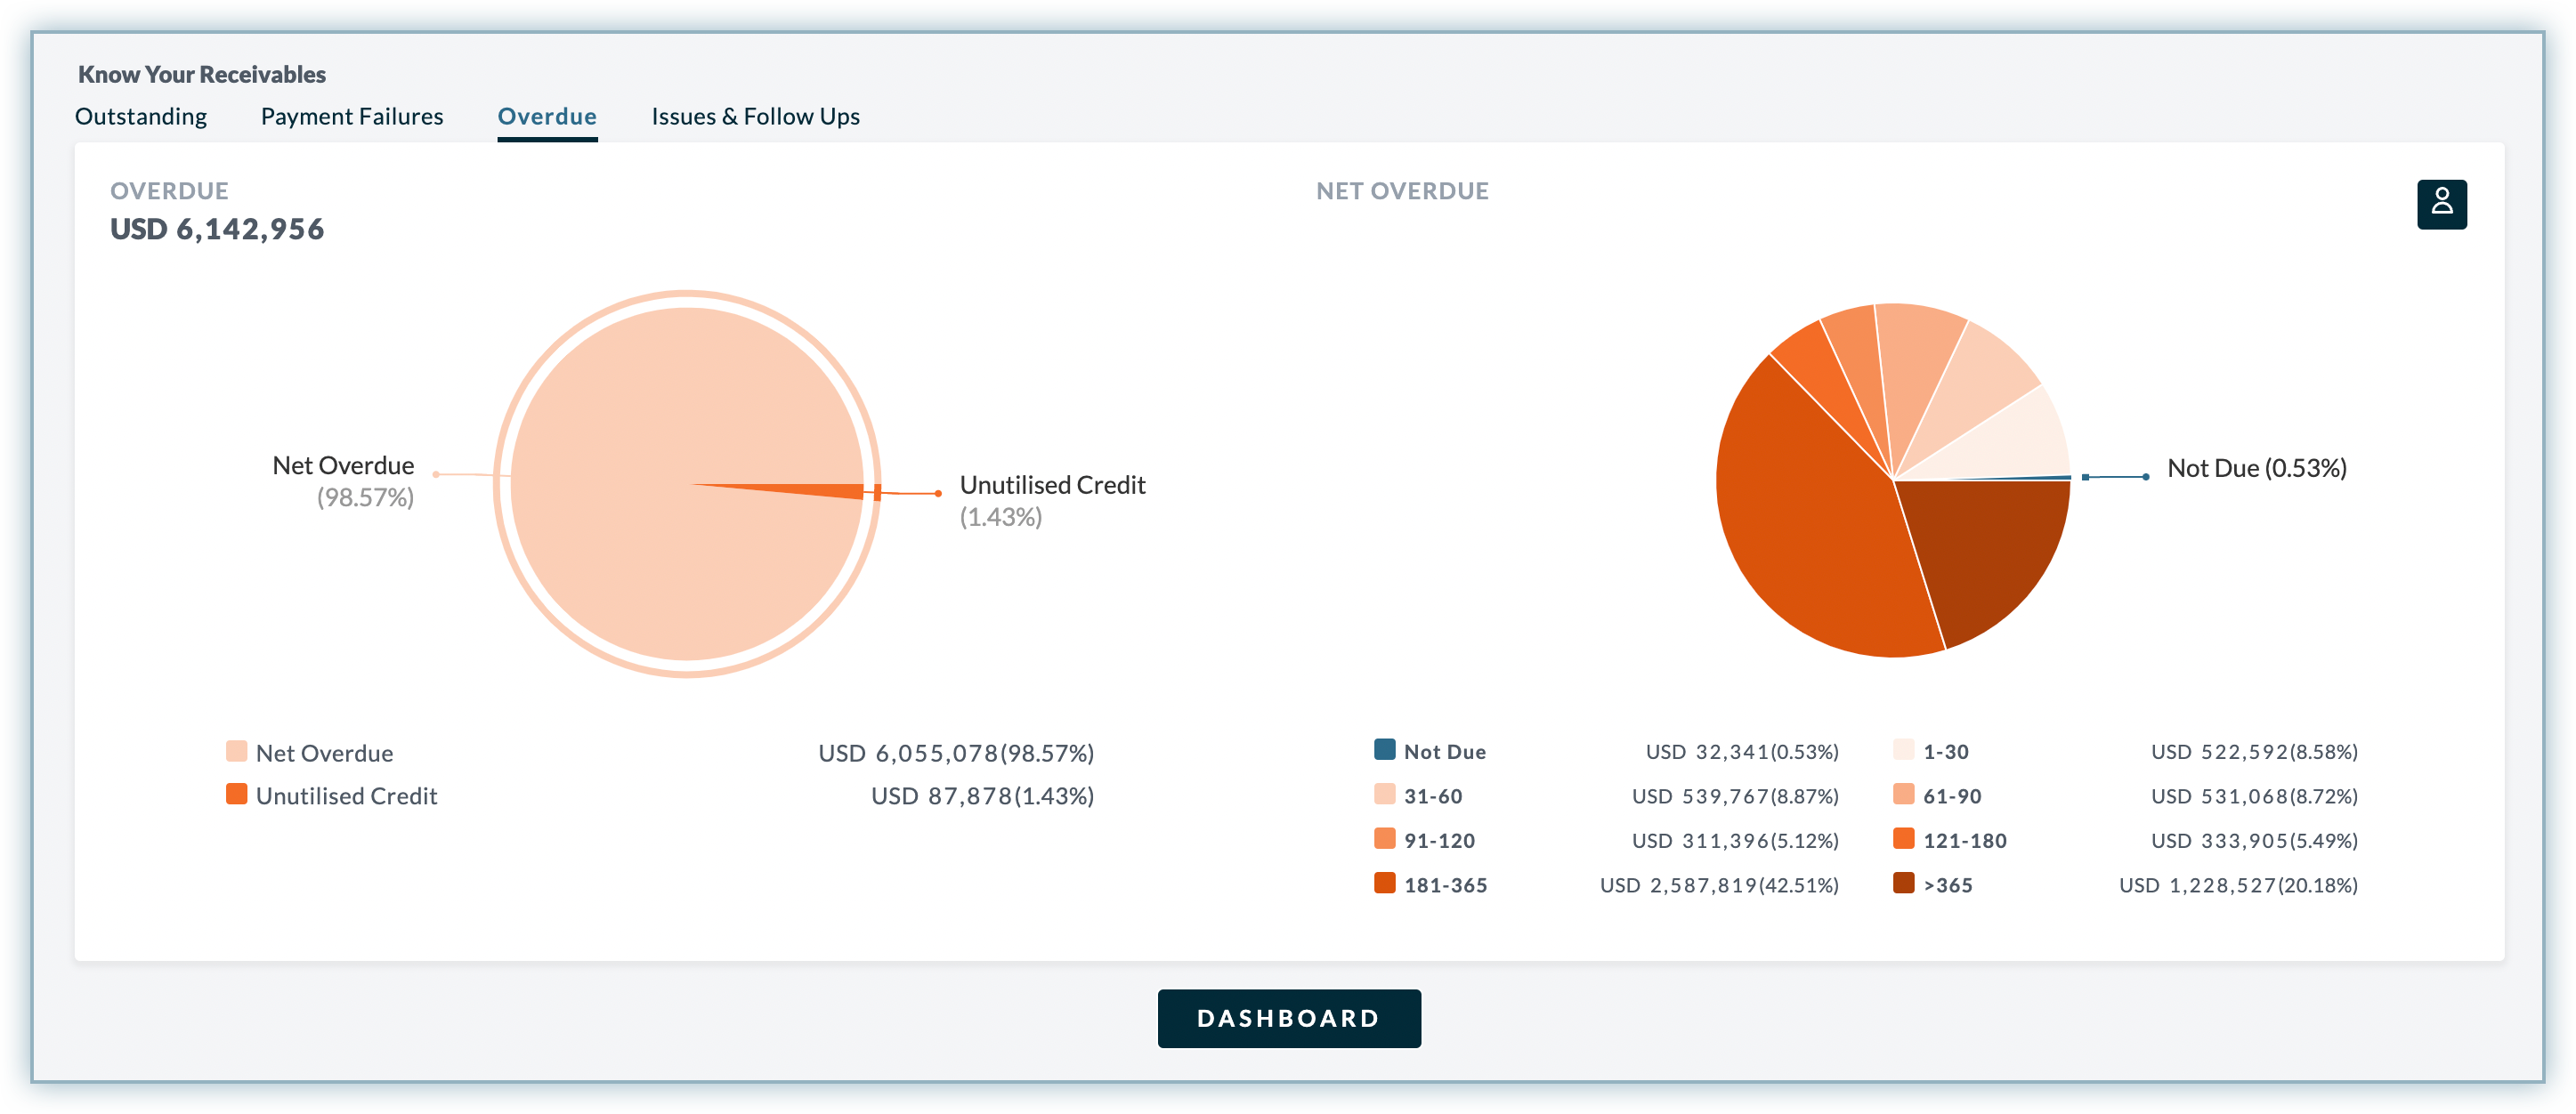
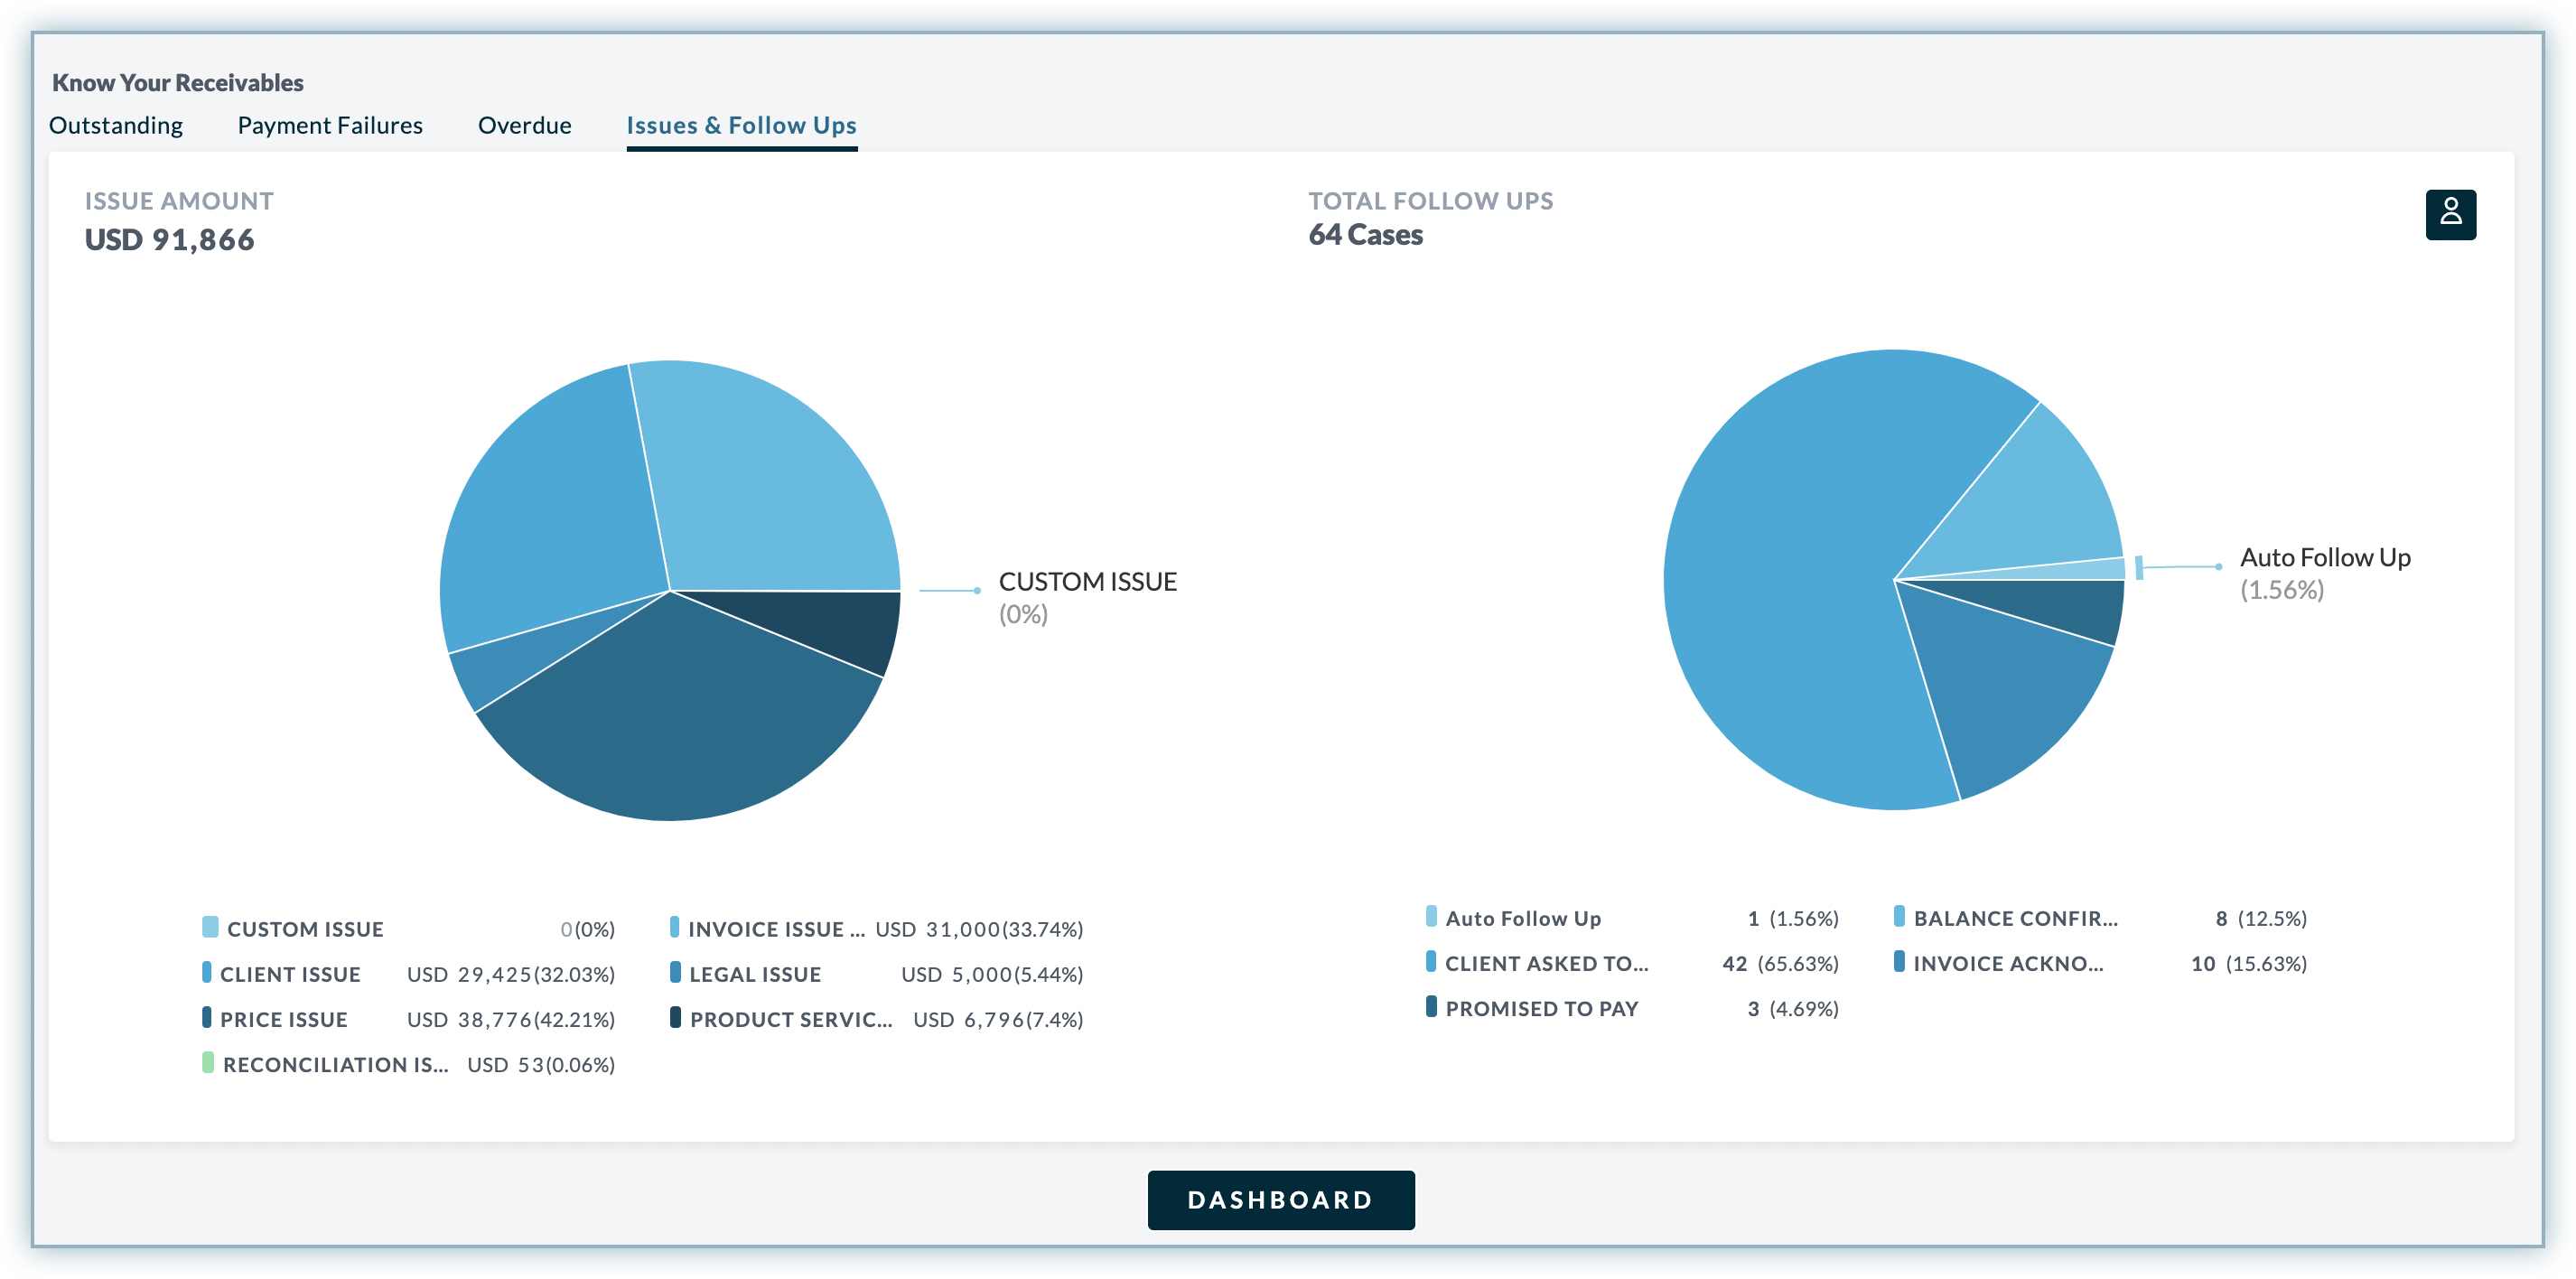
Know your receivables
The Receivables dashboard component provides you a consolidated overview of collections and receivables data for all the assigned customer in your business. You can view all the respective data reports from each of the following categories:
-
Total Outstanding and Collectables: This chart displays the total outstanding amount(in percentage) and unutilized credit(if any) for all the assigned customers. The collectables in the other section display the net amount that is scheduled to be collected in the current month.This information is helpful in understanding how much money a business can expect to receive from its customers int the current month.
-
Overdue Amount: This chart displays the net overdue amount(in percentage) and un-utilized credit amount(if any) for all the assigned customers. The other chart represents the statistics of net overdue amount based on the aging bucket.
-
Issues & Follow Ups: This chart displays the consolidated overview of all the issues and follow ups including total issue amount and follow ups cases for all the assigned customers. The issue amount can be associated with many number of reasons as cases. A particular segment of chart represents the issue amount(in percentage) for a particular reason or case.
In addition to viewing the receivables data charts, you can also view the top customers in each categories of Receivables. Click View customers to see the list of top customers within a particular category.
To view the customer information on receivables data, click Dashboard to open the Receivables View.
Know your Collector Queue
The Collector Queue component provides you with an actionable insight of communication from all your assigned customers. It displays the data that are categorized by the email responses and cases associated with your customers. You can further drill down the cases and responses from each of the following tabs and get a detailed information on it:
- Emails: The list displays top five email responses of clients segregated by latest emails sent(manually, or automatically), replies received, and replies pending.
- Issues/Follow Ups: The list displays top five open issues and follow ups associated to the customers.
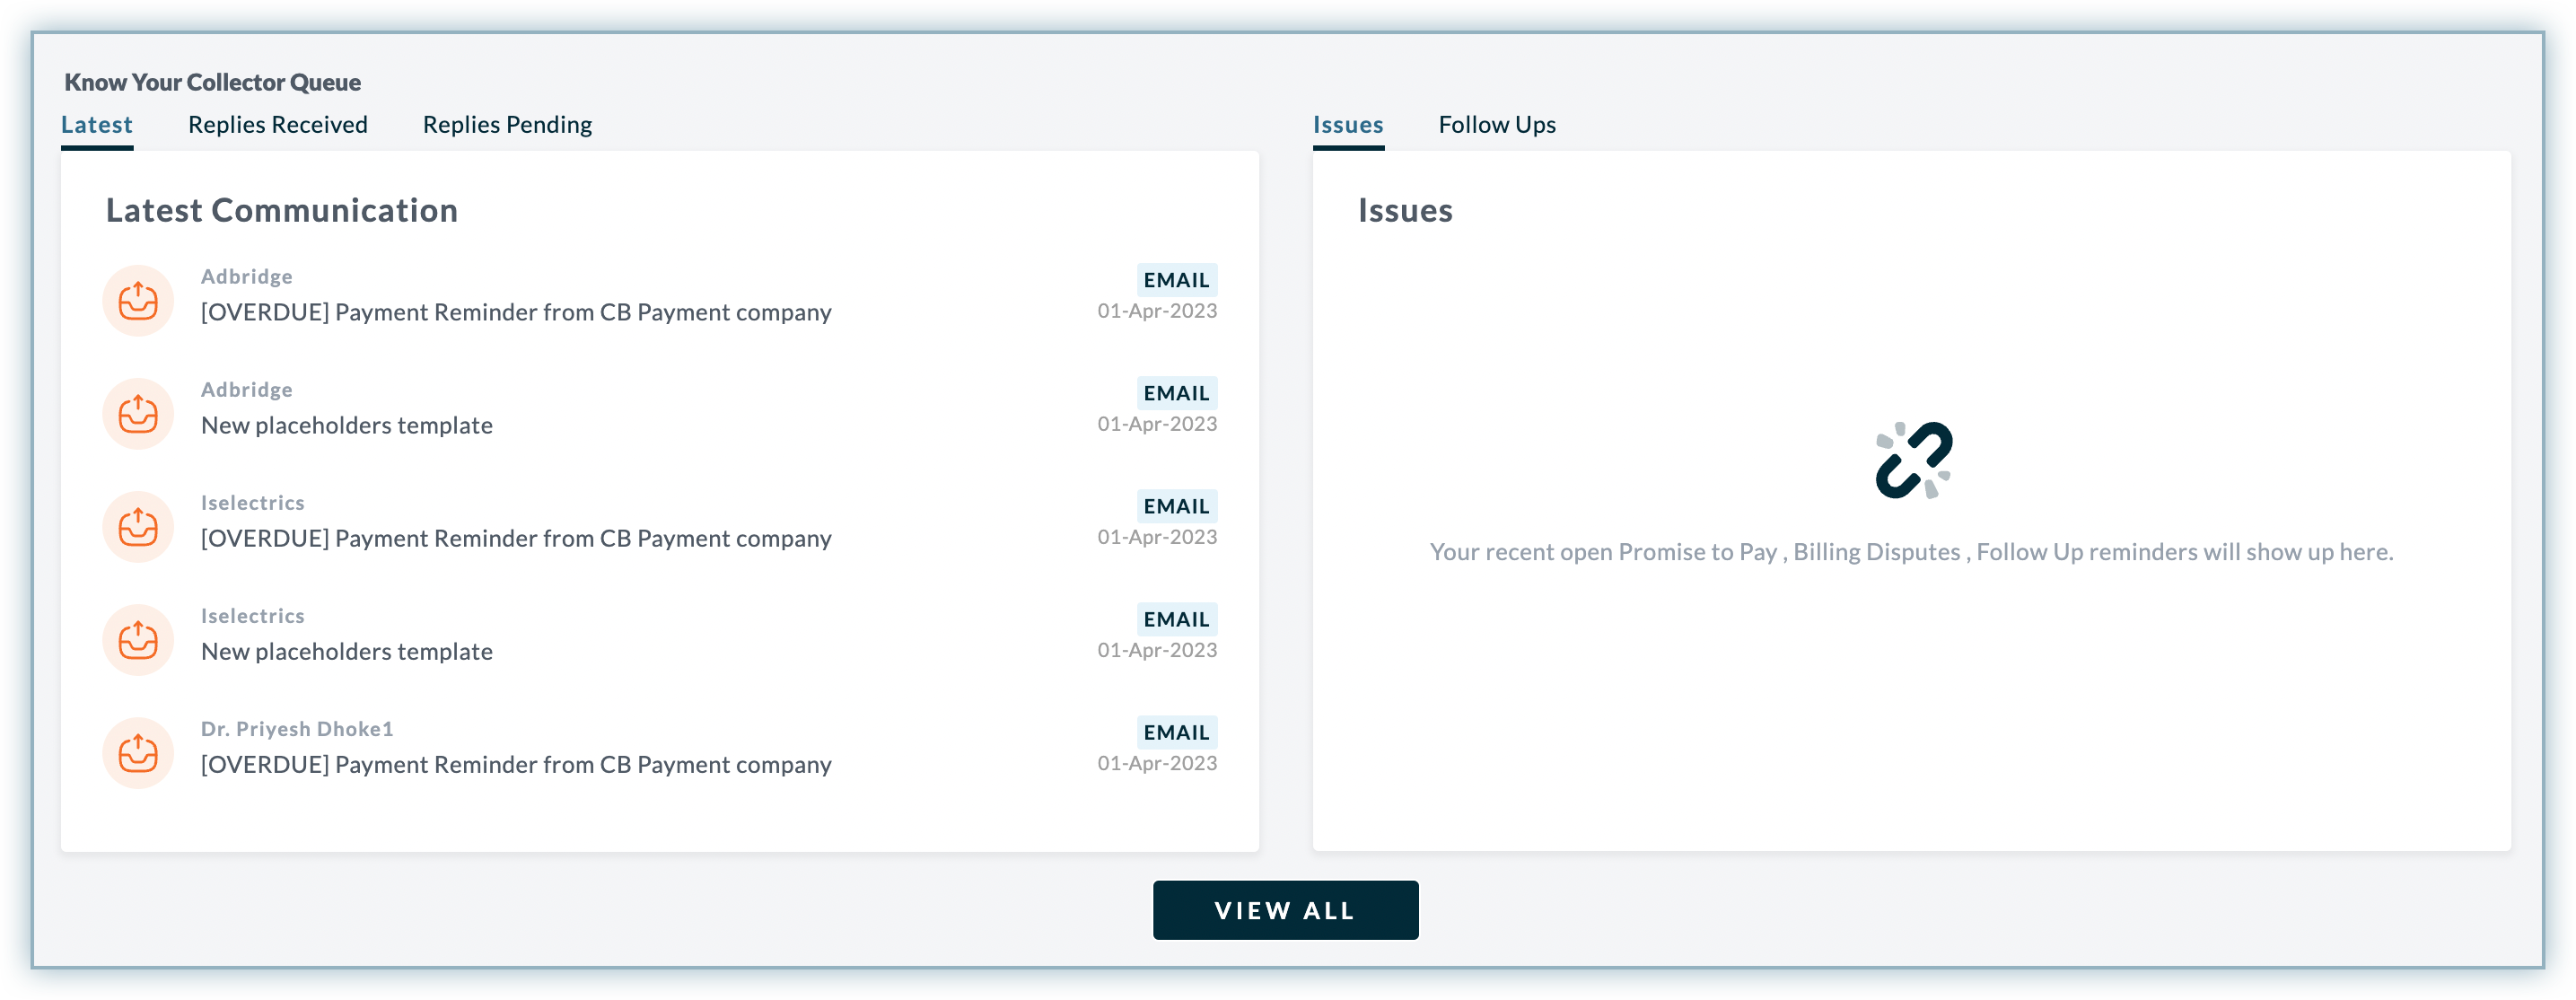
To get detailed information on cases/issues associated with your customers, click View All to open the Collector Queue dashboard.
Know your Client Engagement
Client Engagement component provides you detailed summary of your client's engagement in the business over the period of time. It displays the consolidated report on cases as well as the responses on cases and follow ups. You can see the visual interpretation of client's engagement through various charts and reports based on the following categories as of date:
- Customer Assigned: This chart displays the total number of assigned customers who have outstanding balance greater than zero. The chart represents the customer information such as customer who have been contacted or yet to be contacted(in percentage) for the current month.
- Cases Assigned: This chart displays the total number of open cases assigned to you. It displays the existing open cases and any new cases for the current month(in percentage).
- Channels: This chart displays the total number of channels used to communicate with the customers. It is further represented by the channel used to send reminders, or any engagement cycle which is created to communicate with the customers.
- Client Response: This chart displays the statistics on client's responses received and unresponsive emails in the current month.
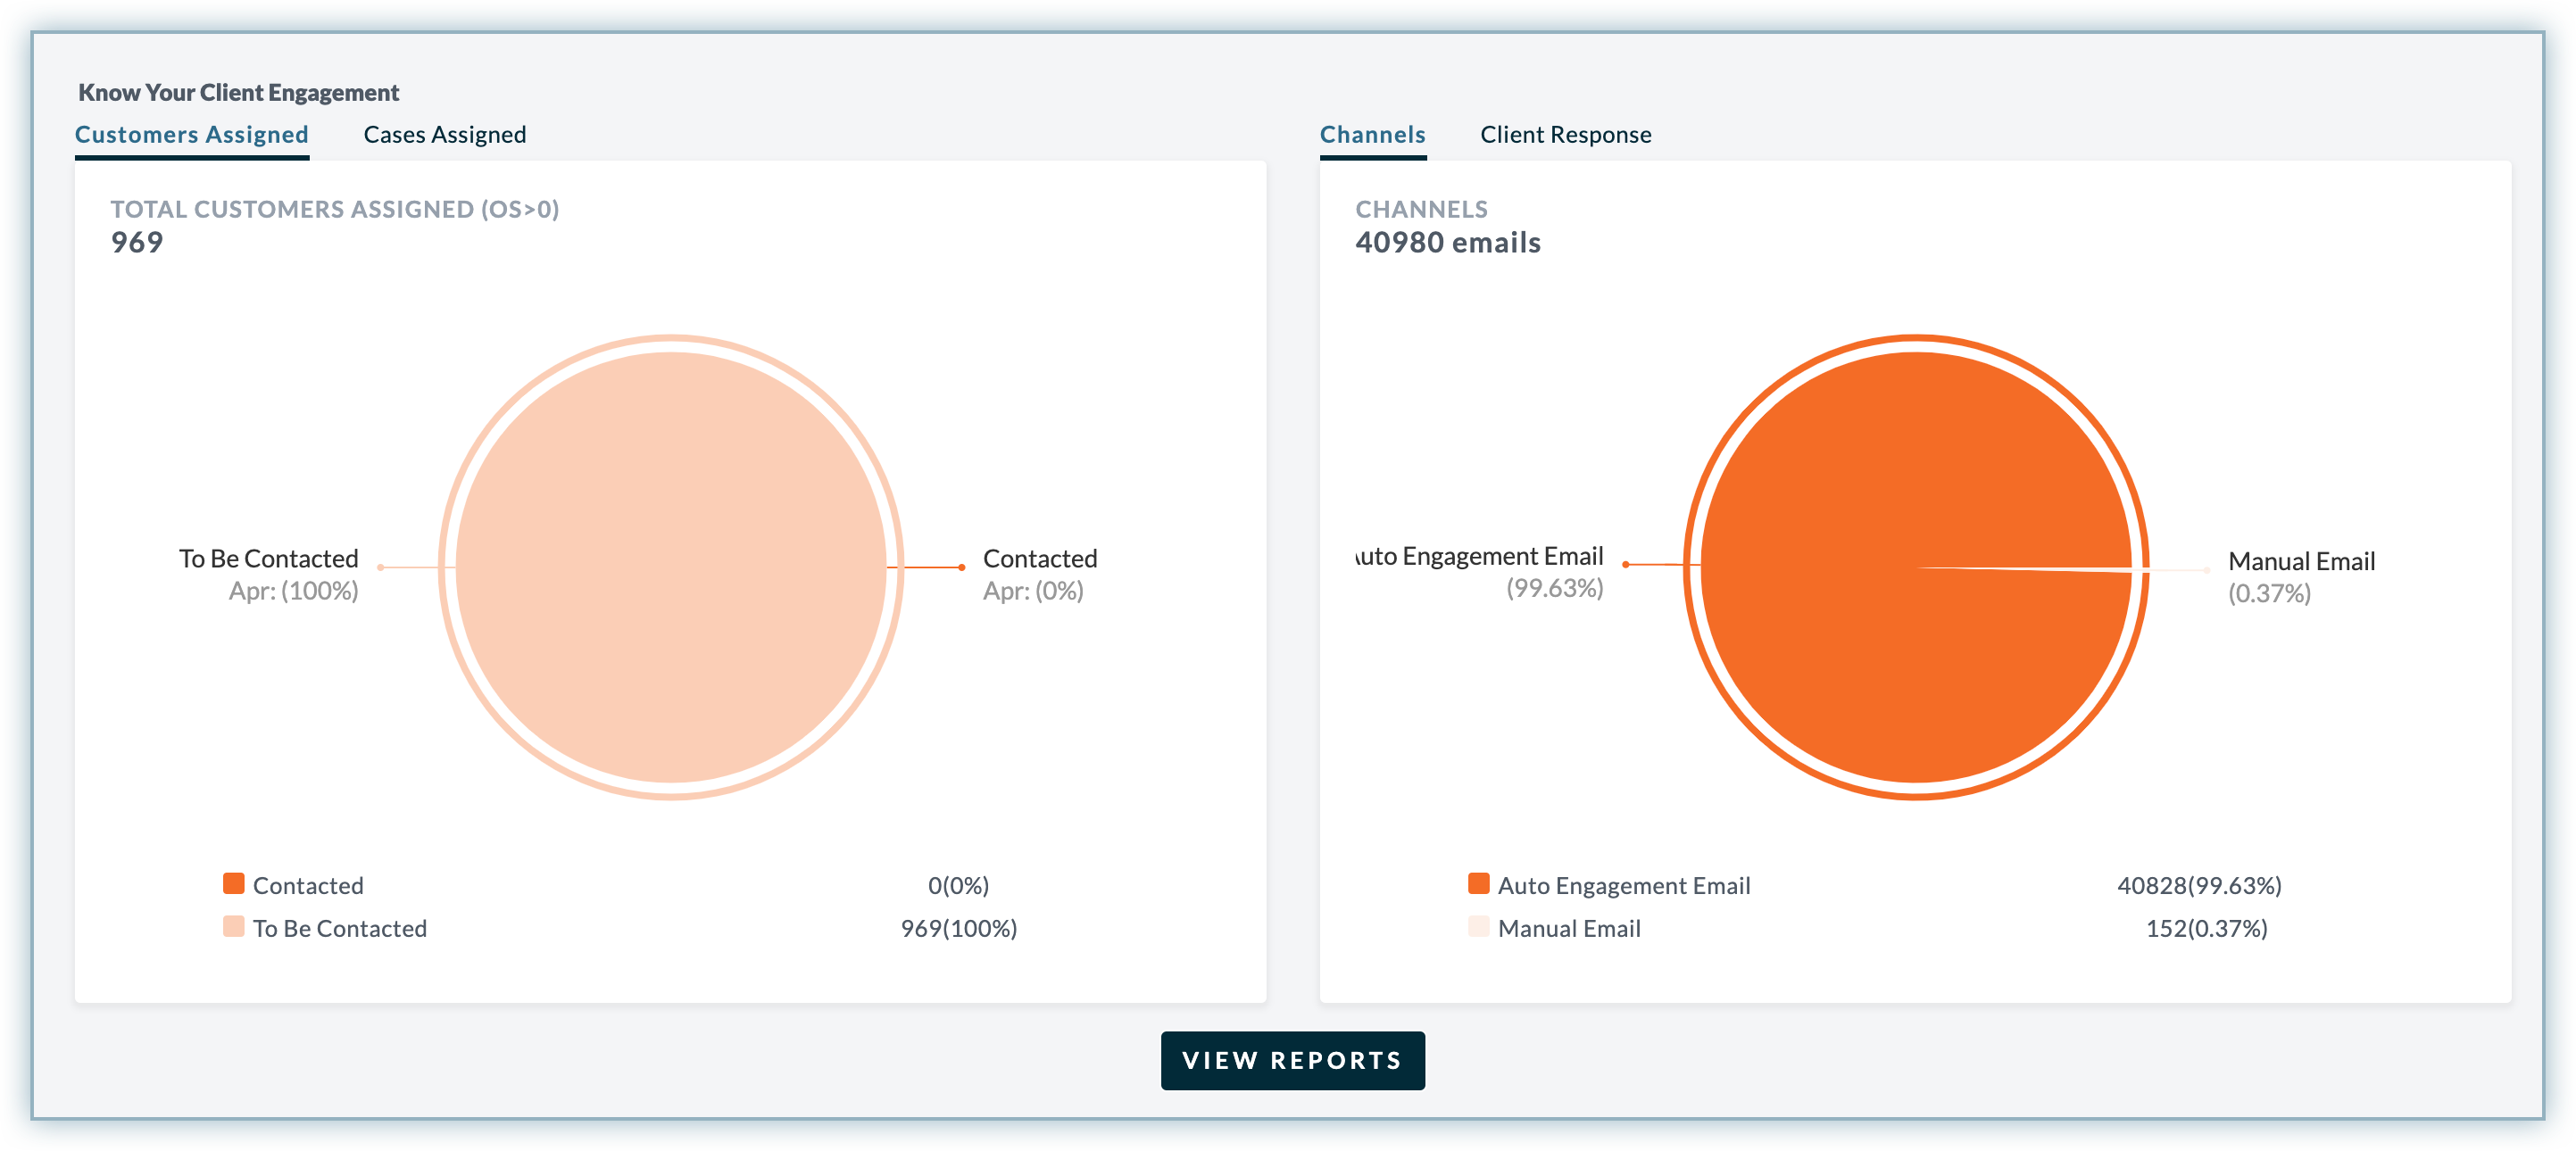
Click View Reports to access the client engagement report for all emails and SMS reminders, and gain insight into the cycle performance and customer engagement over time.
For more information, see Client Engagement Report.
Was this article helpful?