PFR Invoice Report
This detailed report shows what you have been billed for, along with a reference list of all the invoices raised during a month.
The key difference between the Commission Report and Invoice Report is that the Commission Report represents all recovered failures, including payments for invoices that were raised in any previous month but were recovered via a payment attempt in the selected month. The Invoice Report represents the status of all invoices raised in the selected month.
Follow the steps below to generate the report:
-
Log in to your Receivables account.
-
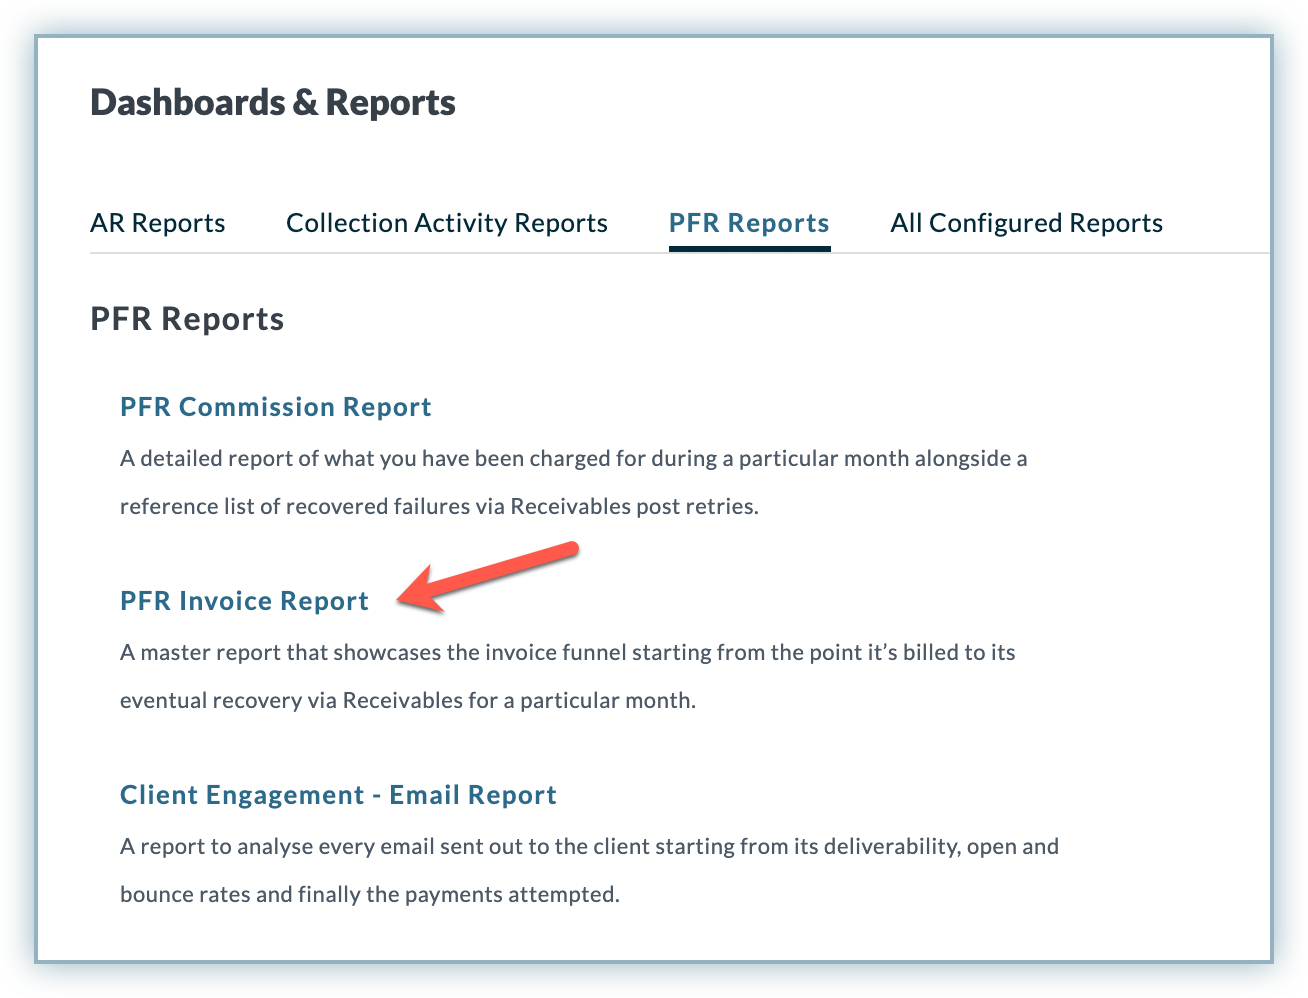
Go to Reports > PFR Reports.
-
Click PFR Invoice Report.
-
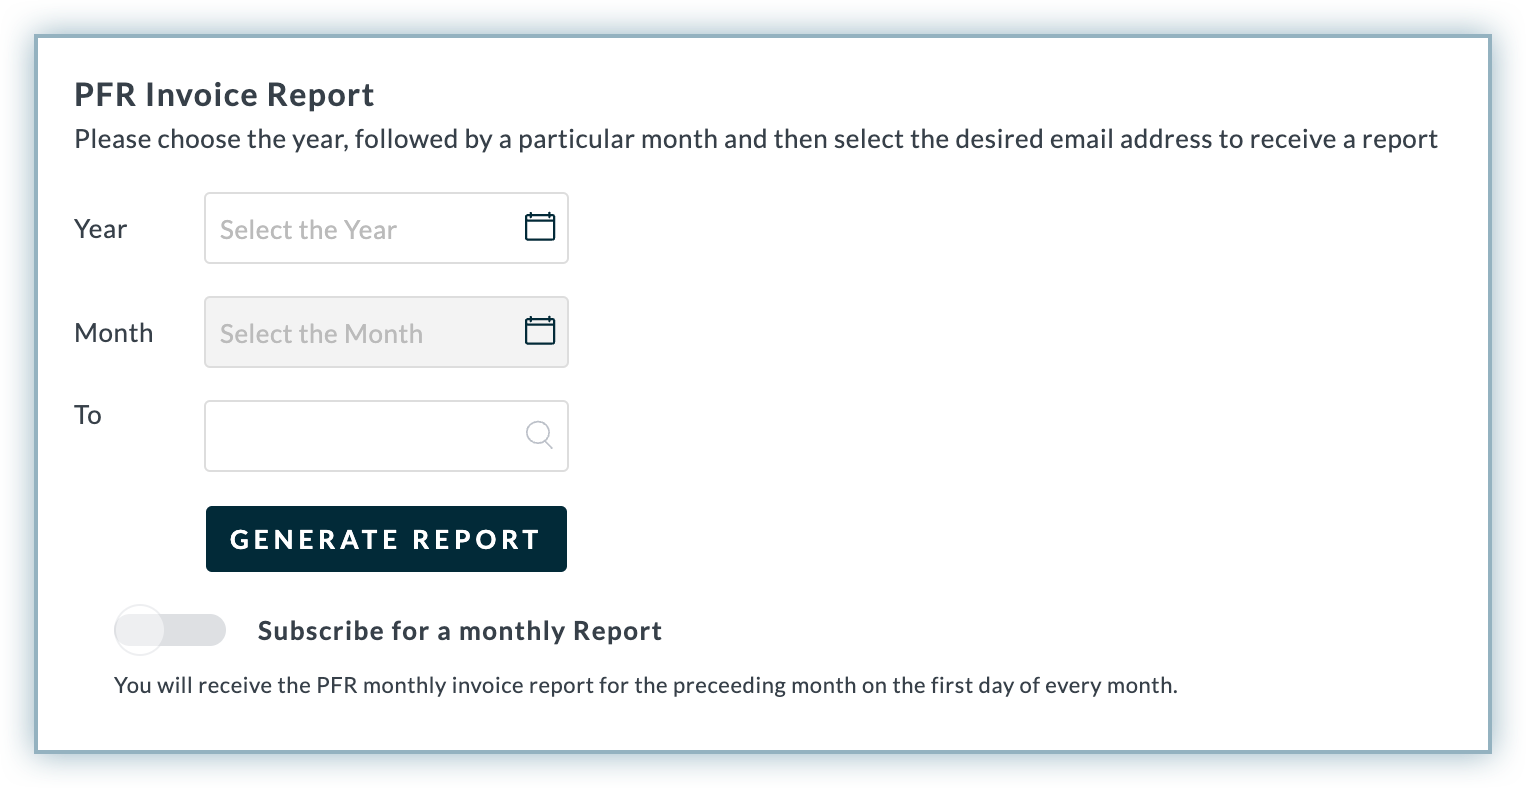
Select the Year and Month for which you want to generate the report.
-
Select the user to whom you want to send the report. Select You from the list if you want to receive the email.
-
Enable Subscribe for a monthly report if you want to receive the PFR Invoice Report monthly.
-
Click GENERATE REPORT. You will receive an email with a link as a call to action to download the report.
-
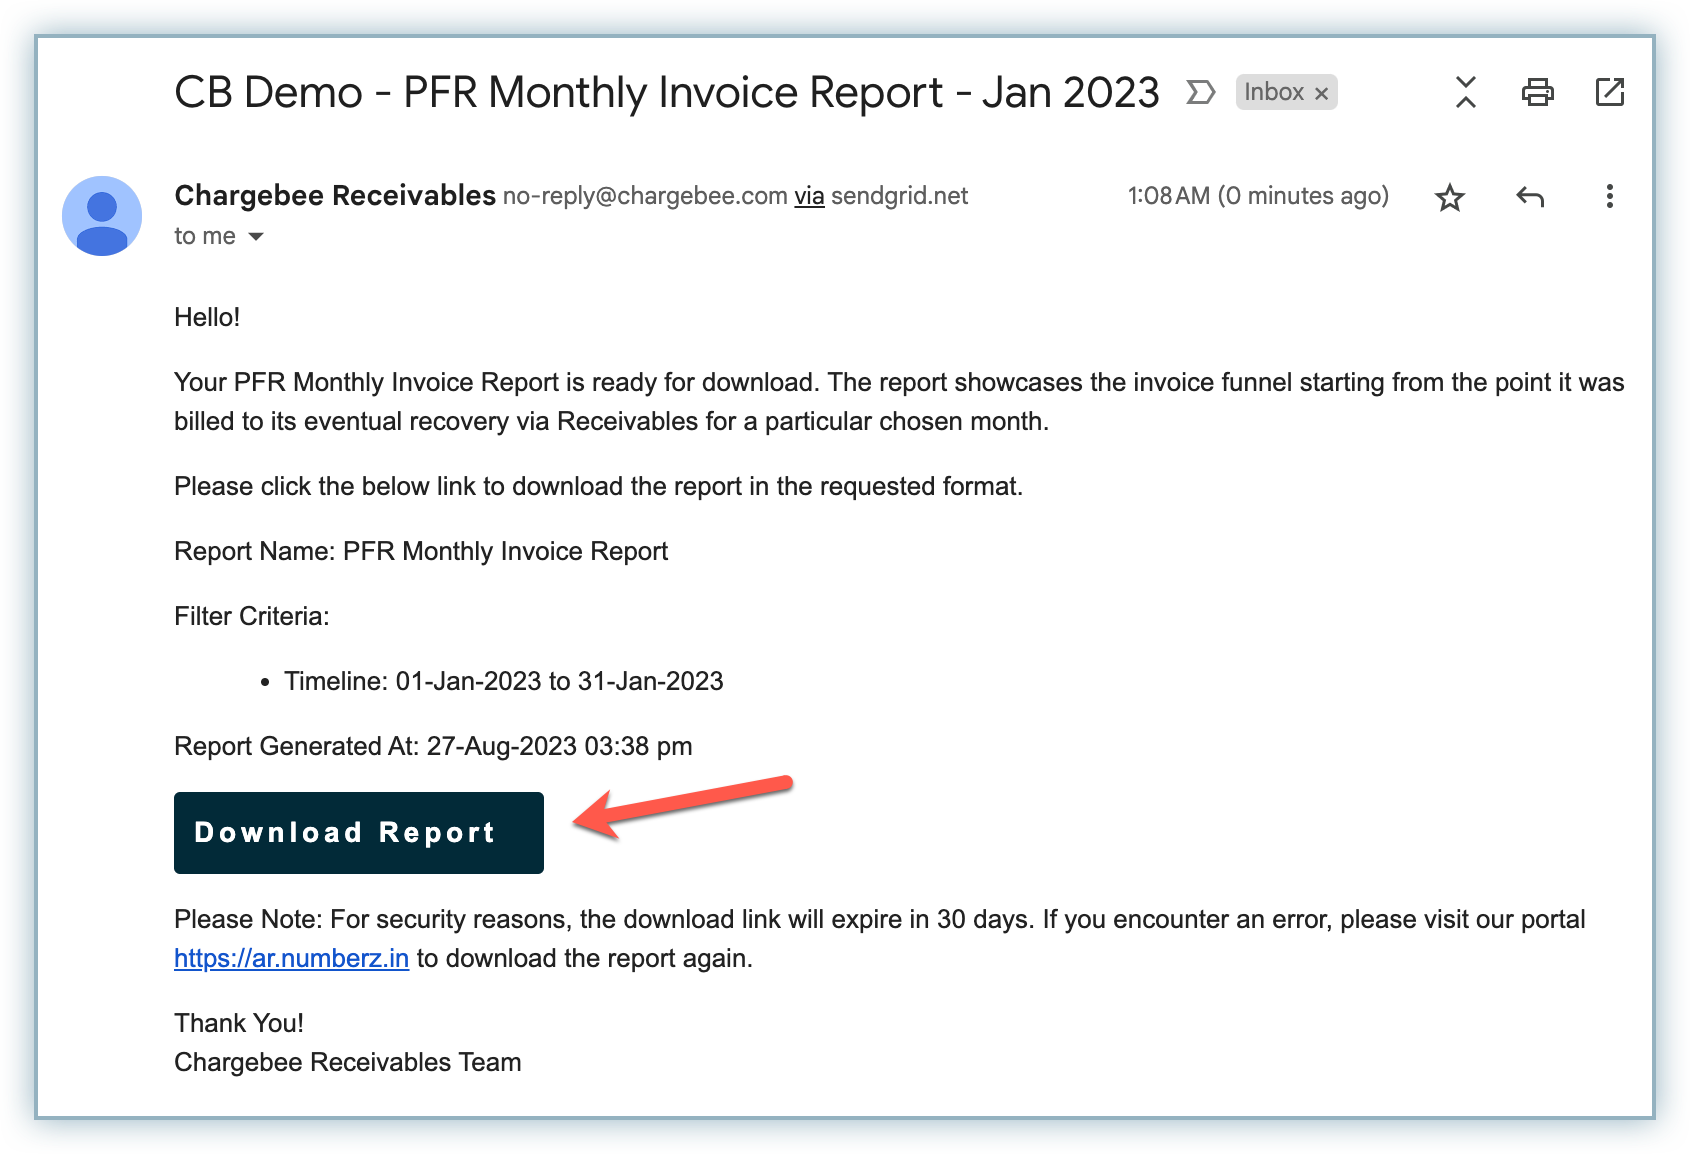
In the email, click Download Report to download the report file to your system.
Let's dive deeper into the columns and rows of the report:
Similar to the PFR Commission Report, this report also contains two sheets: Summary Report and Reference Invoice Report. The Summary Report shows a summary with numerical data for your invoices raised during the month, while the Reference Invoice Report shows the details of all the invoices, including fields like month billed, invoice status, retry status, payment attempted date, and more.
Summary Report
The summary report is divided into three sections: Payments Attempted, Number of Customers, and Number of Invoices. Each of these sections is connected to the following columns:
| Column | Description |
|---|---|
| Total Billed | The total amount of invoices that were raised during the selected month. |
| Total Payments Received | The total amount that was paid by the customer out of the total billed during the selected month. |
| Payments in Progress | The total amount of payments which are unpaid out of the total billed and is in progress. |
| Total Unrecovered Failures | The total amount of payments that failed and are yet to be recovered. |
| Retries in Progress | The total amount of unrecovered failed payments whose retries are in progress. |
| Retries Exhausted (Unrecovered) | The total amount of unrecovered failed payments for which retries are exhausted. |
| Engaged via Receivables (Overall) | The total amount of payments out of the total failed that were engaged via Receivables. |
| Total Saved | The total amount of recovered payments out of the total failed payments that were engaged via Receivables. |
Interpreting the Report
This report is not as complex or interconnected as the Commission Report, as it does not have a fully connected step-down funnel. It simply represents necessary information about the invoices raised in the selected month in the form of columns connected to each other partially as listed below.
This report has three sets of connected columns that form separate funnels:
-
Set 1 – Total Billed, Total Payments Received, and Payments in Progress: Here, Total Billed represents the total amount of invoices that were raised or billed during the selected month. Out of the total billed, Total Payments Received is the amount that the customer has already paid, and the pending payments are under Payments in Progress.
-
Set 2 - Total Unrecovered Failures, Retries in Progress, Retries Exhausted (Unrecovered), and Engaged via Receivables (Overall): Here, Total Unrecovered Failures represents the total amount of payments out of the total billed that failed but are still unrecovered. Out of the total unrecovered failures, Retries in Progress shows the payments for which retries are in progress. Out of the Total Unrecovered Failures, the payments that have all retries exhausted fall under Retries Exhausted (Unrecovered).
-
Set 3: The overall payments that were engaged via Receivables fall under Engaged via Receivables (Overall). Out of these, Total Saved indicates the total amount of payments that were recovered after failing.
Once you understand this, let's see how you can map the rows and columns of the report:
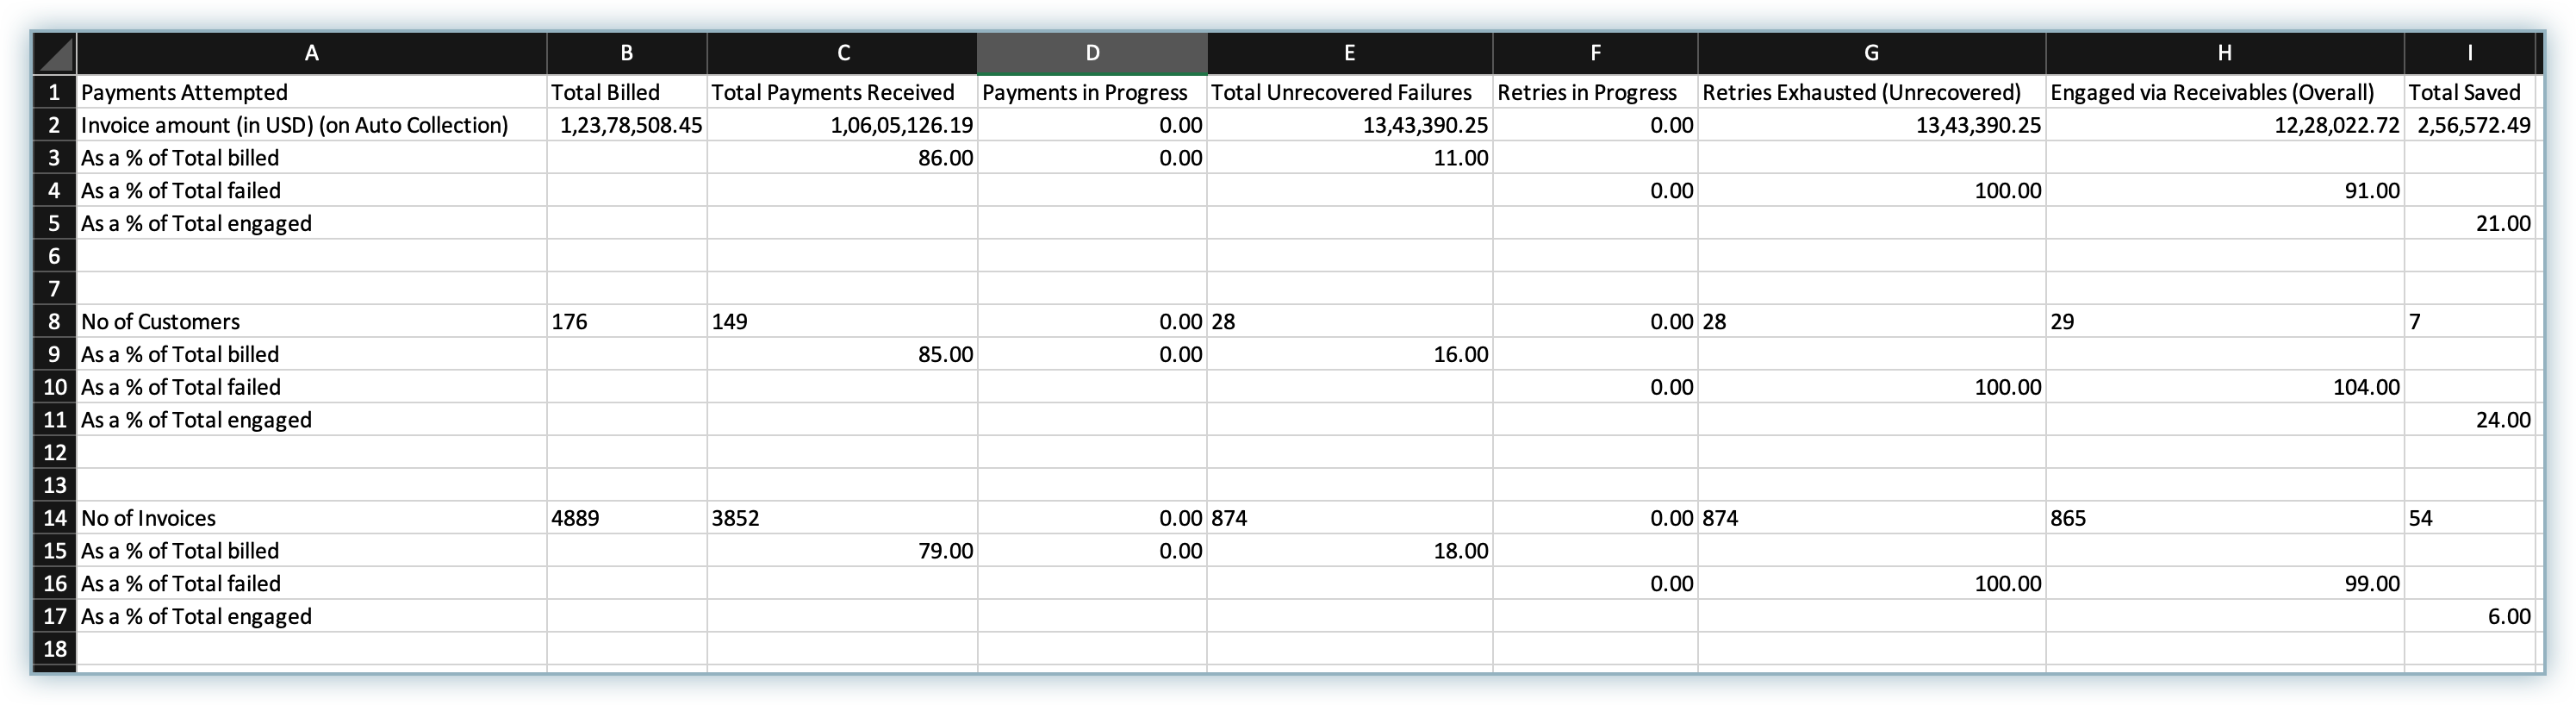
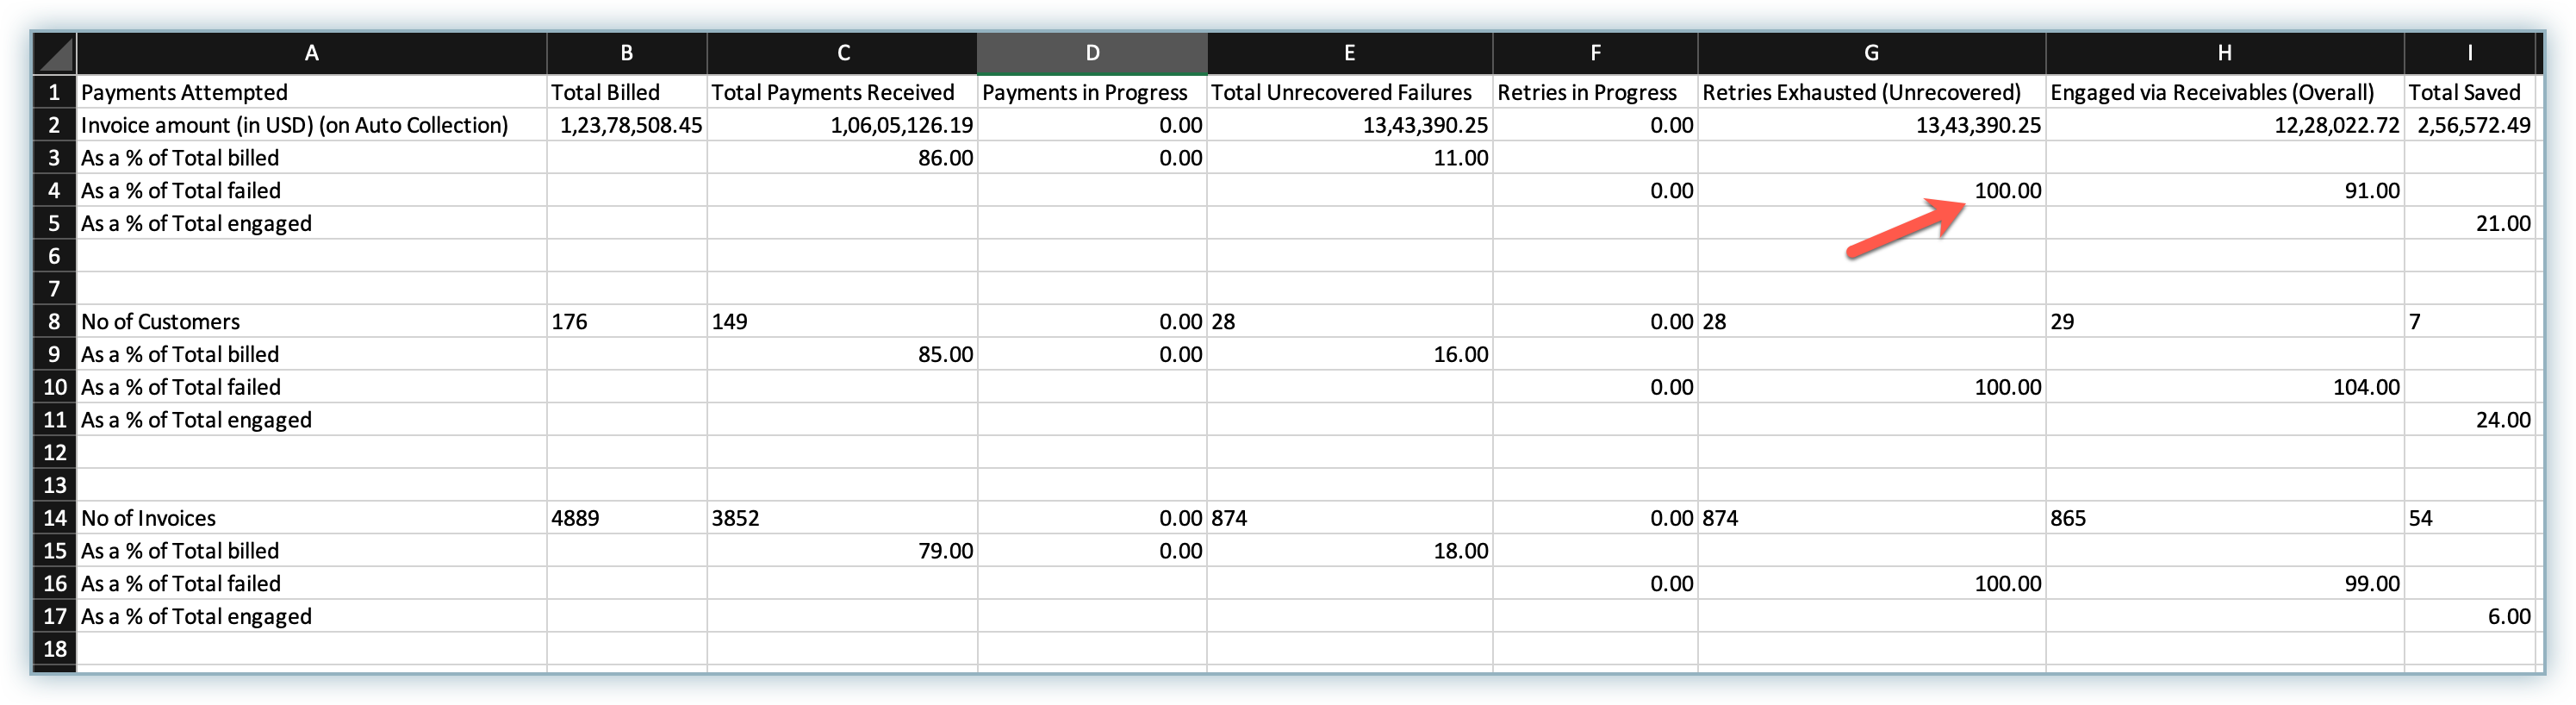
Example 1: On the left, you have As % of Total failed, and there is a value of 100.00 under the column Retries Exhausted (Unrecovered). This means that 100% of Total Failed payments (row) had Retries Exhausted (column).
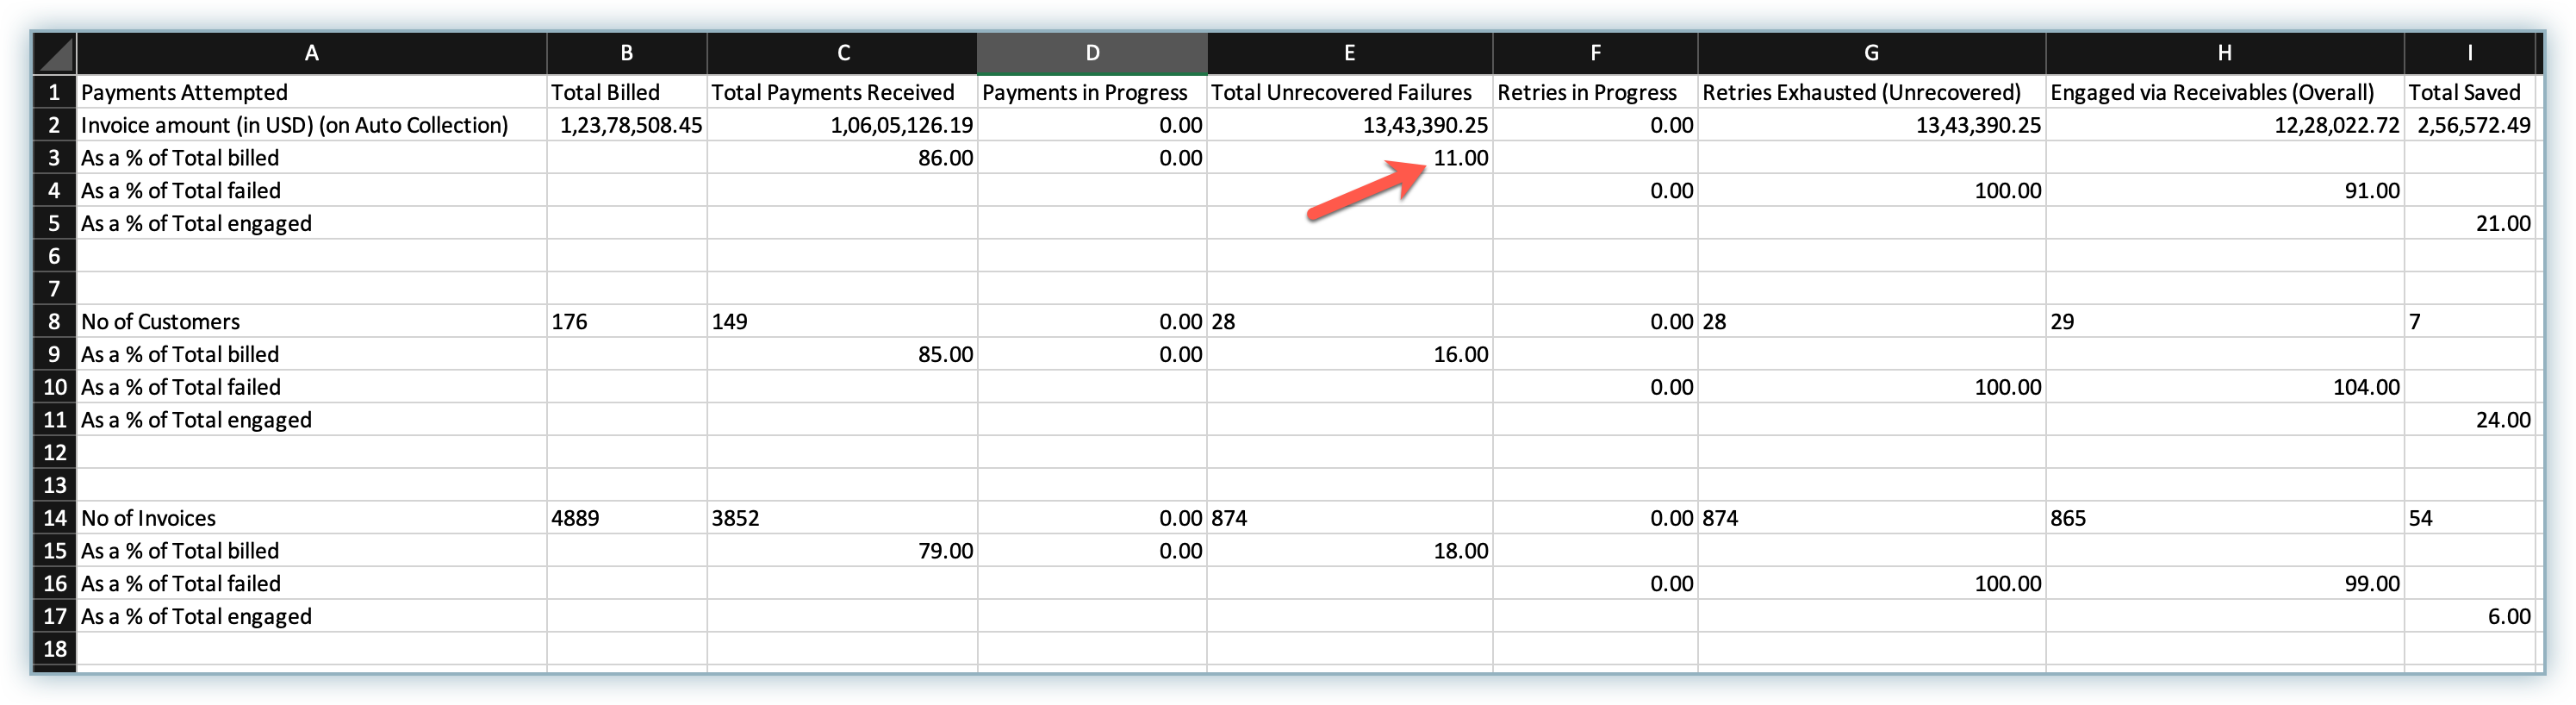
Example 2: On the left, you have As % of Total billed, and there is a value of 11.00 under the column Total Unrecovered Failures. This means that 11% of the Total Billed invoice payments (row) had failed payments and are still unrecovered.
Similarly, you can map other rows and columns and get the proper context of the values under them.
Also, the Number of Customers section contains the data as a percentage of the number of customers, and the Number of Invoices includes the data as a percentage of the number of invoices.
Let's understand these sections with an example for each section:
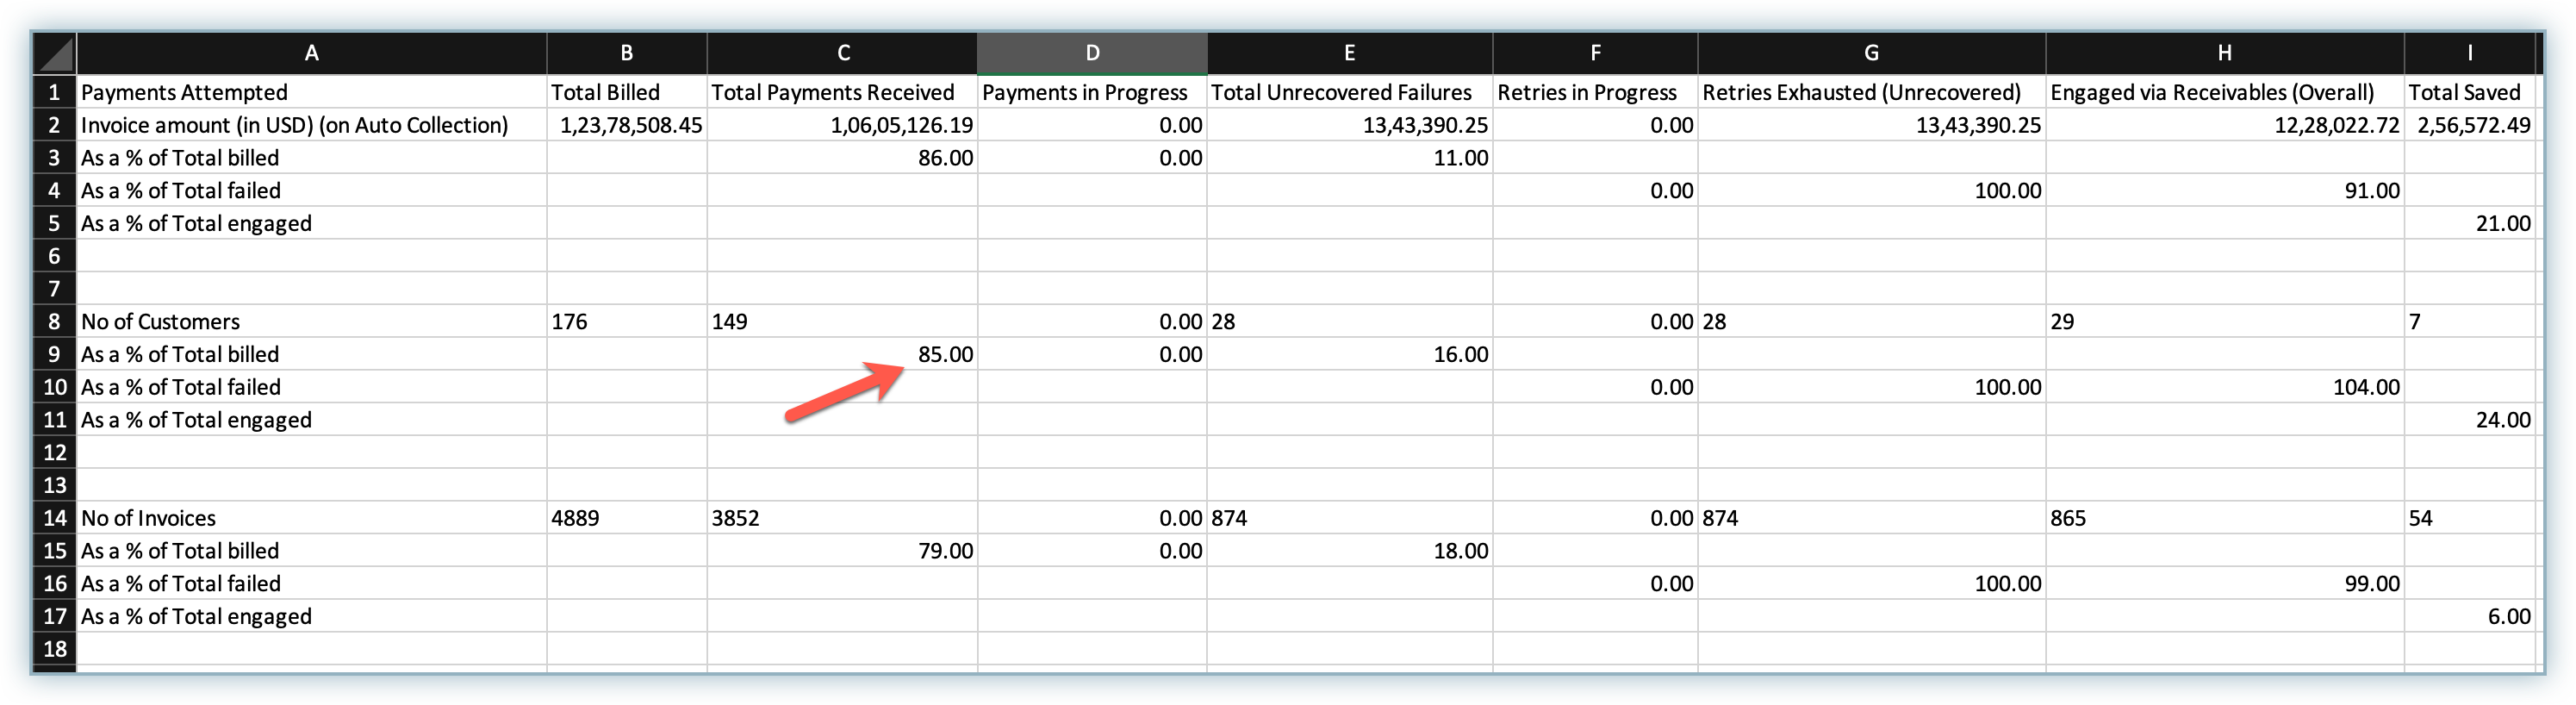
Number of Customers – Example: On the left, we have As a % of Total billed with a value of 85.00 under the Total Payments Received column. This means that 85% of the total billed customers (row) had already paid and their payments have been received (column).
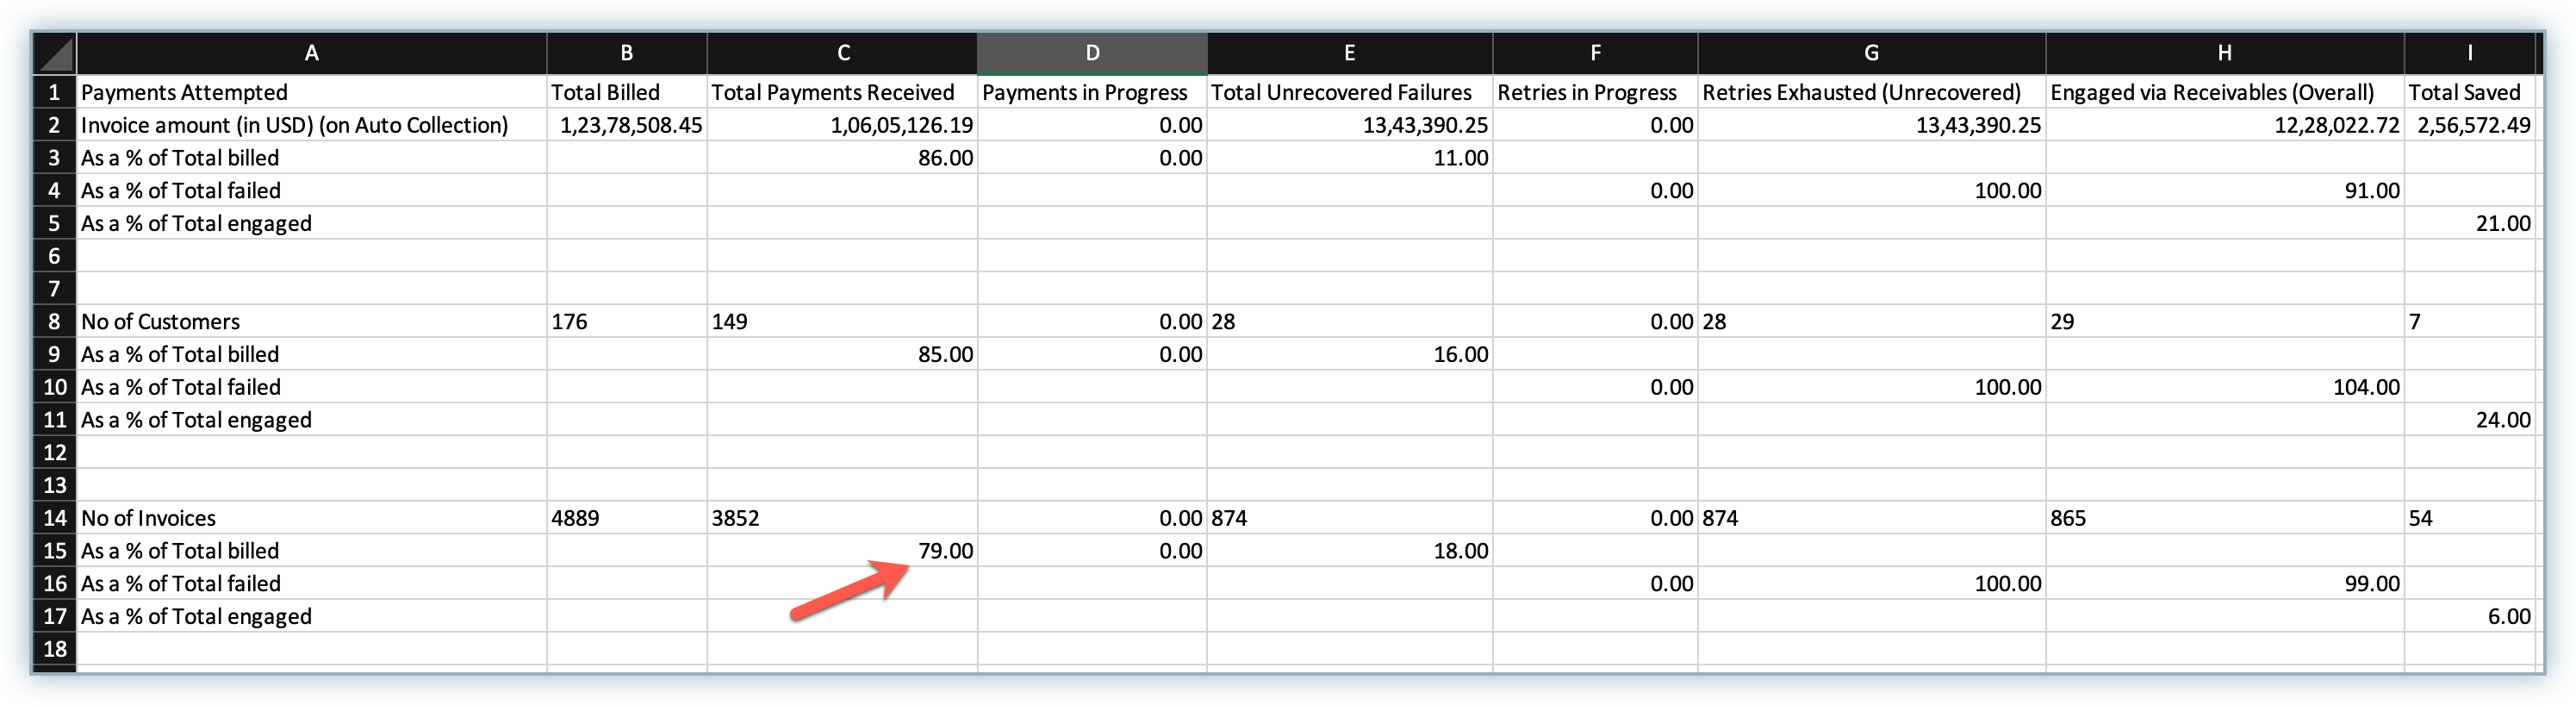
Number of Invoices – Example: On the left, we have As a % of Total billed with a value of 79.00 under the Total Payments Received column. This means that 79% of the total billed invoices (row) are already paid (column) in the selected month.
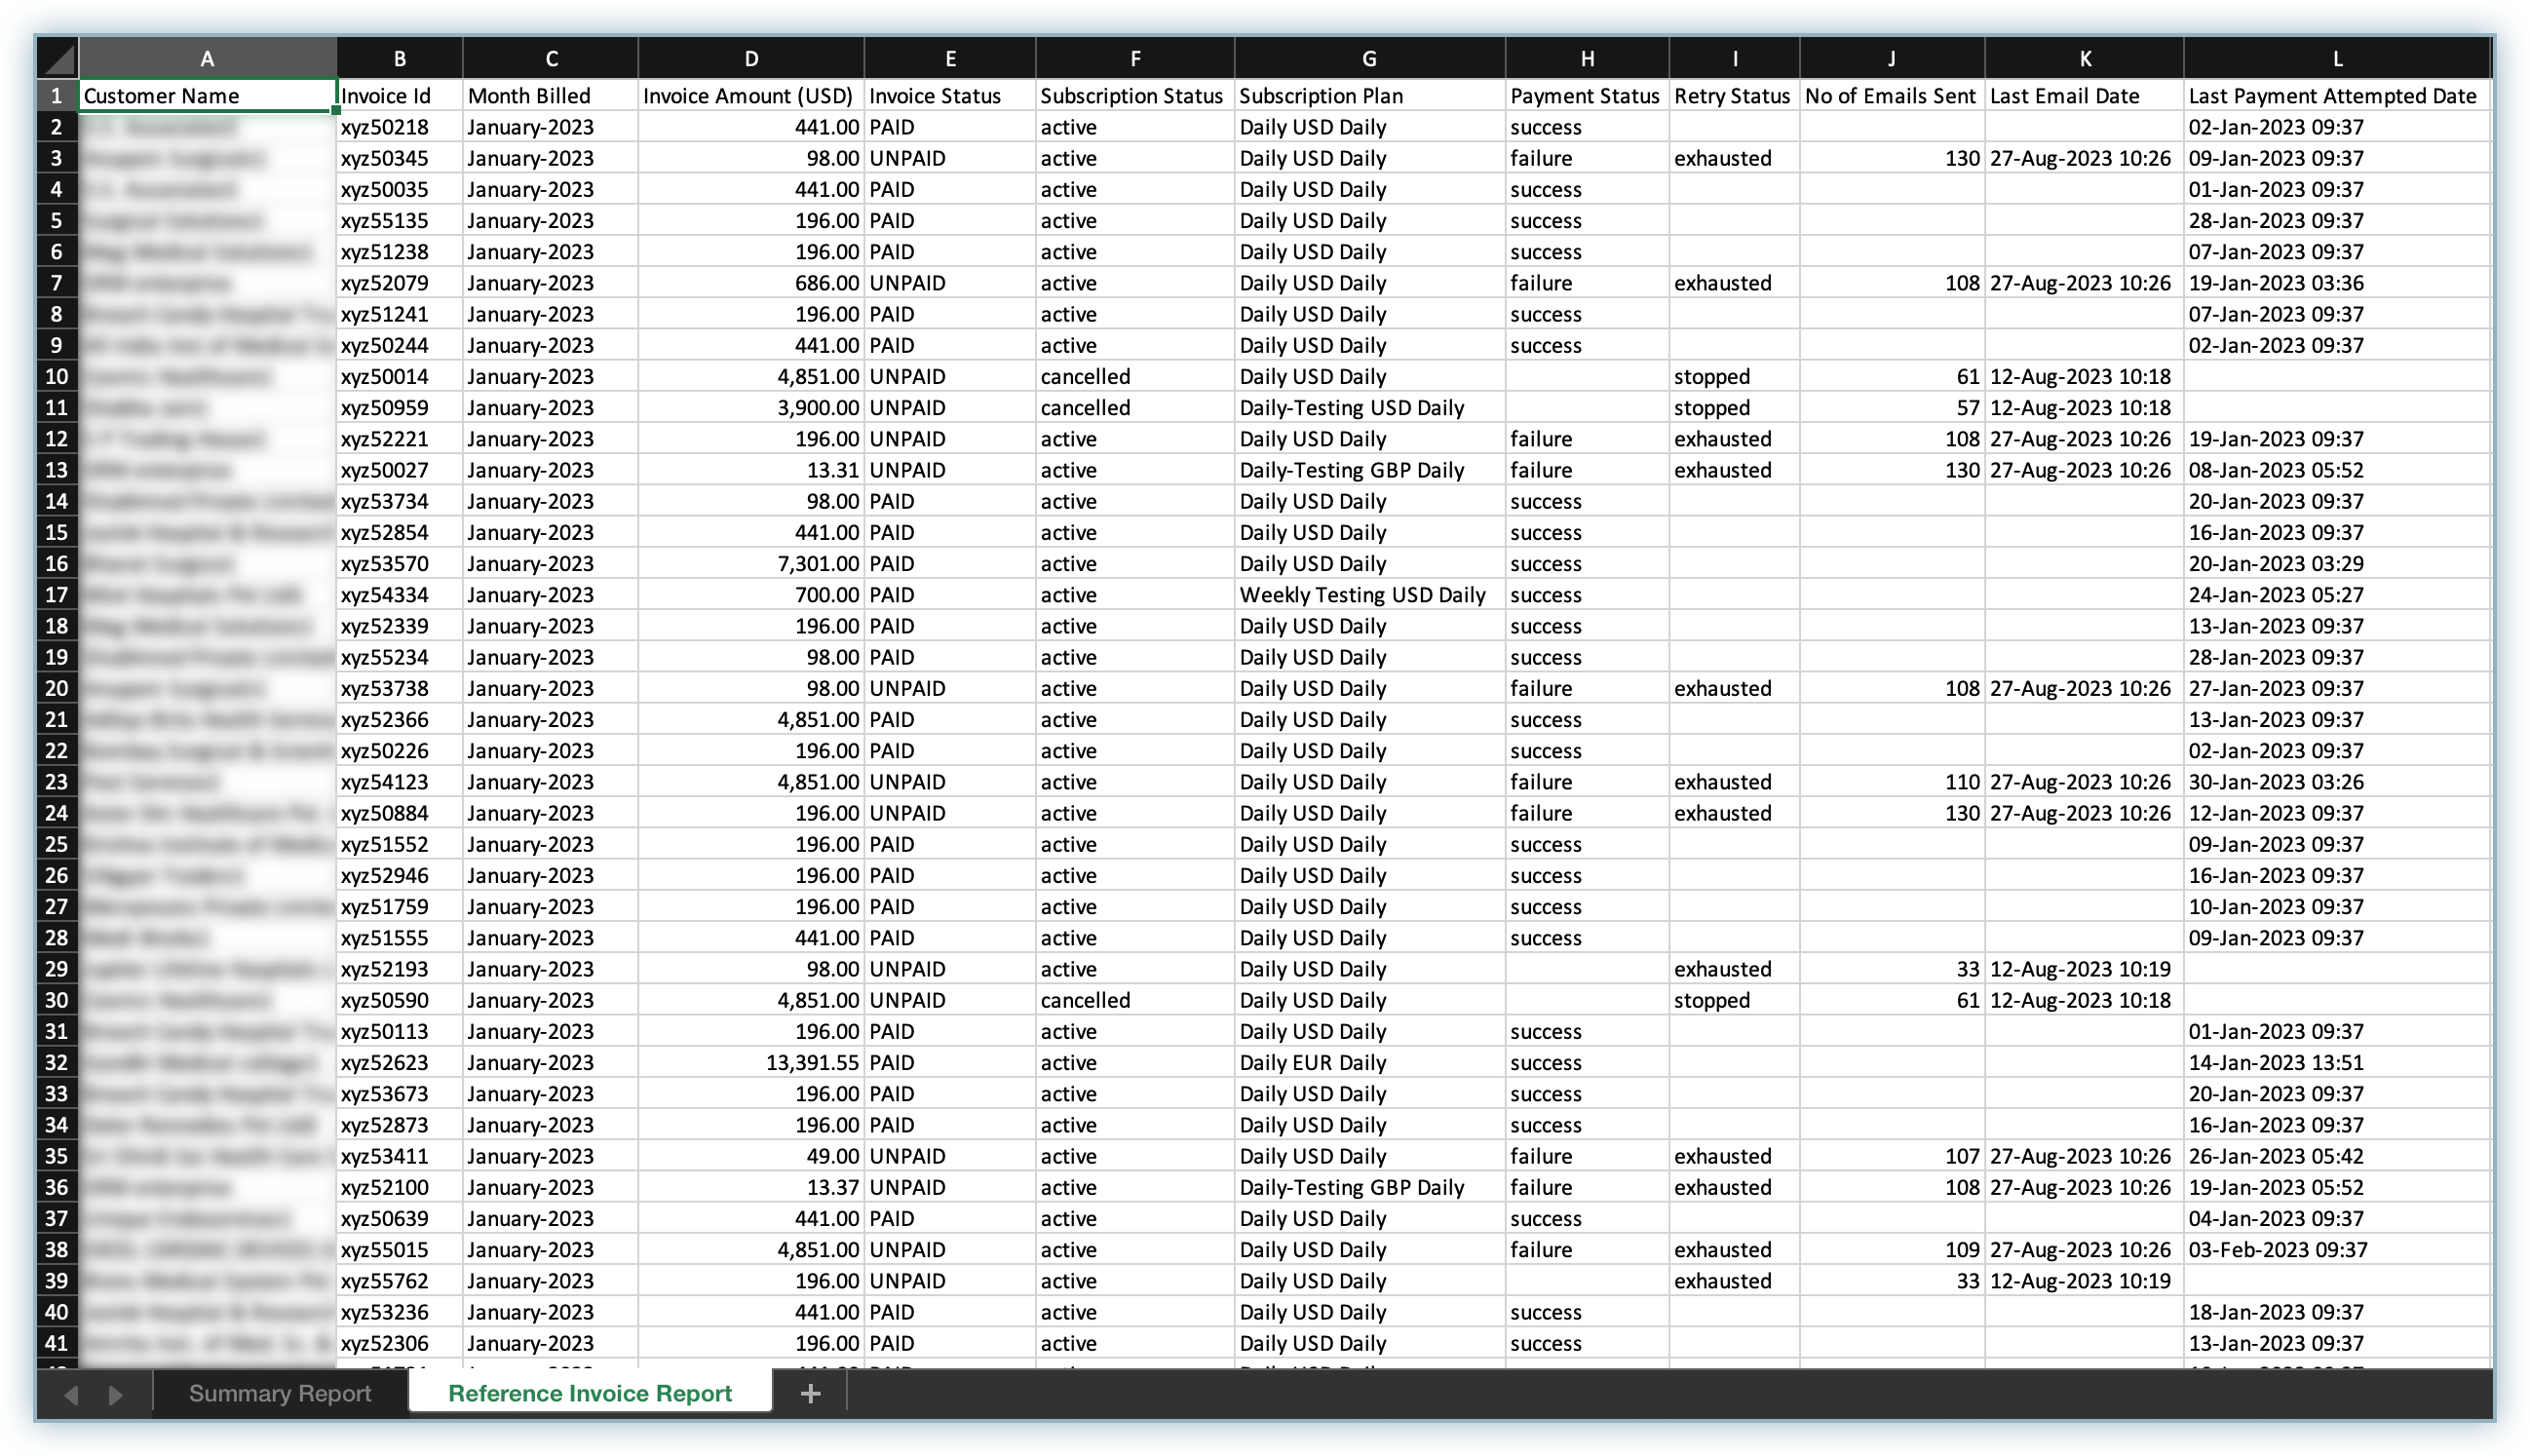
Reference Invoice Report
The second sheet under the workbook is the Reference Invoice Report, which contains all the essential fields to dive deeper into the report. You can find all the customer and invoice-specific details in this report, including details such as Month Billed, Invoice Status, Subscription Status, Payment Status, Retry Status, Last Payment Attempted Date, and more.
Was this article helpful?