Play Dashboard & Metrics
Availability
Growth solutions are currently in early access and available only for Chargebee Billing and Retention customers at no additional cost during the EAP period. Sign up to join the Early Adopter Program to learn more about these solutions.
Introduction
Chargebee Growth Solution provides detailed Play-level metrics and reporting, enabling you to evaluate how your Plays are performing. These insights help you understand subscriber engagement, Offer effectiveness, and the revenue impact of your Growth initiatives.
Key Metrics
When you navigate to the Plays module or dashboard in your Chargebee Growth Solution site, the following metrics are tracked to measure Play performance:
| Metric Name | Description |
|---|---|
| Customers engaged | The total number of customers engaged by Offers deployed within Plays. Note: If the same customer is engaged across two different Plays, they are counted separately for each Play. |
| Accepts | Acceptance rate is calculated as the percentage of customers who accepted your Offers. Note: A customer acceptance is counted once per Play. If the same customer accepts Offers across two Plays, both are counted. |
| Offer acceptance rate | The percentage of customers engaged who accepted Offers, calculated as: Number of Offer Accepts / Number of customers engaged. |
| Fulfilled | The number of Offers that are successfully applied to the customer’s account in your billing system. |
| Fulfilment rate | The percentage of Offers that are successfully fulfilled compared to the total customers engaged, calculated as Number of fulfilments / Number of customers engaged. |
| Revenue | The total annual recurring revenue(ARR) generated. Note: the recurring revenue logic varies based on the objective of the Play. For Acquisition Plays this is the New ARR. For Expansion Plays this is the Expansion ARR generated as a result of Offer fulfilments. |
All metrics are captured at the Offer level and aggregated to give you visibility across each Play and your entire Growth Solution setup.
Additional Metrics for Acquisition Plays
| Metric Name | Description |
|---|---|
| Revenue | Recurring Revenue generated from new customers |
| Activations | The number of customer activations. |
| Trial Conversion Rate | Percentage of trials that converted to paid plans. |
| Checkout Started | The number of customers who started checkout. |
| Checkout Completed | The number of customers who completed checkout. |
| Checkout Conversion rate | The percentage of customers who completed checkout. |
Additional Metrics for Expansion Plays
| Metric Name | Description |
|---|---|
| Revenue | The total annual recurring revenue generated from expanded customers. |
| Expansions | The number of customer expansions. |
Additional Metrics for Retention Plays
| Metric Name | Description |
|---|---|
| Revenue | The total annual recurring revenue generated from retained customers. |
| Repurchases | The number of customer repurchases. |
Accessing Play Metrics
There are two primary areas where you can track Play metrics in Chargebee Growth Solution:
Play management module
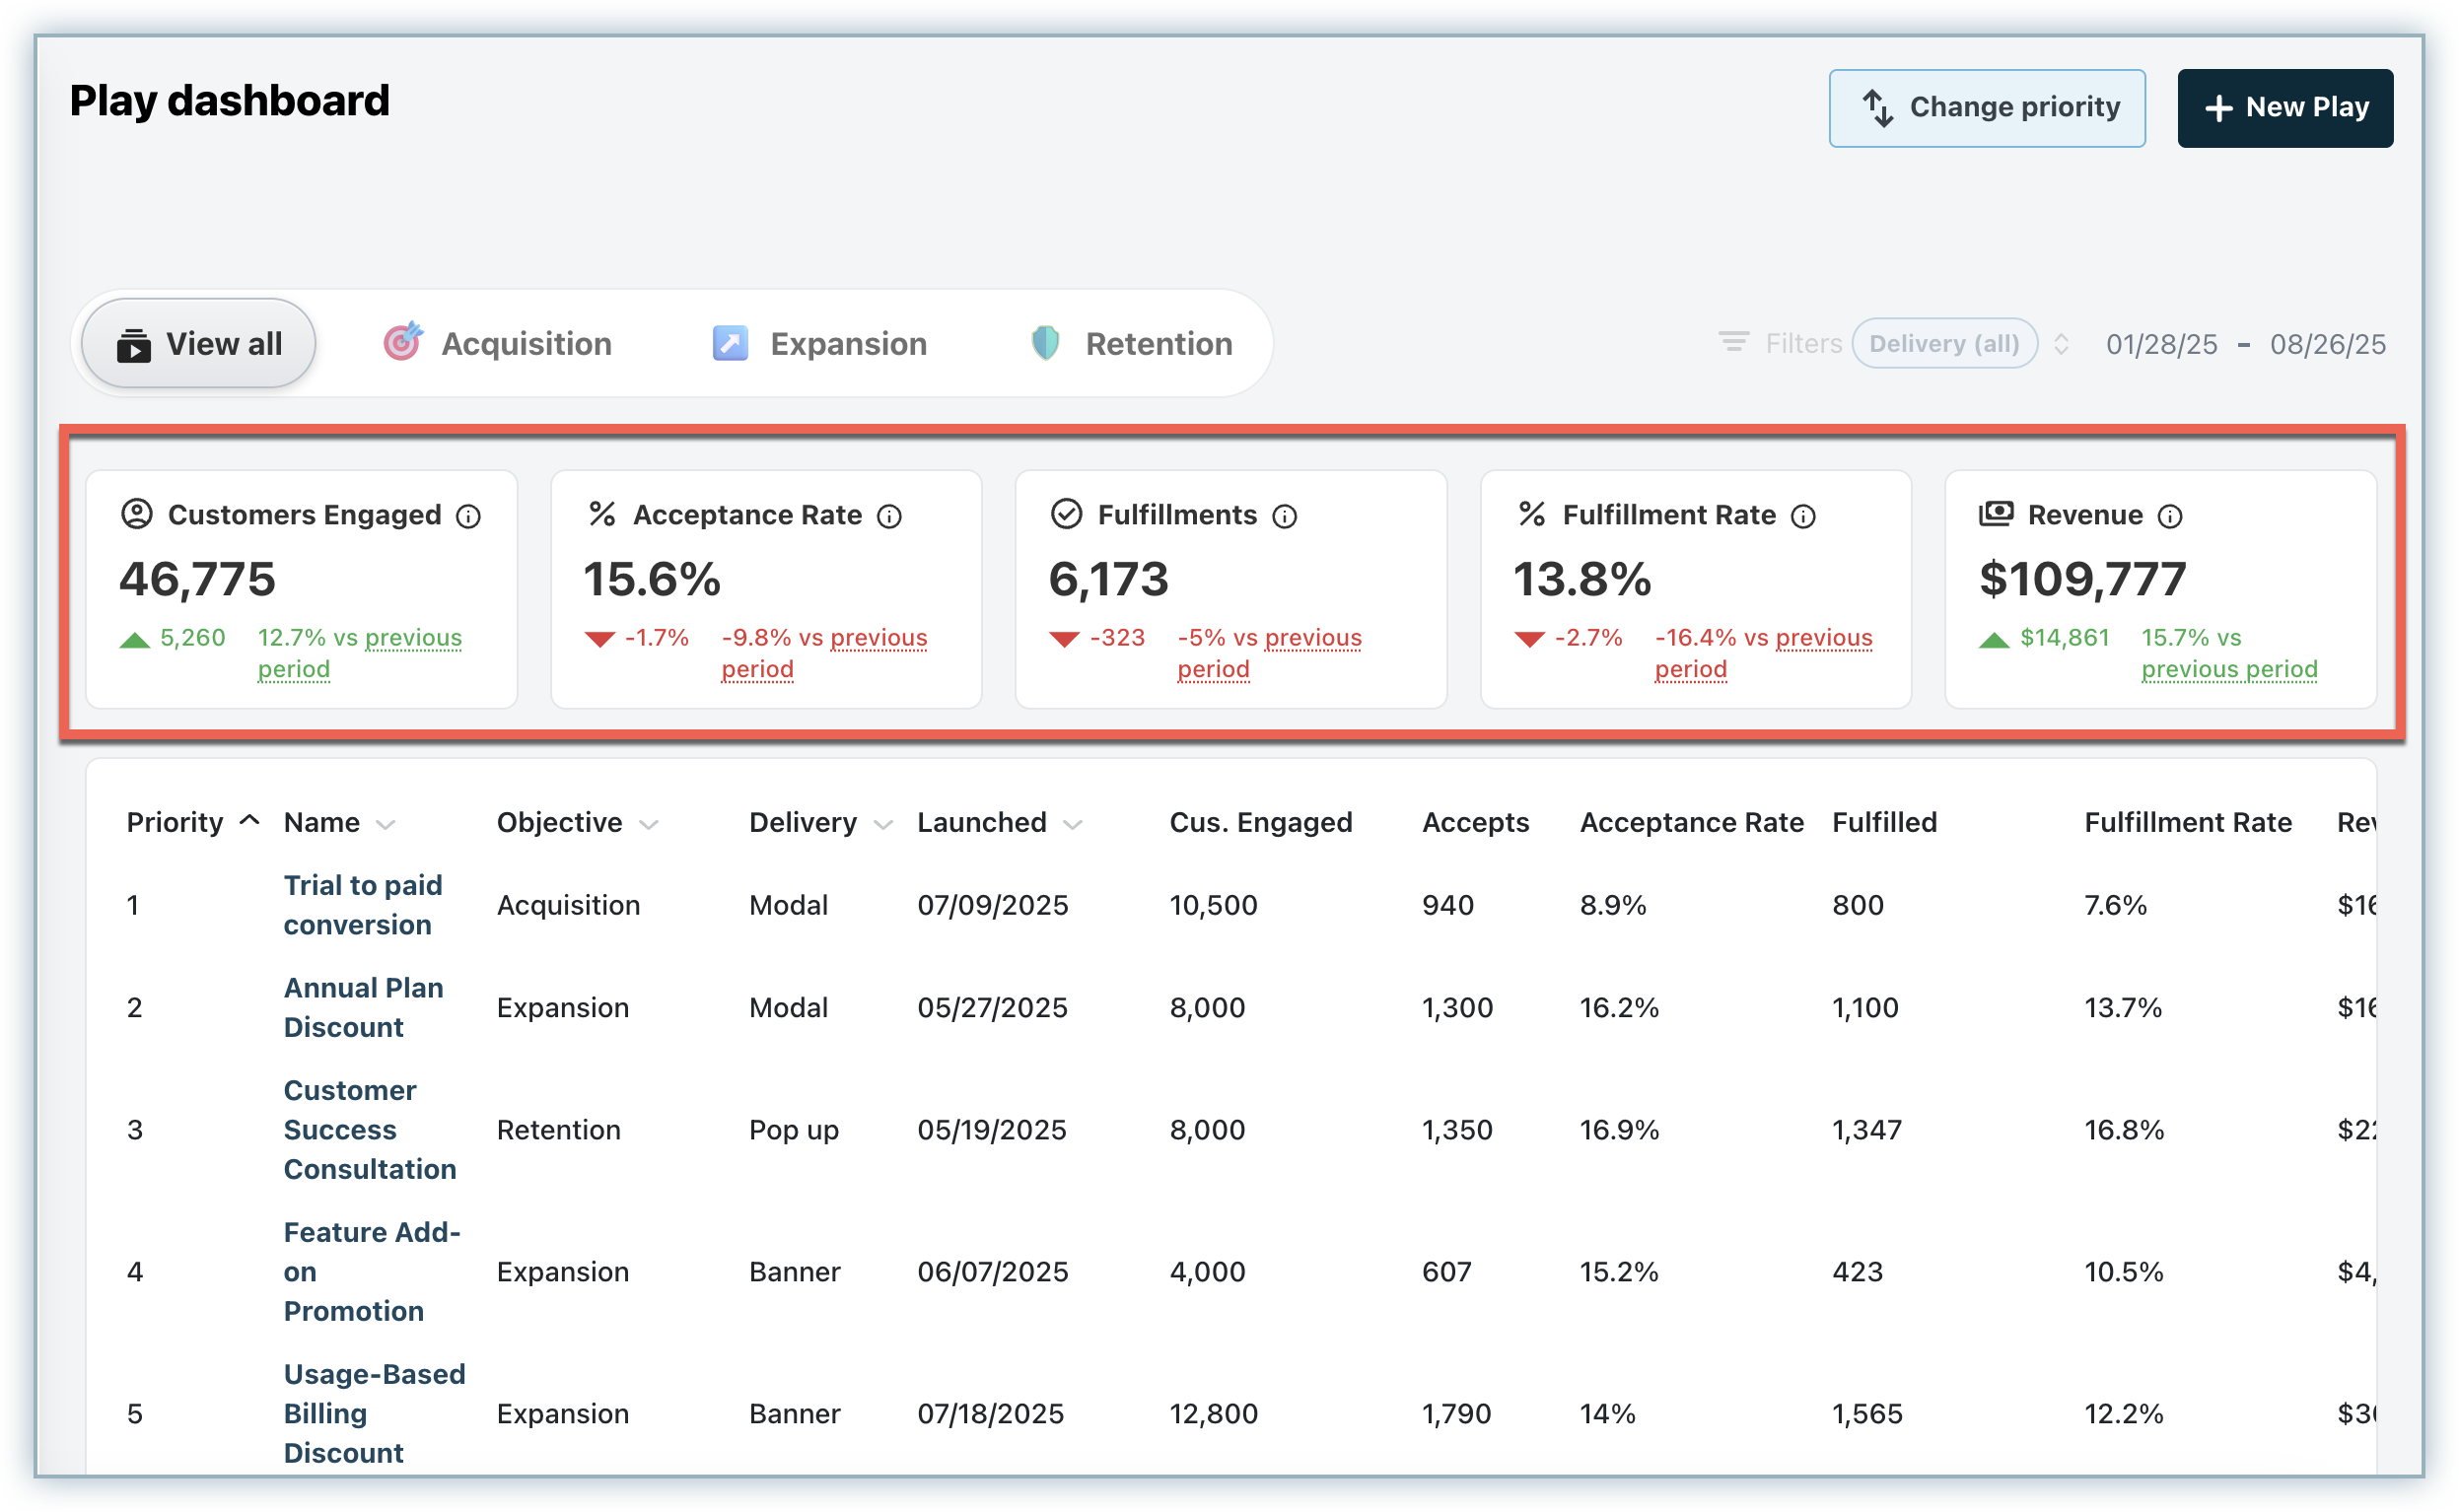
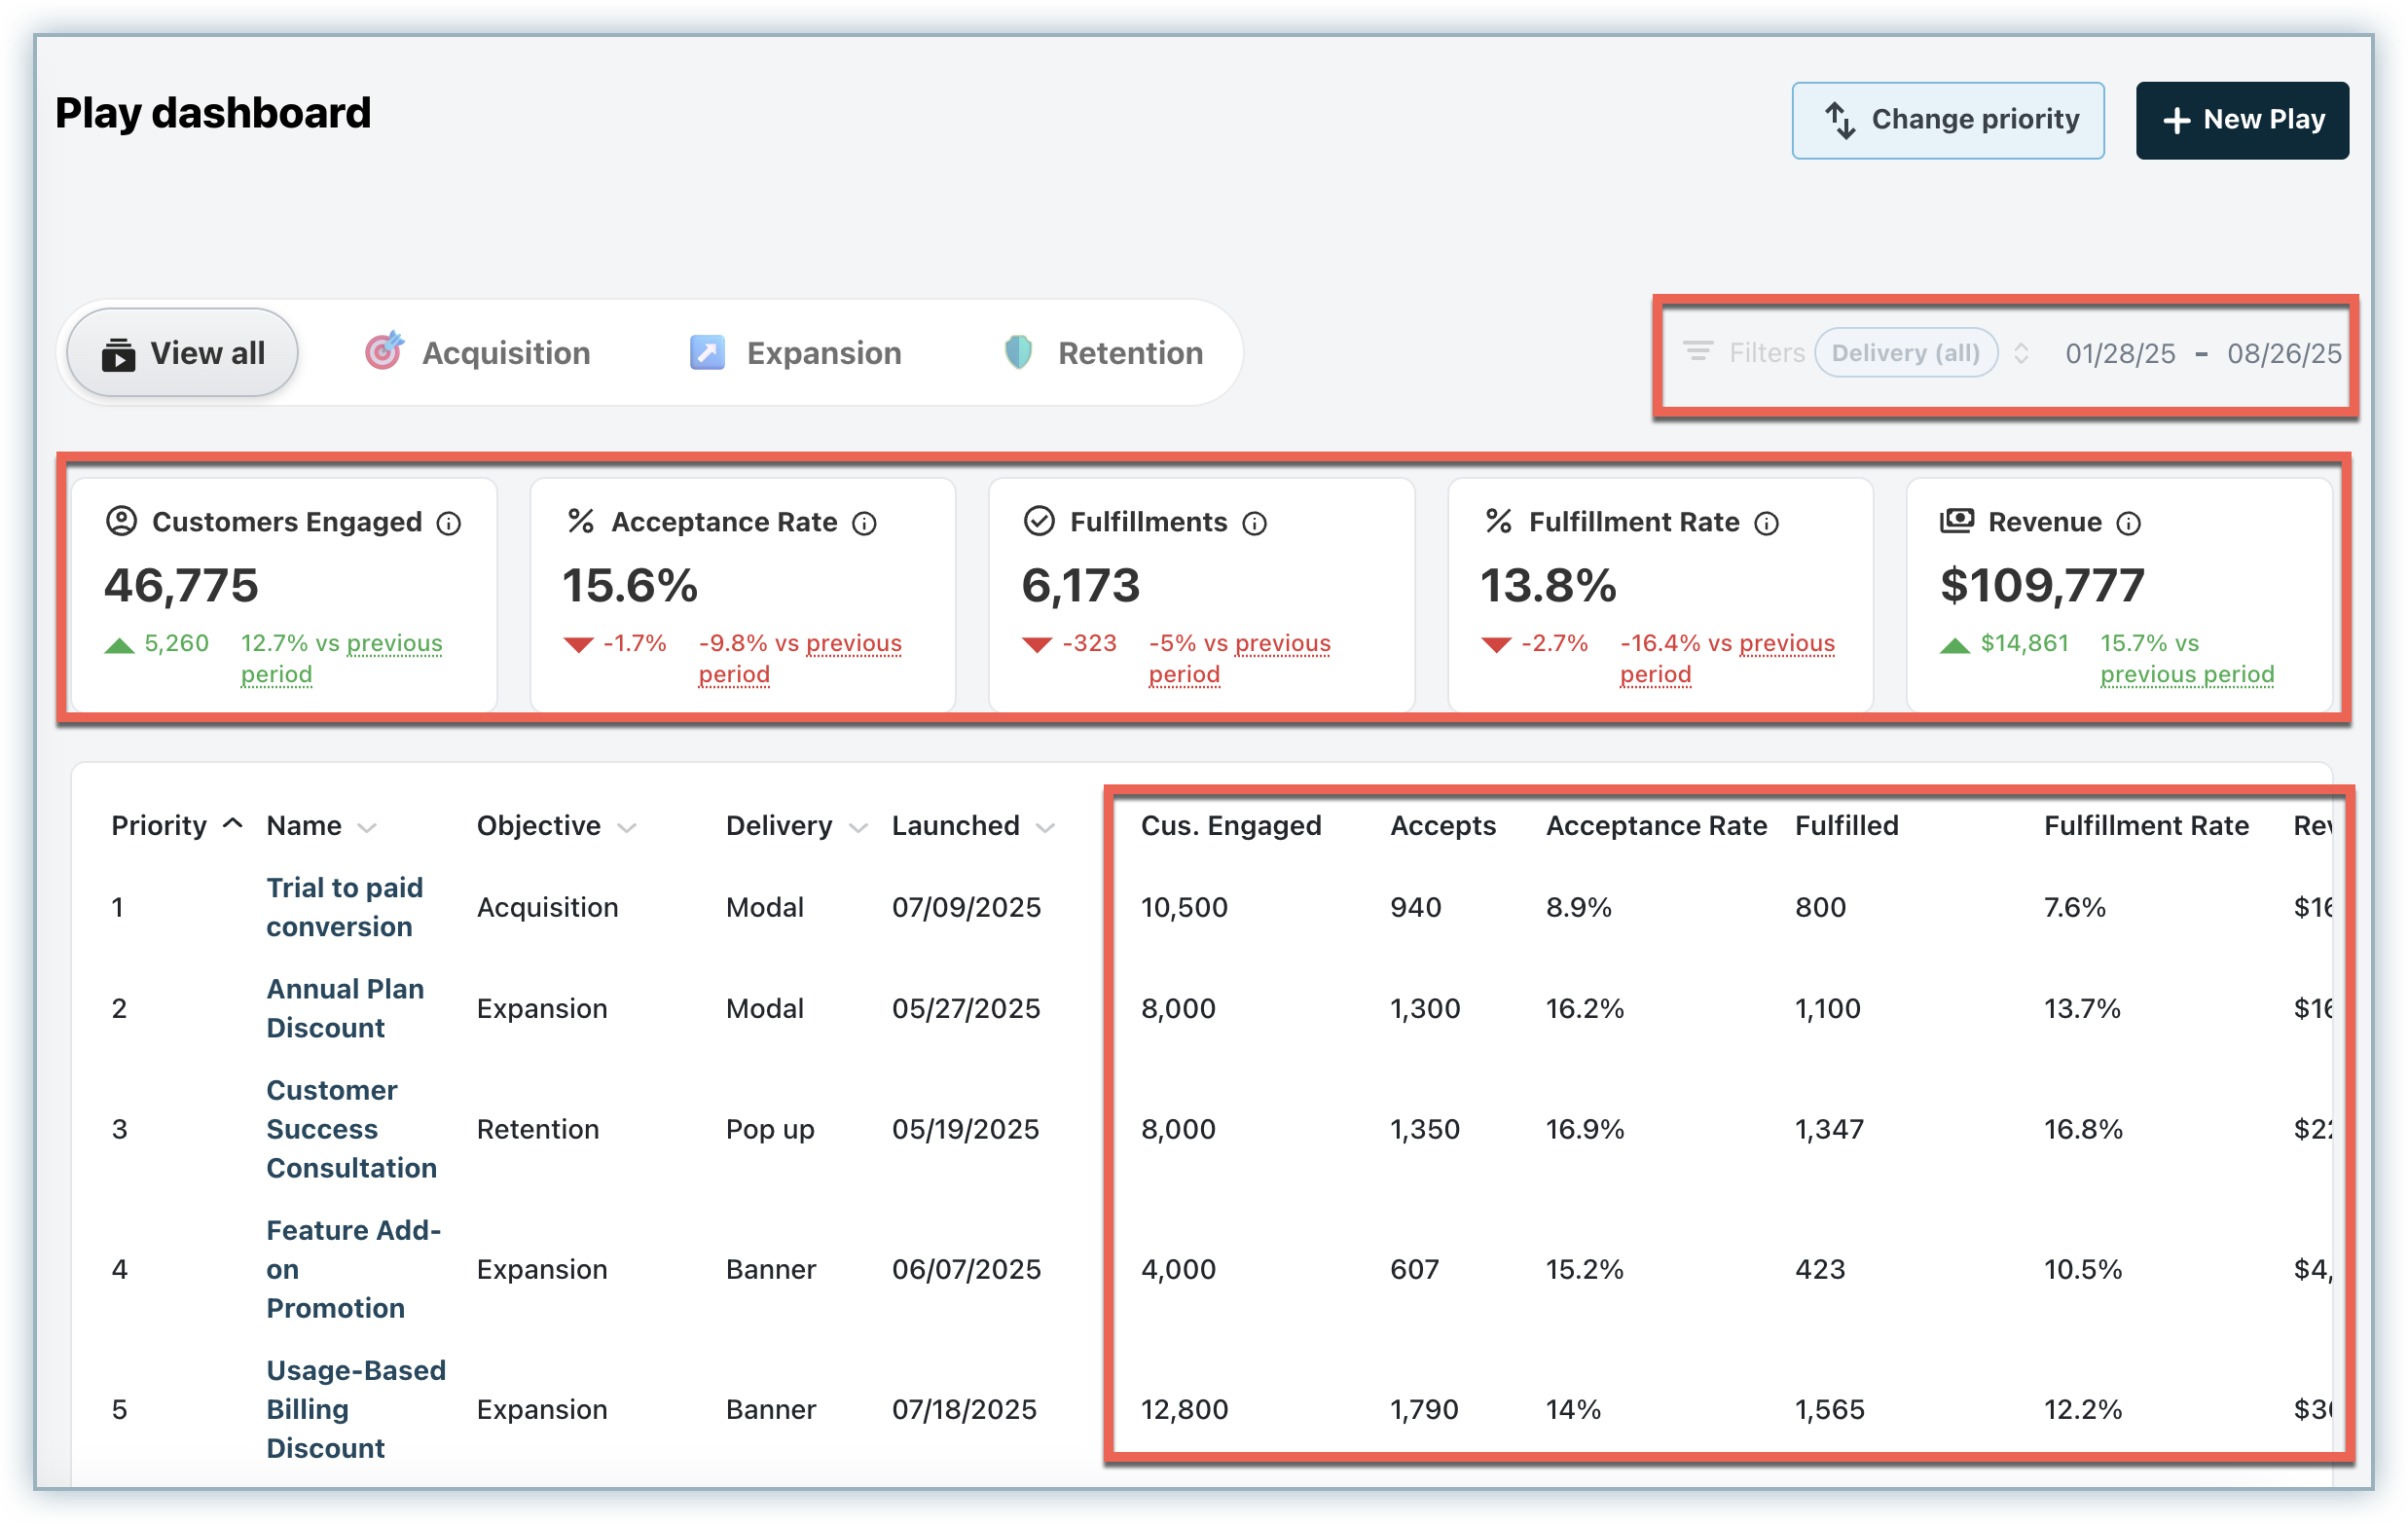
The Plays module provides an aggregate view of how all your Plays are performing.
- At the top, the KPI bar shows rolled-up performance across all Plays.
- The Plays list provides a Play-by-Play breakdown of key metrics.
- You can also apply a date filter to review aggregated metrics for a specific period.
Play-level reports
For deeper insights, you can access metrics directly within an individual Play:
- Click open a Play and select View live reports from the Play editor.
- Alternatively, you can navigate to the reporting section directly from the menu options for that Play.
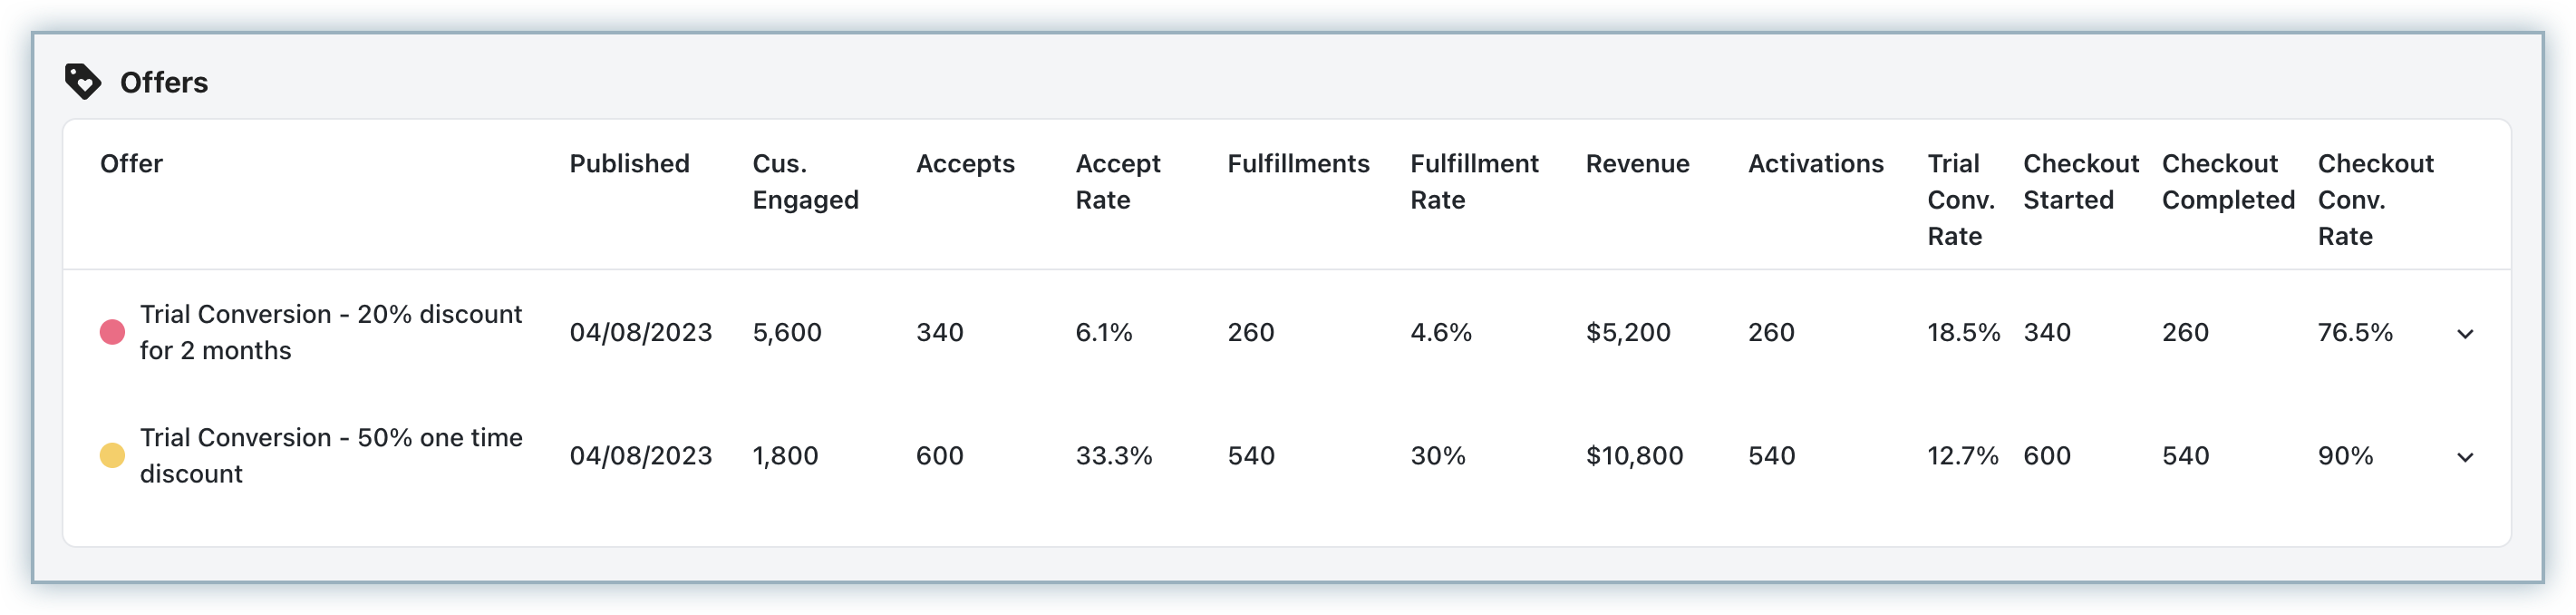
Within the reporting module:
- You’ll see an Offer-level breakdown of all Offers that have been engaged (viewed, accepted, or rejected) by at least one user from the target customer group. Offers with no engagement data are not displayed in the Offer-level breakdown view.
- Clicking on an Offer reveals the list of customers who have interacted with it (viewed, accepted, or rejected).
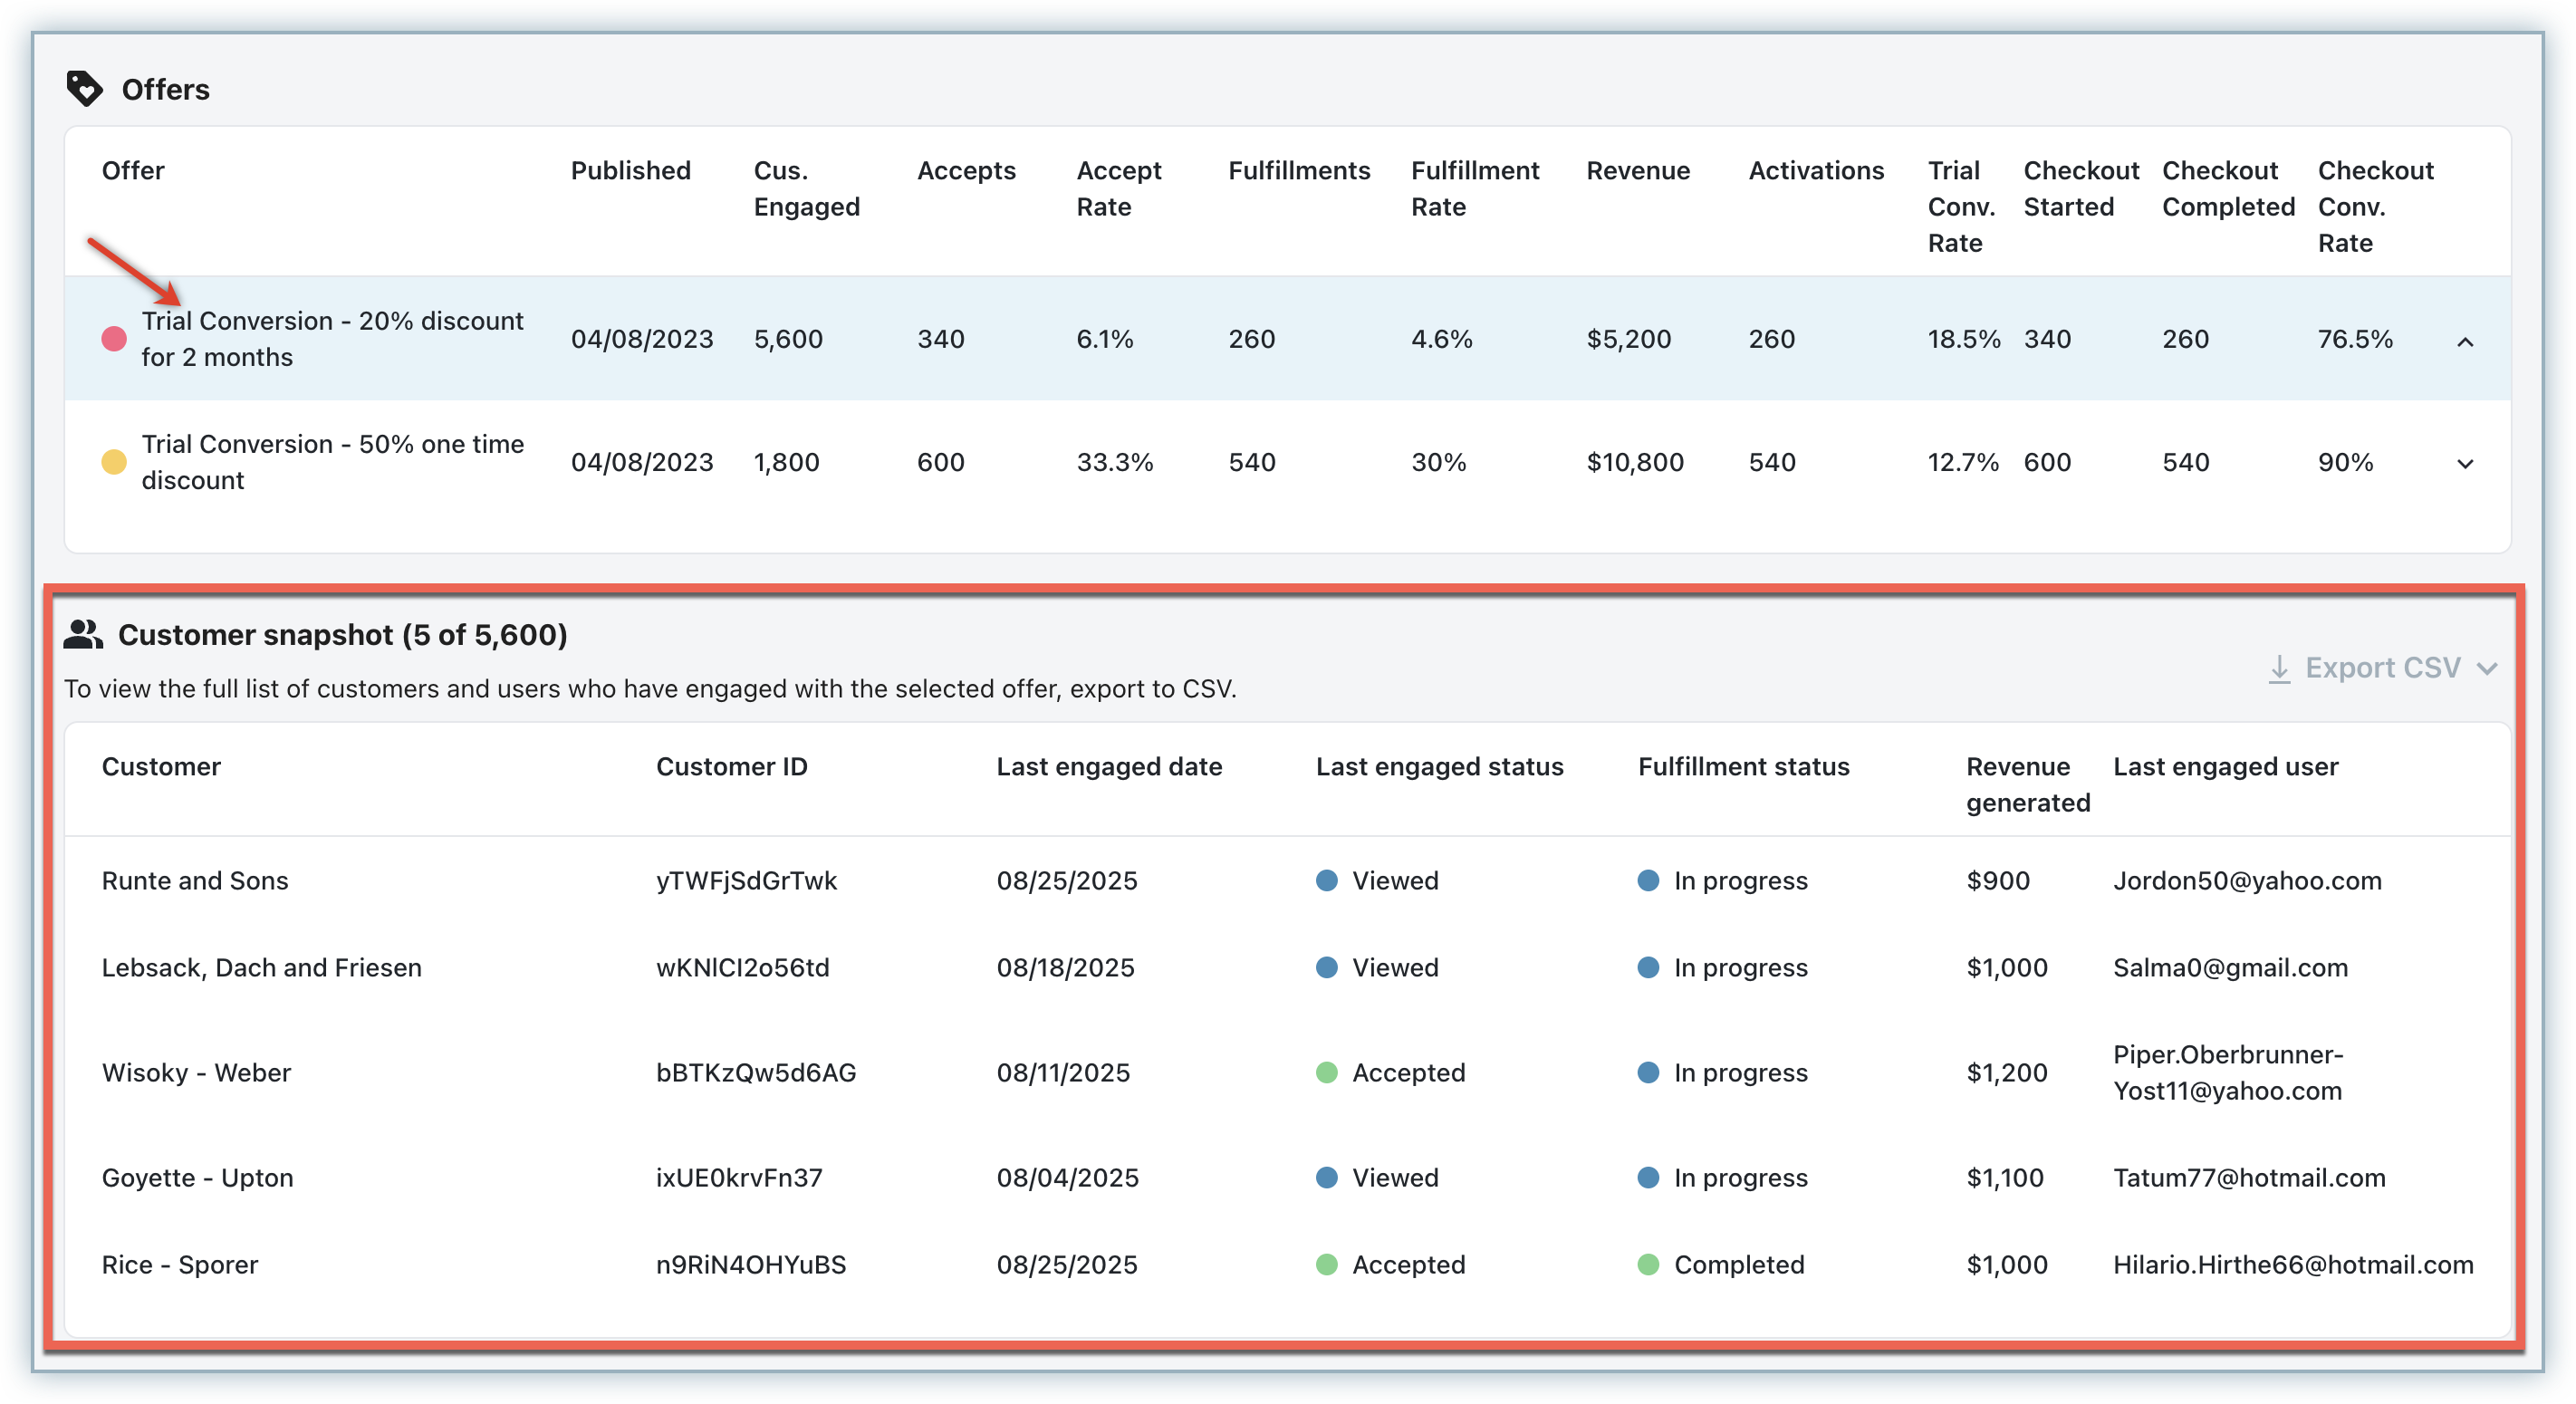
Only a limited number of customers are shown in the UI. To view the complete list, use the export CSV option in the top-right corner of the table.
By default, metrics are reported at the customer level in the UI, showing only the latest user who engaged with an Offer. However, in B2B scenarios, multiple users from the same customer may interact with the same Offer. To capture this detail:
- Use the Export option to download a user-level report, which includes all users from a customer who engaged with the Offer.
With these reporting capabilities in Growth Solution, you can measure how effectively your Offers engage subscribers, identify which Plays drive the most revenue, and refine your strategy for maximum impact.
Was this article helpful?