Receivables Analytics
Note:
Contact administrator to enable this feature for your account.
Overview
Receivables offers an Analytics feature that provides valuable insight using advanced analytics reports on your account receivables data, customers' outstanding invoices, and financial data based on various charts and tables. The visual interpretation of collection data in Analytics gives you a 360-degree view of your business's collection processes and outstanding receivables.
The Analytics module in Receivables helps CFOs, finance leaders, and AR heads gain a solid understanding of account receivables, customers, and collection processes across all your business units and locations. For more information about enabling this feature, see user roles and permissions in Receivables.
AR Dashboard Views
The AR Analytics dashboard provides a consolidated view of all your collection-related activities and associated key performance indicators (KPIs) on a single page. By default, the Analytics dashboard reports are categorized in the following views:
AR Dashboard Components
Metrics Bar
The metrics bar on the top of every dashboard view displays the following key metrics:

Total Outstanding: Total outstanding is the amount that customers owe to the company as of today. It is calculated by subtracting the total credit amounts from the total debit amount. Formula: Total Outstanding = [(Total Debit amount as of today) - (Total Credit amount as of today)].
Open Invoices: The total amount from all the invoices and debit entries such as debit notes that are recorded but not yet paid by the customers. Formula: Amount in Open Invoice/Debits = Total balance from outstanding invoices that is NOT yet paid by the customers.
Open Debits: Open debits are calculated from the invoices that have not been paid after the due date. Formula: Open Debits = Total debit balance as of date.
Unutilized Credits: Unutilized amount against the customer's invoices as of today. For example, credit notes issued on customers' accounts that have not been utilized. Formula: Unutilized Credit = Total unadjusted credit amount as of today.
Issue amount: The total issue amount from all open issues of customers' invoices, payments, debit notes, and so on.
Average Credit Period: Average credit period is the total number of days taken to receive the account receivables from all the customers. The average credit period is useful to understand how efficiently money is collected from customers when they need to cover expenses and avoid debts.
Average Due Days: The total number of days for which the invoices are due as of date. The average due days is evaluated based on the due date of invoices.
Overdue Composition: The percentage of the total outstanding which is currently owed to the company by its customers at any level depending on the data point clicked on the chart. Formula: Overdue Composition= (Net overdue amount/Total Outstanding)*100.
Net Overdue Percentage: The Net overdue percentage is the percentage of the total outstanding amount at any level depending on the data point selected in the chart.
Total Collected: The total amount of payment made by customers over a period.
Total Billing: The total amount of all invoices billed to customers over a period.
Promise To Pay Amount: Total promise to pay amount raised against the open invoices. The amount is calculated from all the open invoices that contain the customer's acknowledgement of partial and full payment.
Actions on Charts and Tables data
In addition to viewing the charts and tables as they are, you can customize the view by performing actions on the data points across the various dashboard.
The fundamental actions of dashboard views are as follows:
- Applying Filters on Reports
- Showing Reports as a Table
- Sorting axis in Charts and Tables
- Sorting Columns in Table
- Exporting Chart and Table data
- Selecting data values in Charts and Table
- Drill down into visual data
Applying Filters on Reports
Using the filter options, you can ensure that the most relevant information is displayed on the charts and tables so that you save more time and analyze the business collection data more precisely. You can apply the filters on every report displayed in the dashboard view.
To apply filters on reports, follow the steps below:
- Select a chart or table within a particular dashboard view.
- Click Filters on the right-most of the analytics window.
- Select filter categories and subcategories to apply filters based on specific conditions. For example, selecting the subcategory as "is less than" in the filter category "balance" for the outstanding aging bucket.
- Click the funnel icon at the top of the chart or table to visualize the applied filter and slices.
When you apply the filter, it only displays the data point that matches the filter set in the filter categories. For example, applying the filters on the Outstanding by Aging chart displays the outstanding amount with the filter category selected for balance less than USD 10,000. After clicking the Apply filter the dashboard displays the data points on the respective charts and tables.

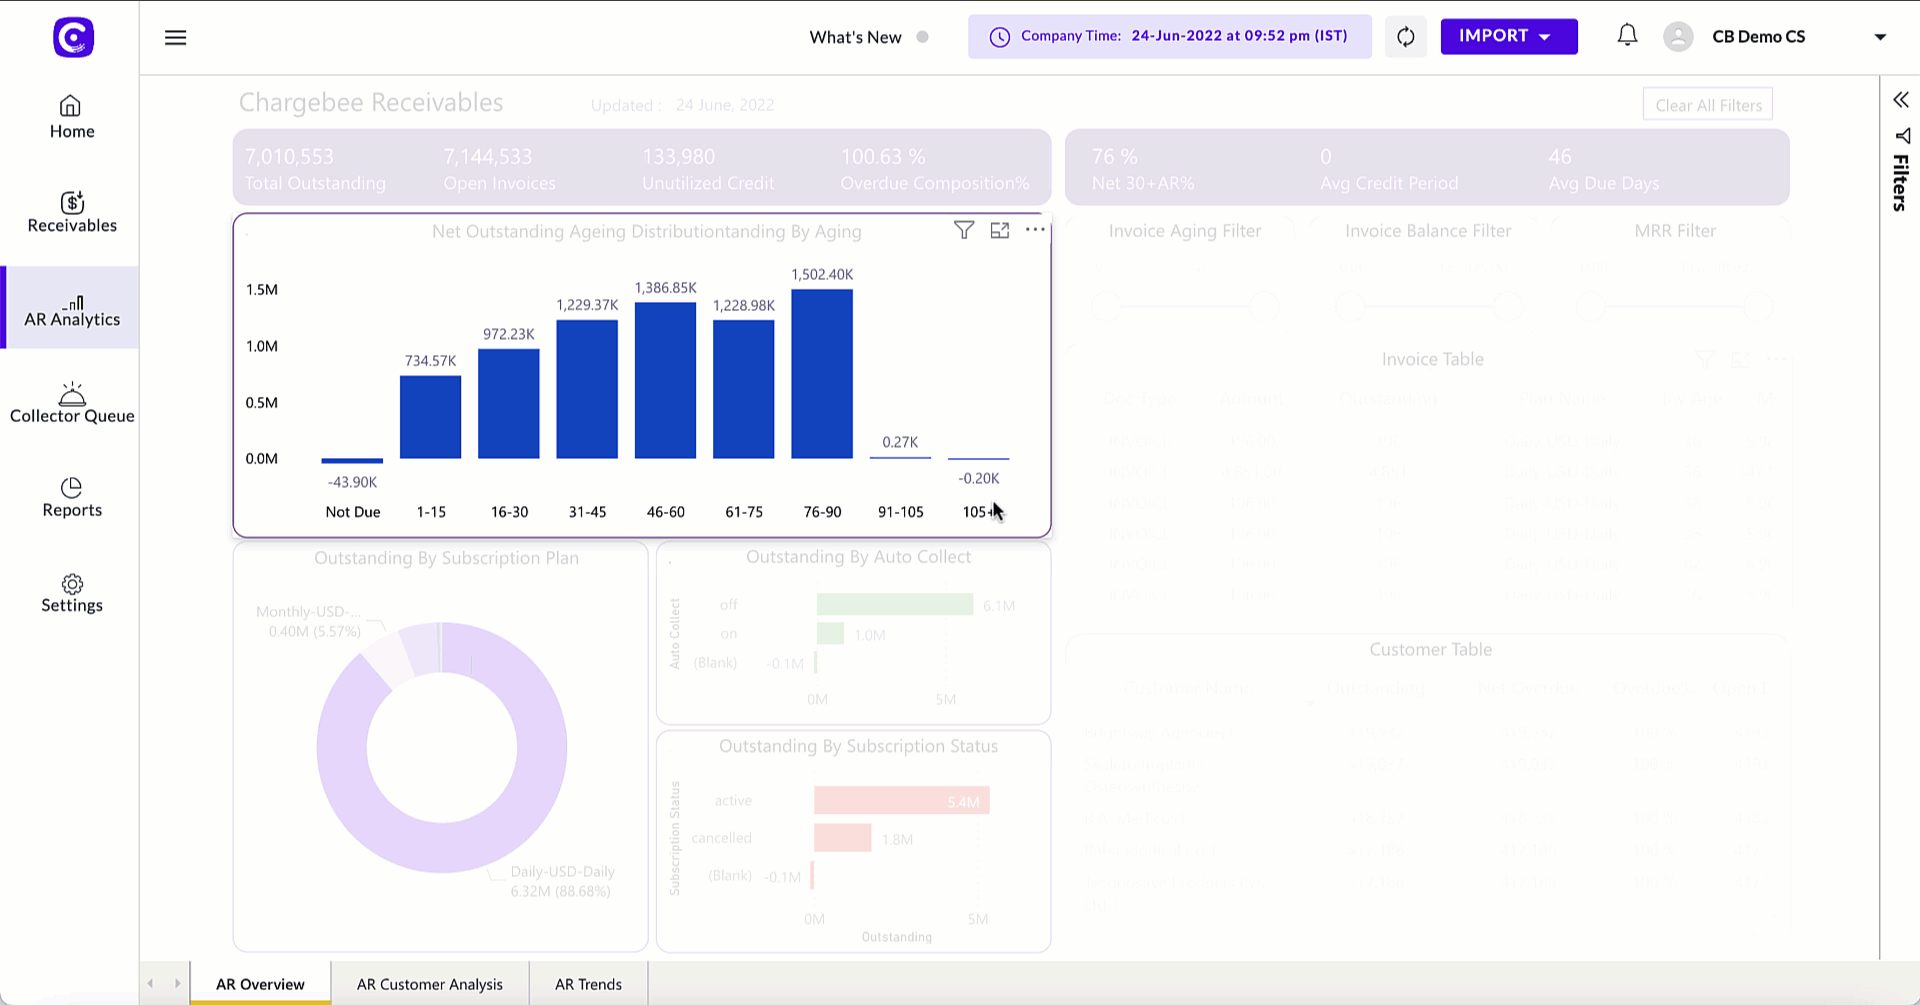
Showing Reports as a Table
The chart data in the dashboard views can also be displayed as a table. It is more convenient to combine the chart data and table data together on a single page. The tabular view of the chart data enables you to view and organize the chart data into various rows and columns.
To show the reports as a table, follow the steps below:
- Select a chart or table from the dashboard.
- Click the ellipsis icon at the top right of the chart or table.
- Select the Show as a table option.
Showing the chart as a table displays the tabular form of the data along with the chart or table embedded in a single page. You can further drill down to the chart or table data by clicking on the data value.
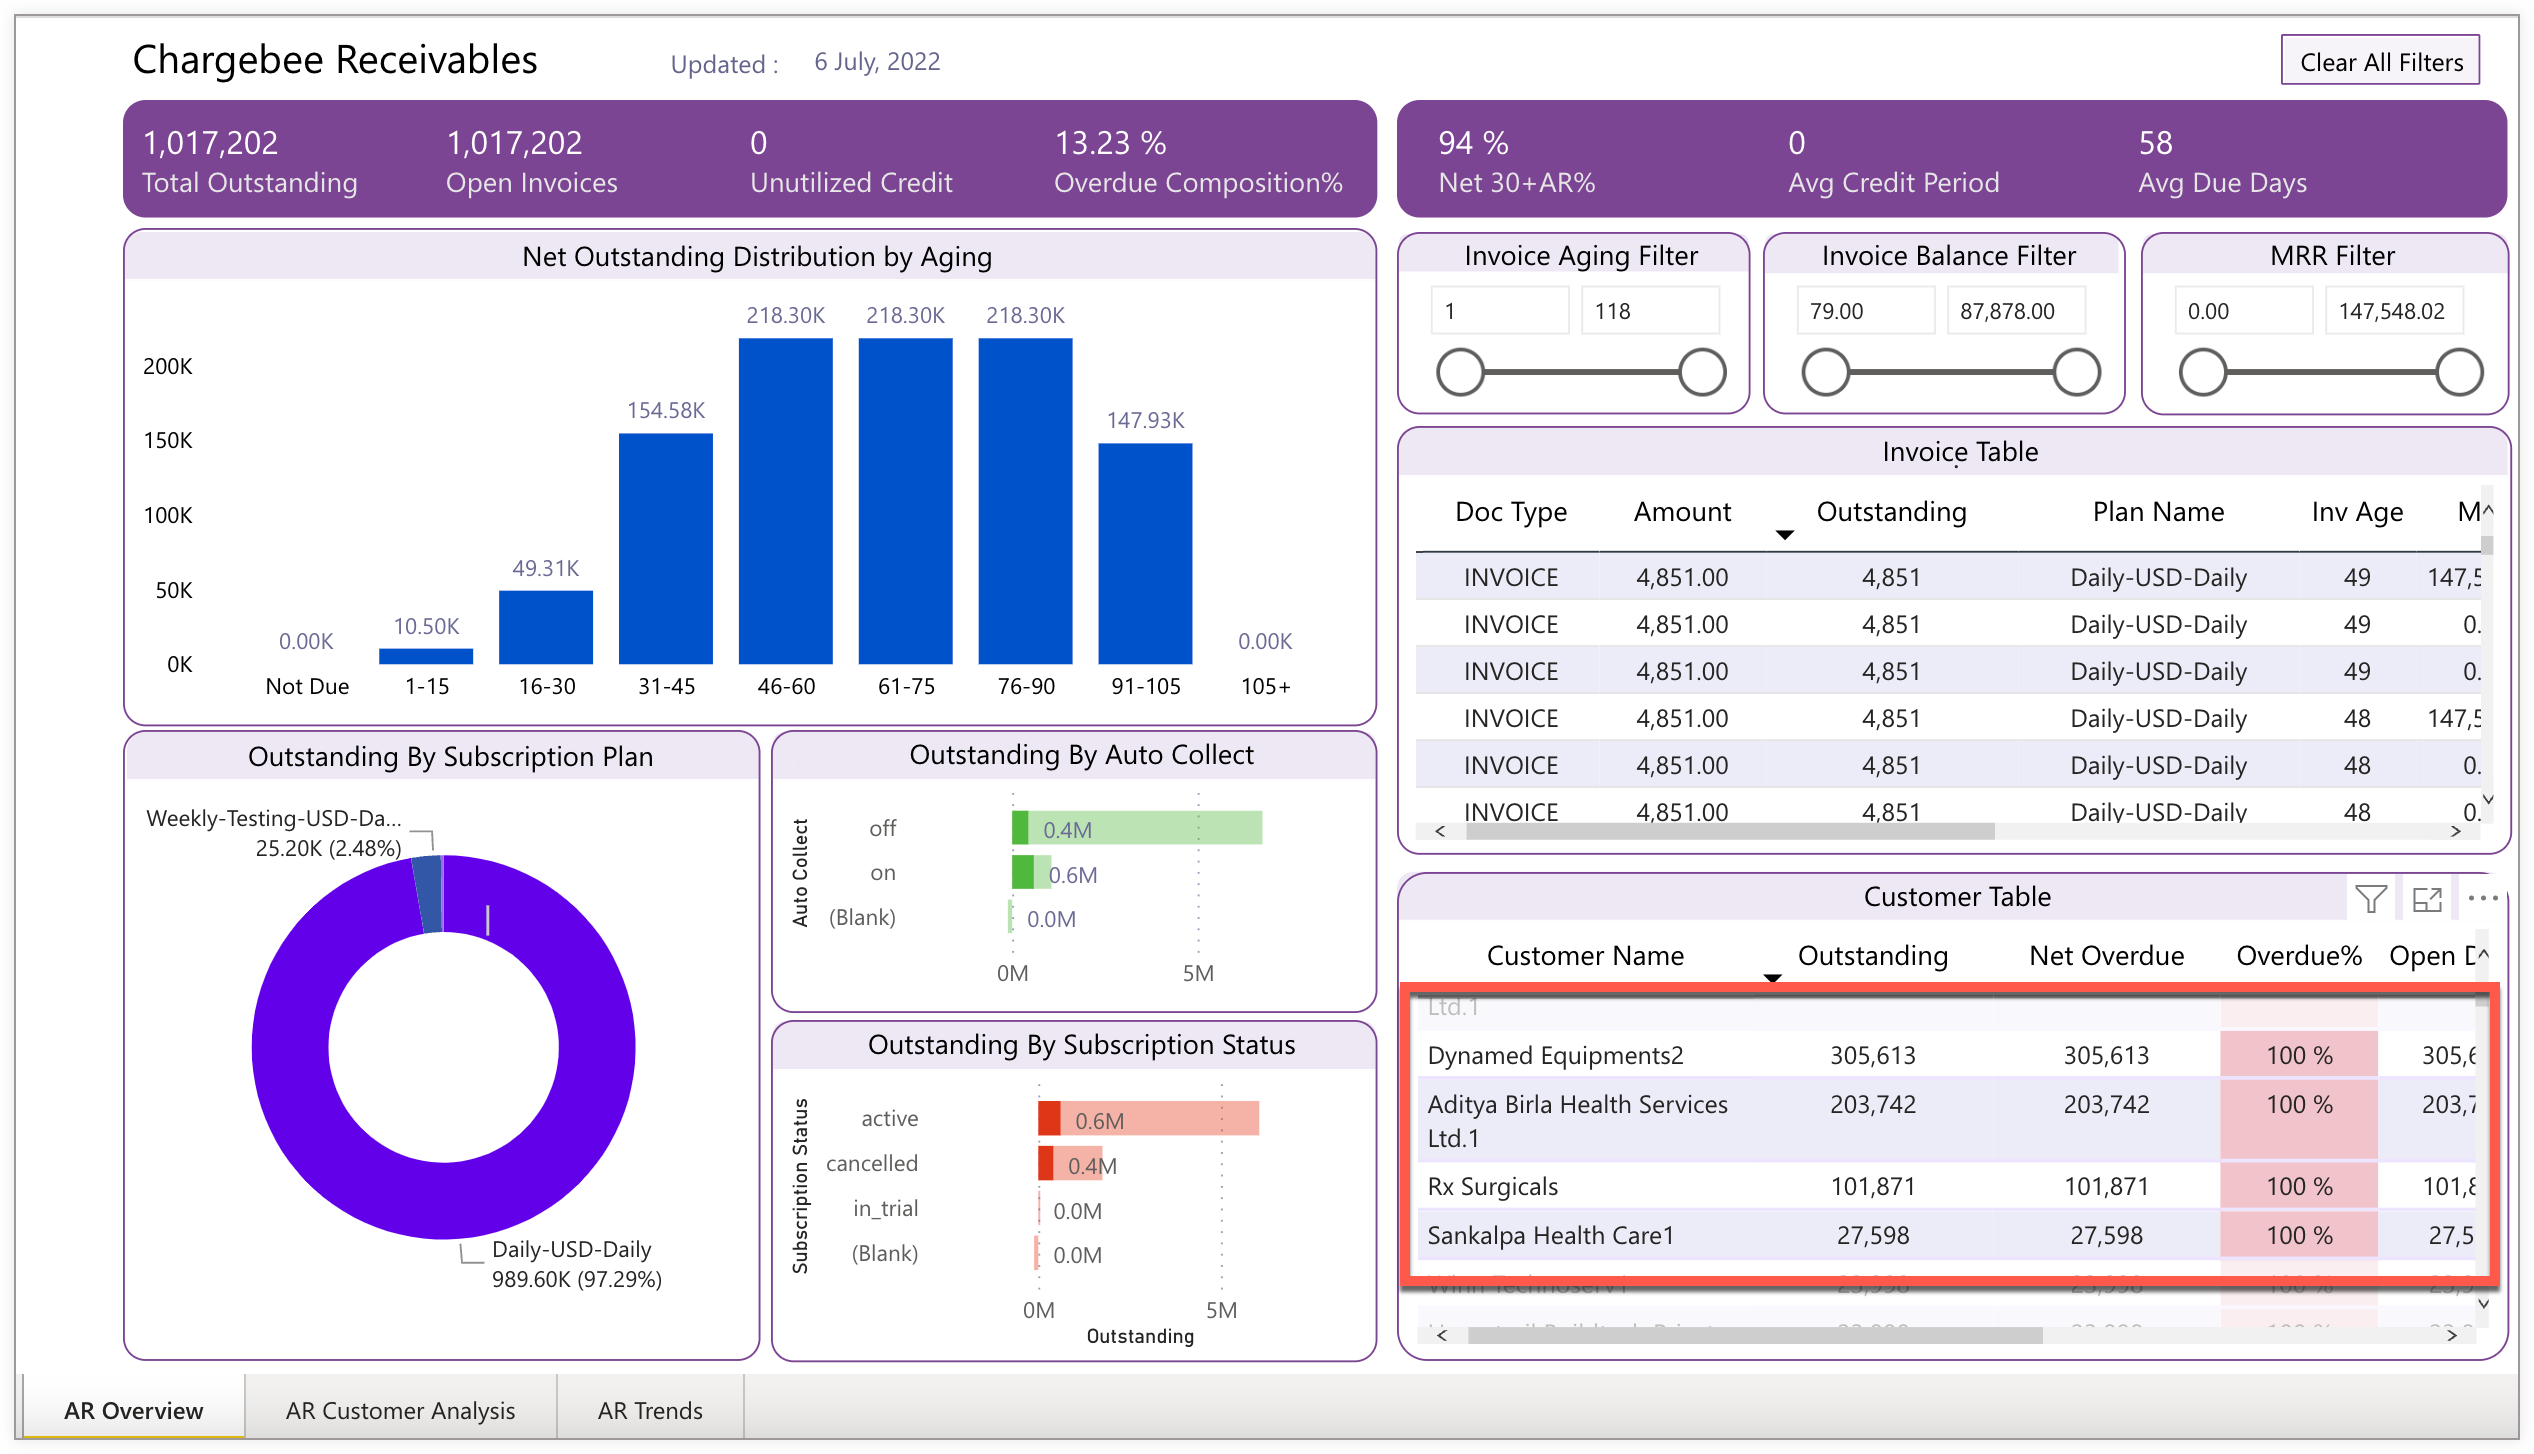
The following illustration displays the table view of the Net Outstanding Distribution by Aging chart.
Sorting data in Charts and Tables
You can sort the axis and columns of a chart and table in ascending or descending order. Once the data is sorted, you can further export the data in XLS or CSV format
To sort axis labels and columns of a chart and table, follow the steps below:
-
Select a chart or table in the particular dashboard view.
-
Click the ellipsis icon at the top-right corner of the chart and click Sort axis option. If the table is selected, click Sort by option.
-
In the submenu, select the axis-label or column-name that you want to sort.
-
Once the data is sorted, click ellipsis icon again and select Sort ascending or Sort descending option to sort the already sorted data.
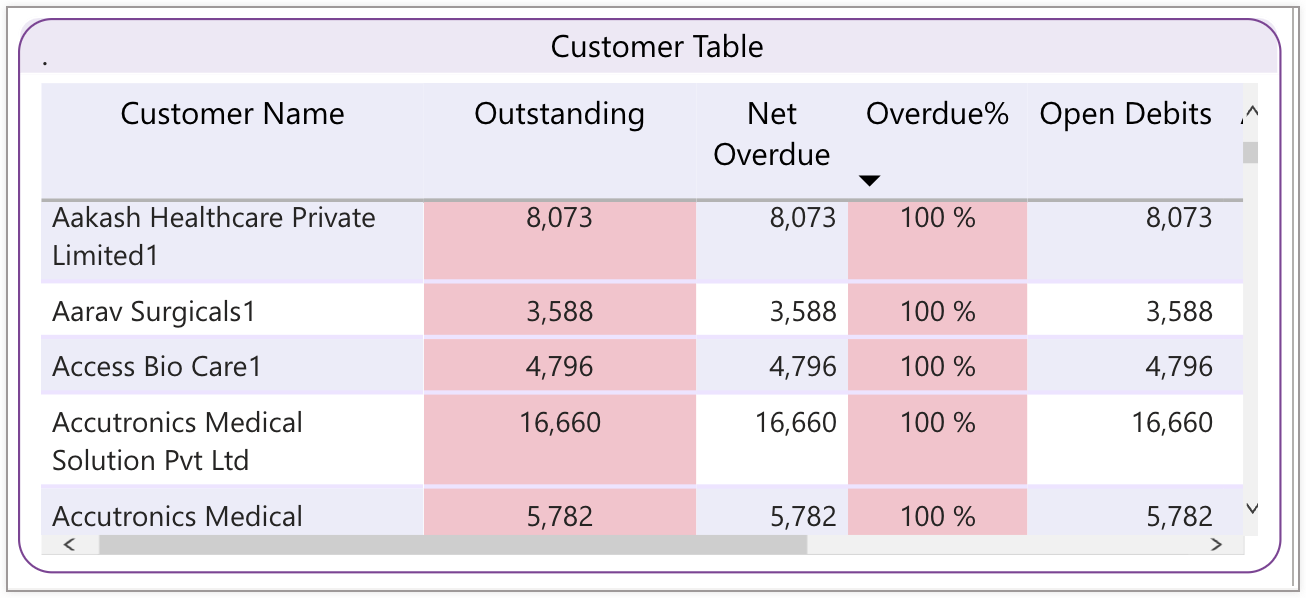
The following illustration displays the customer table containing information about the customer and financial data such as outstanding, overdue, and more in the AR Customer Analysis dashboard. The customer table data is sorted in a particular order by Customer Name.
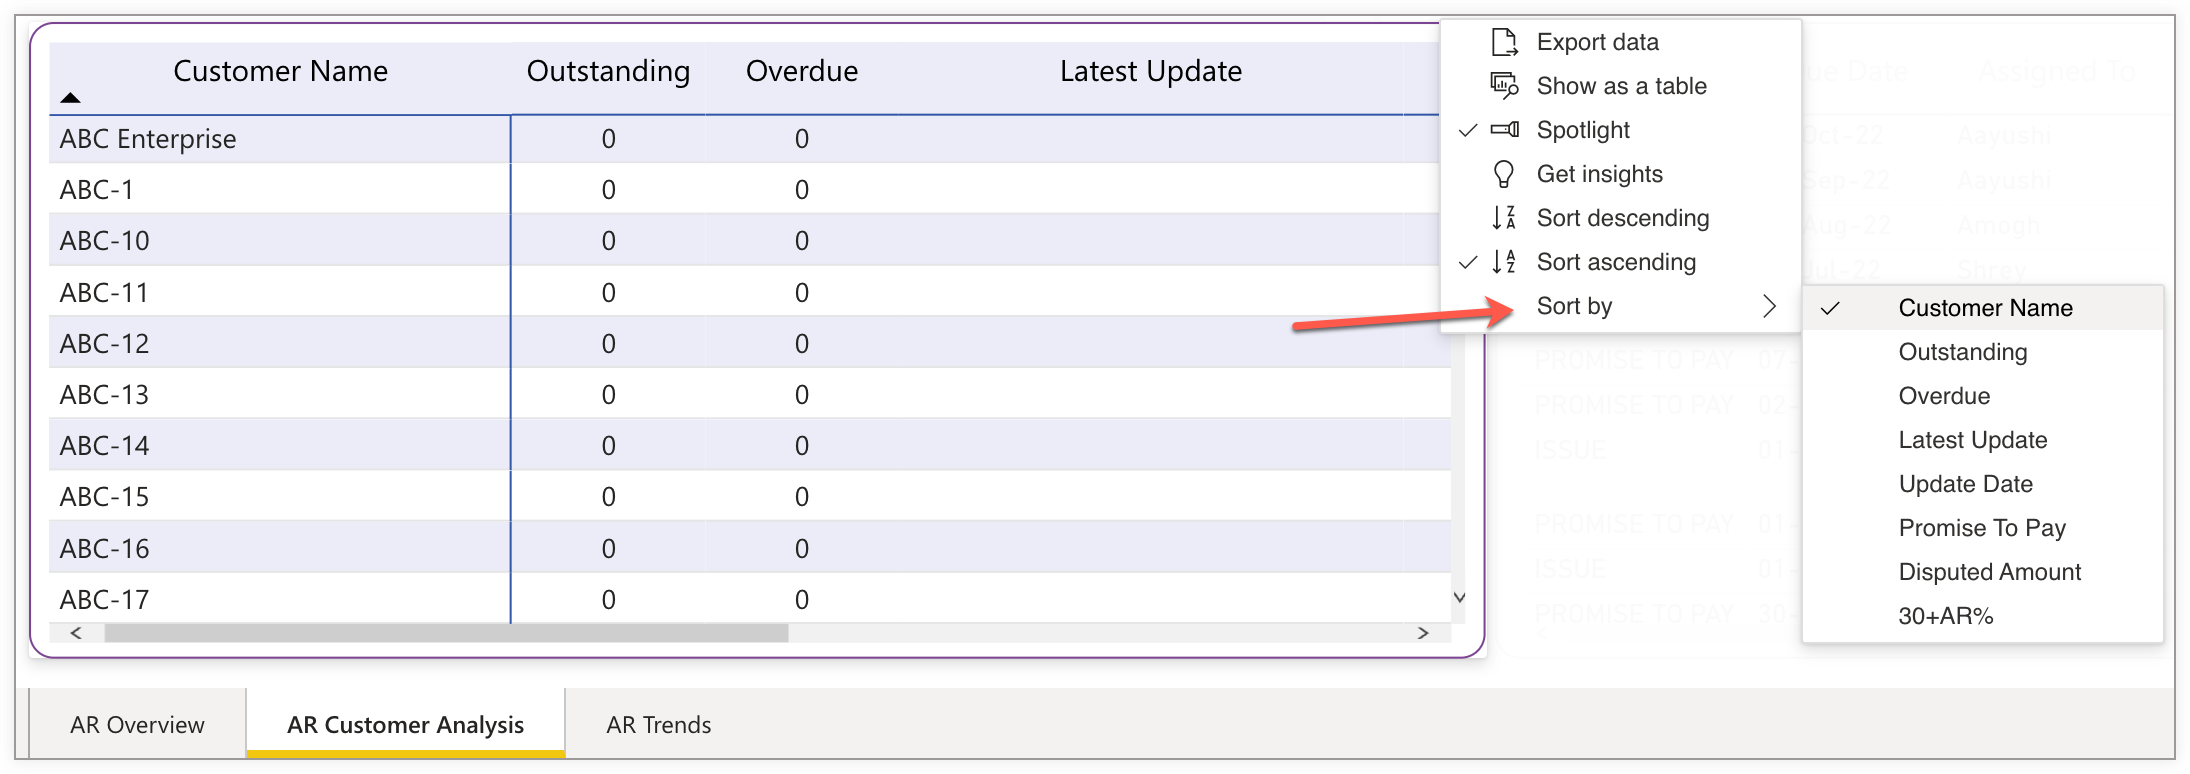
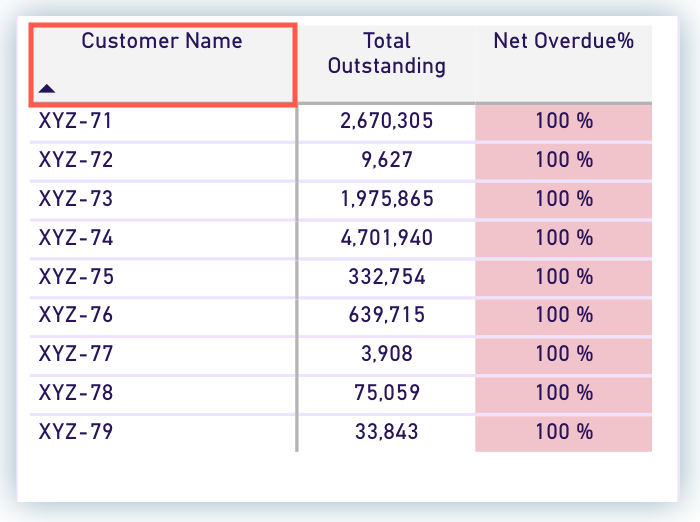
Sorting Columns in Table
You can sort the column data in a table by clicking on the name of the column. You can sort the column in any particular order(ascending or descending) with respect to the following two conditions:
Arrow Up: The up arrow indicates the column data in a table is sorted in ascending order. Arrow Down: The down arrow indicates the column data is sorted in descending order.
To sort the column of a table, you can follow any of the following steps:
- Click the column header of your choice. To change the sorting order, click the column header again.
- Click the ellipsis icon at the top-right corner of the table, and select a column-name by clicking Sort by option. To sort the column again, in the menu select the Sort ascending or Sort descending option.
Exporting Charts and Table data
The export operation allows you to convert the raw and summarized data into Excel or CSV format. Exporting the data into a preferred format populates the chart and table into various rows and columns.
To export the chart and table data, follow these steps:
-
Select a chart or a table in a particular dashboard view.
-
Click the ellipsis icon at the top-right of the selected report.
-
Click Export data.
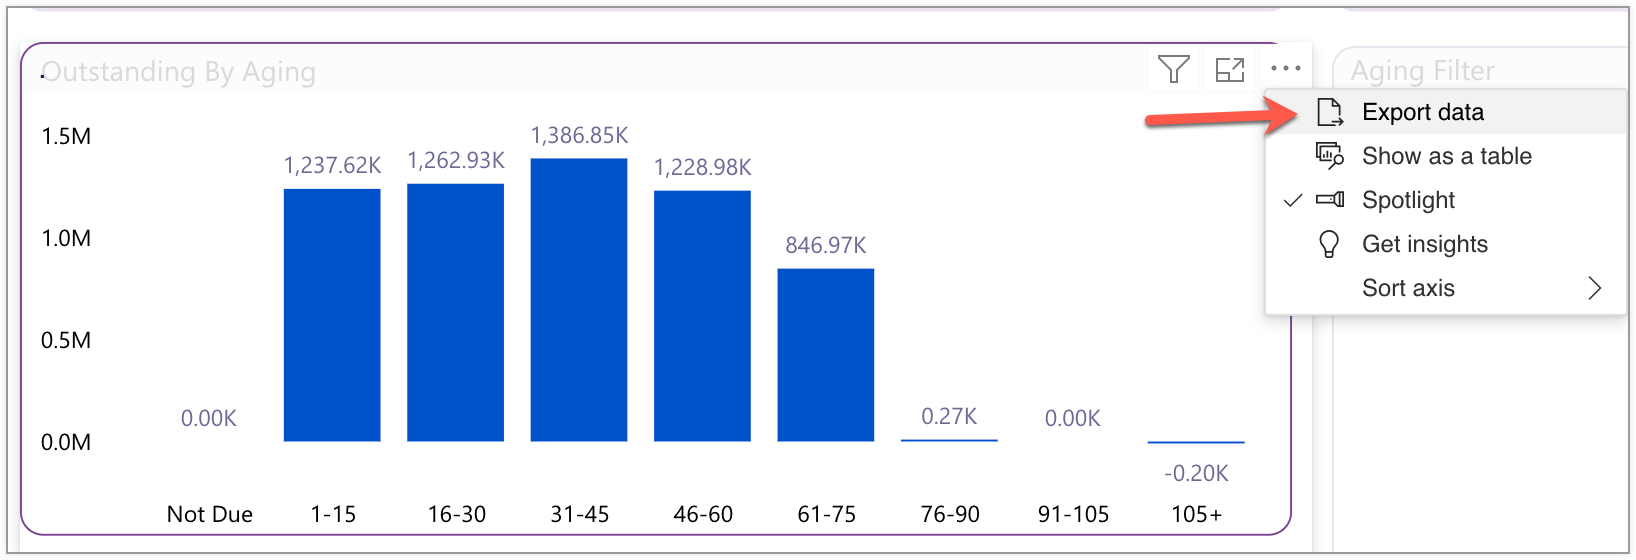
-
In the Export data window, select an appropriate export option.
-
Select the desired file format to export the data based on the data volume and number of rows. You can select either .xlsx (150,000 row max) or .csv (30,000 row max) format. You cannot select more rows because of the export limitations.
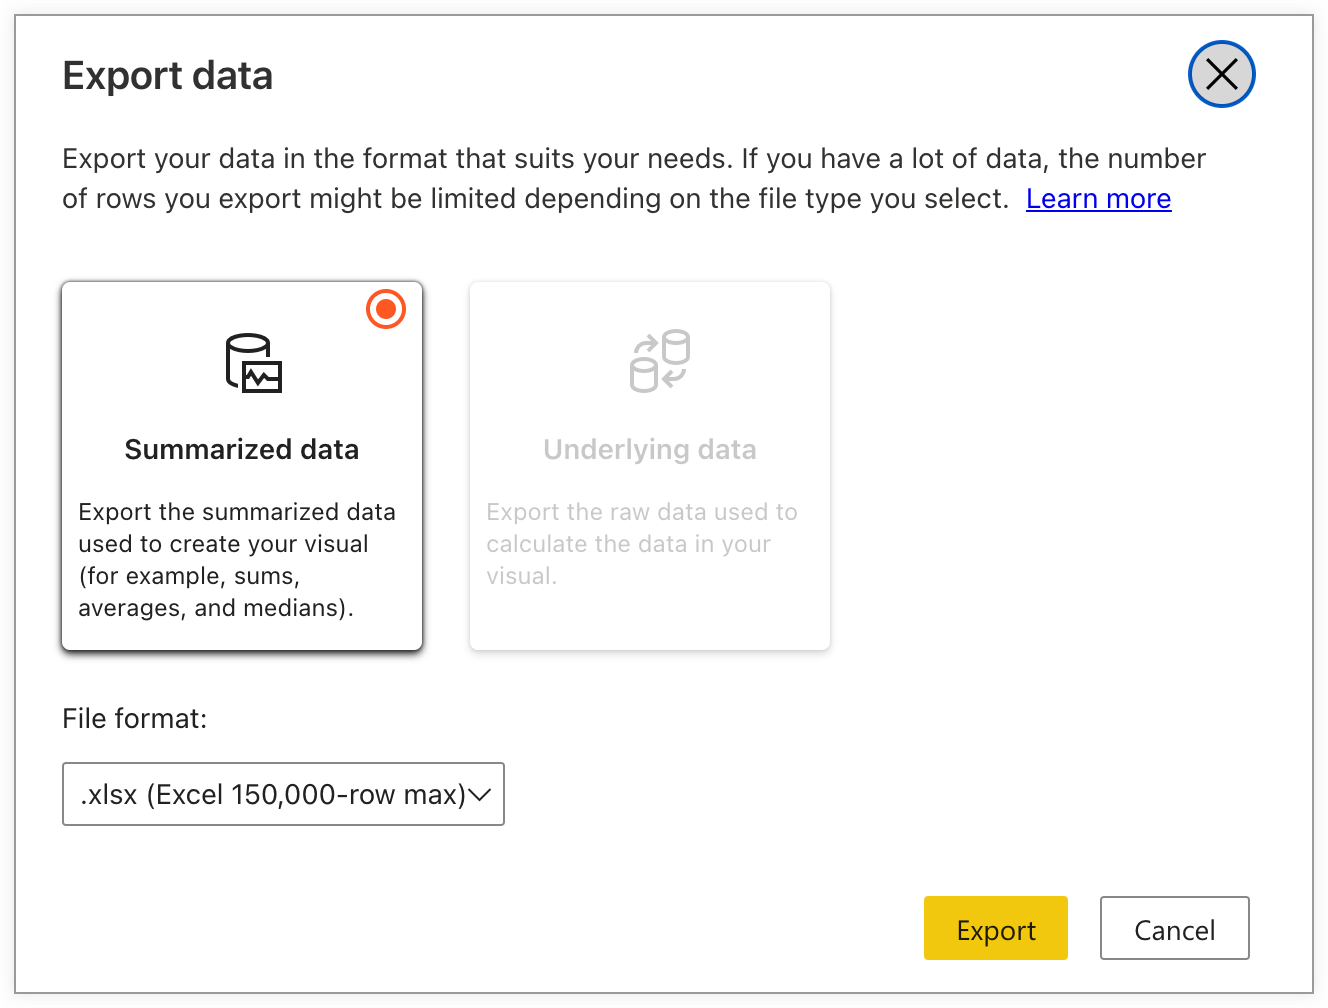
-
Click Export to download the file.
Selecting data values in Charts and Tables
When you have a large volume of data, the complexity to visualize the underlying data in the chart or table increases. You can simplify the complexity of visual data by omitting certain data values or columns from the charts or tables. You can include to display or exclude to hide specific data values from the chart or table. When you include or exclude the data values in a chart or table, the dashboard displays the related data in the respective charts or tables. You can drill down to the information by selecting a data value from other charts and tables to find additional information about the data value.
To include or exclude the data values, follow the steps below:
- Select a chart or a table from a particular dashboard view.
- Select the data value from the table or chart that you want to include or exclude and right-click on the report to open the menu.
- Click Include to show the selected value in the chart or table.
- Click Exclude to hide the selected value from the chart or table.
In the following illustration including the outstanding amount with aging bucket, 61-75 days displays the related information in respective charts and tables.
In addition, you can select and analyze the data for more than one data value in a table. This highlights the information on charts and tables for multiple selected values. To select multiple data values, use Ctrl + Click and select multiple values from the table.
In the following image, the information pertaining to the selected customer is displayed in the AR Overview dashboard.
Drill down into visual data
By default, a data value in a chart or table consists of one or more level of data which is displayed through other charts and tables in the dashboard. You can drill down to that particular data value and find additional information in the respective charts and tables. This allows you to gather the associated information about a specific data value with respect to a chart or table. To drill down to a specific data value, simply select a desired data value from the chart or table.
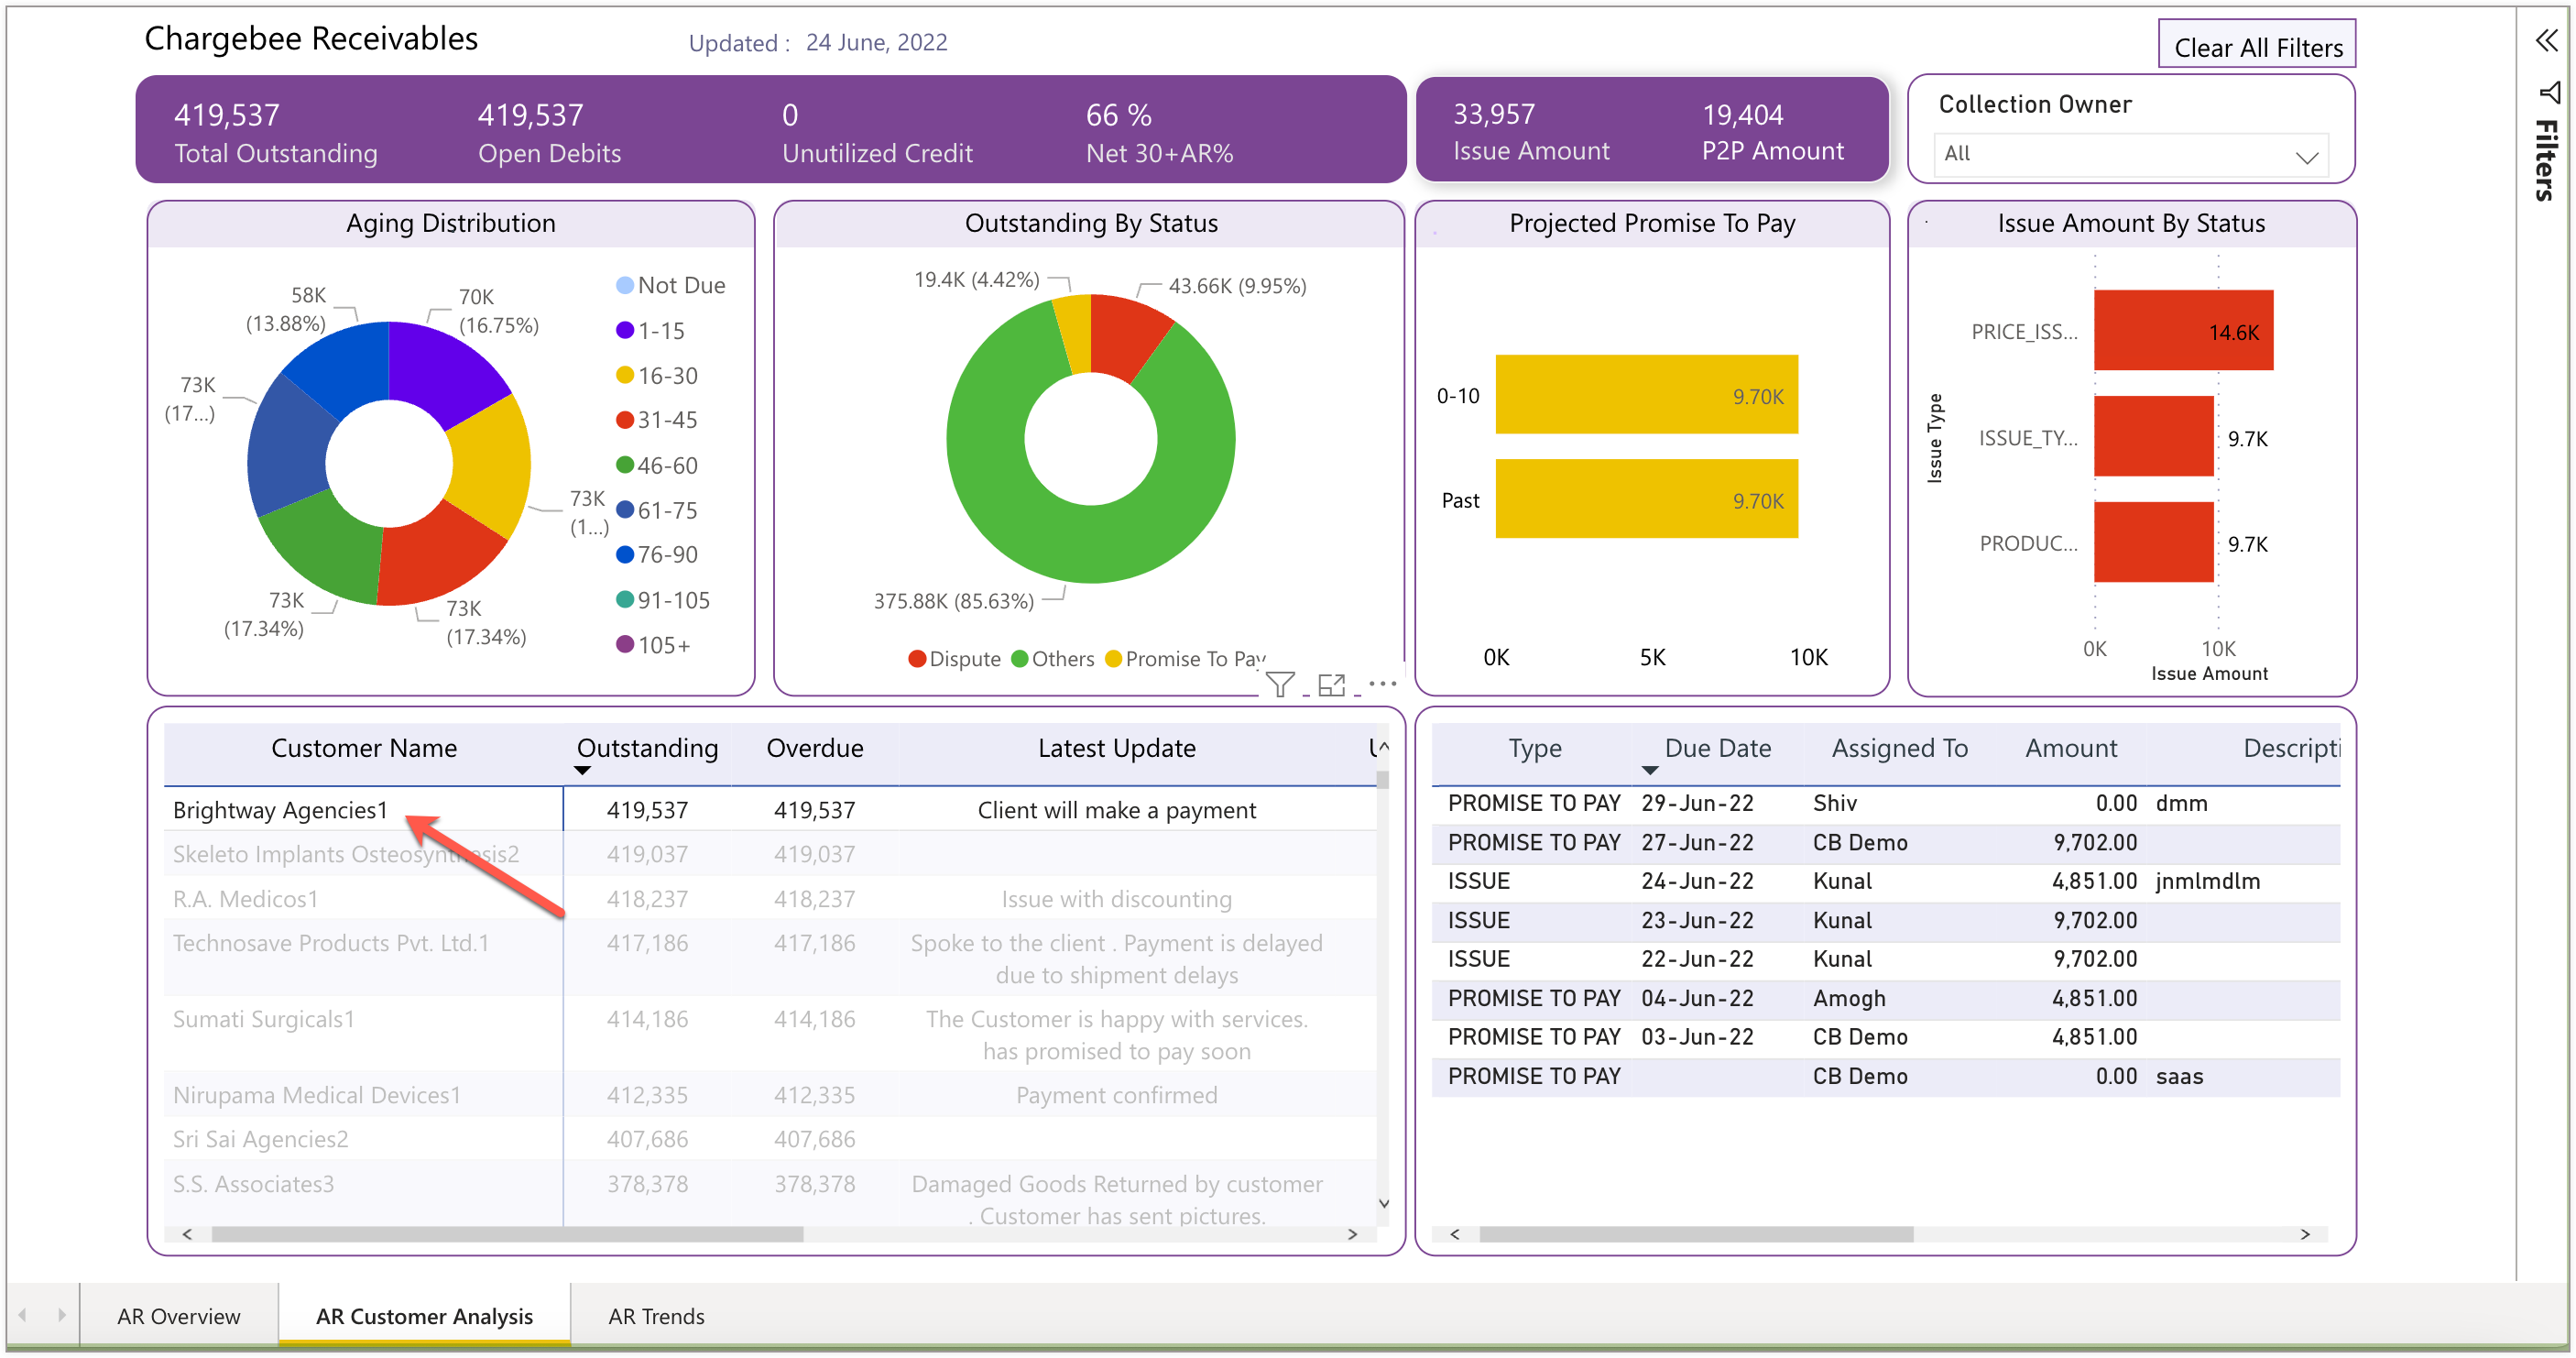
In the following image, clicking on the customer's name in Customer Analysis dashboard displays all the information pertaining to a customer.
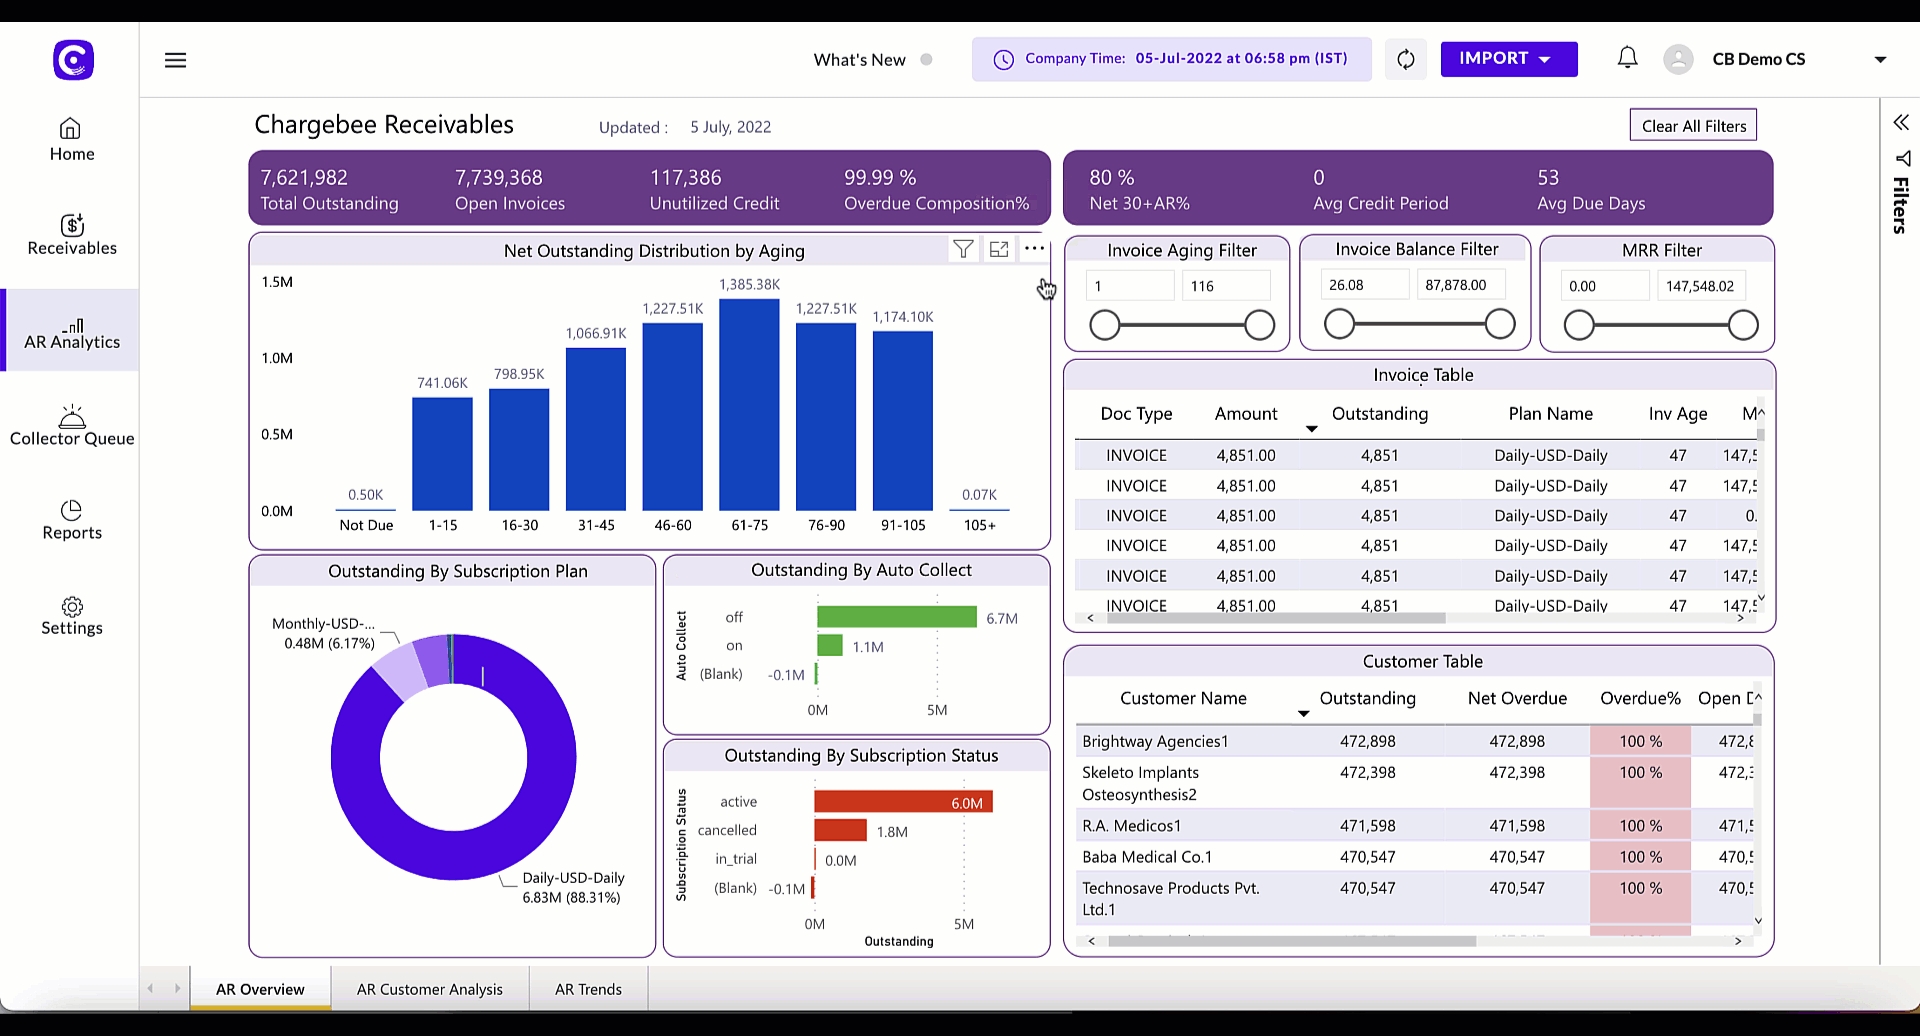
AR Overview
AR Overview dashboard displays the most important information about the account receivables performance and key indicators to measure the cash flow of the business over the period. The charts and tables displayed in the AR Overview dashboard are useful for CFOs and finance leaders to make necessary decisions on planning and executing the business collection activities. The dashboard contains information that help finance leaders to get a clear insight on outstanding balances at customer and invoice level. You can get more insights on each of the charts and tables shown in the dashboard by clicking on the data values and tiles corresponding to them.
Here are some of the analytics reports that you can use to visualize your customer and invoice data across all visibility levels:
- Total Outstanding by Aging
- Total Outstanding by Subscription Plan
- Total Outstanding by Auto Collec
- Total Outstanding by Subscription Status
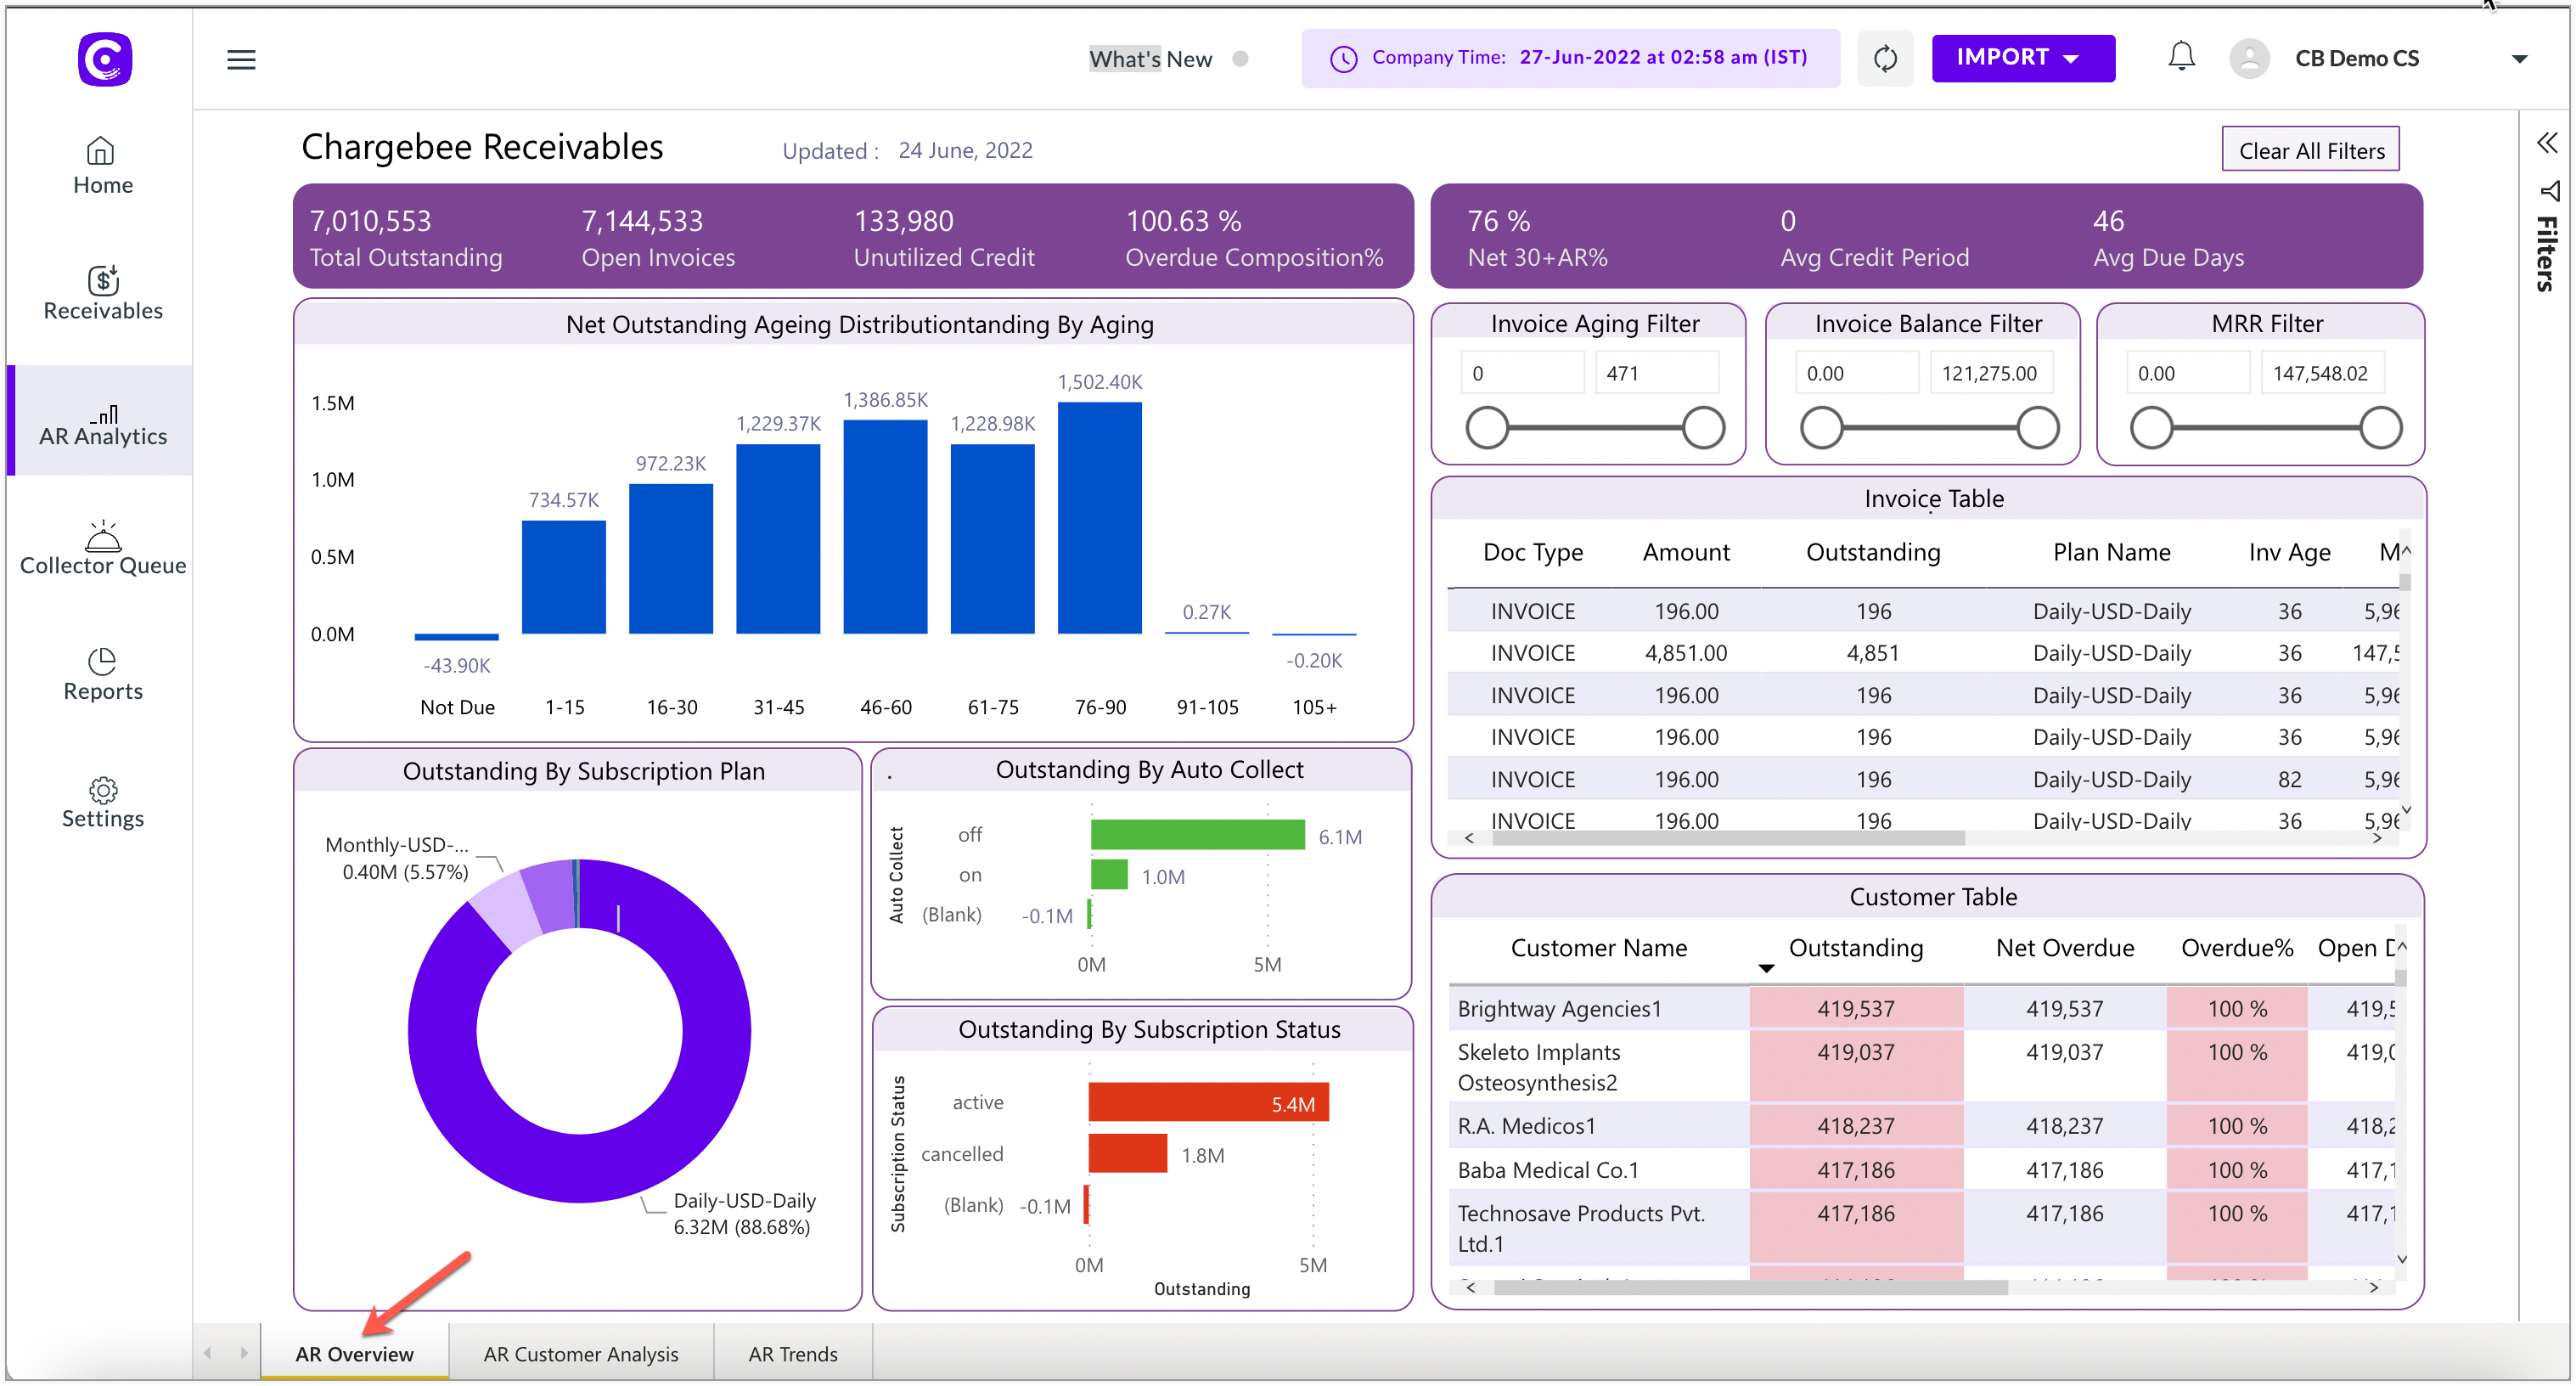
To access the AR Overview dashboard, login to Receivables and click AR Analytics > AR Overview. You can view the AR Analytics dashboard, if you have permission to access the Analytics module in Receivables.
Total Outstanding by Aging
Businesses handling complex collection processes may need to identify the critical timeline and average due period of their account receivables for which the invoices are outstanding. The total outstanding refers to the overall amount that has not yet been paid by the customers and is still owed to the business. If you have open invoices that are outstanding for a certain period of time, then you can analyse the total outstanding by visualizing the consolidated information from the aging buckets.
The total outstanding by aging chart helps you measure the collection performance and billing period of your customer. A particular aging bucket is represented by a vertical tile that contains the information about the total outstanding amount from all your customers as of today. The total outstanding amount displayed in the chart can have a minimum aging bucket of 1-15 days and a maximum of 105+ days.
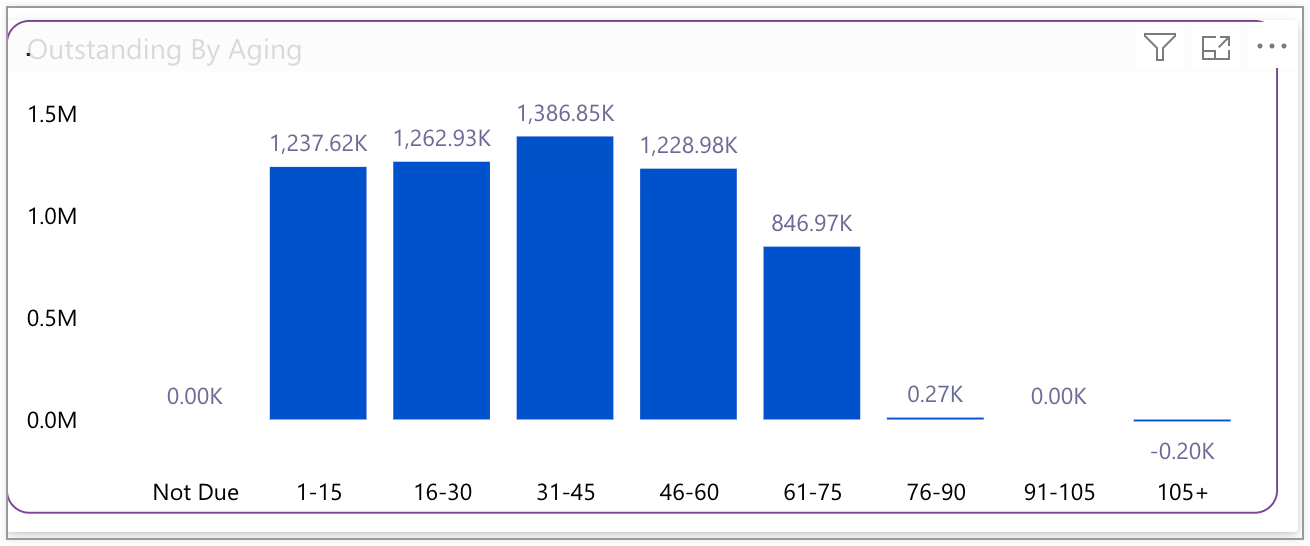
To see more detailed information about a particular outstanding data value, select a specific tile that displays the associated information in respective charts and tables.
In addition to visualizing the chart, you can customize the view of the chart by performing actions on charts and tables.
Example
The total outstanding amount for aging bucket 61-75 days describes the following information:
| Aging bucket | Total outstanding | Average due days |
|---|---|---|
| 61-75 | USD 846,97,000 | 62 |
Total Outstanding by Subscription Plan
Businesses selling products or services as a subscription may find it challenging to relentlessly monitor the customer's outstanding invoices in a subscription plan. With Chargebee, you can create multiple subscription plans for products and service offerings to your customers and manage the collection process of your subscription business in Receivables effortlessly. If a customer has invoices that are outstanding by a certain number of days, you can easily monitor and analyze the overall outstanding amount by visualizing the Total Outstanding by Subscription Plan chart.
The donut chart displays the summary of the outstanding balance for various subscription plans. You can further drill down into the chart and reveal additional information about the outstanding amount such as the list of customers who subscribe to a plan and have open invoices in the section, list of open invoices, subscription status, and more. Select a particular section in the chart to get the information about an outstanding amount within a subscription plan.
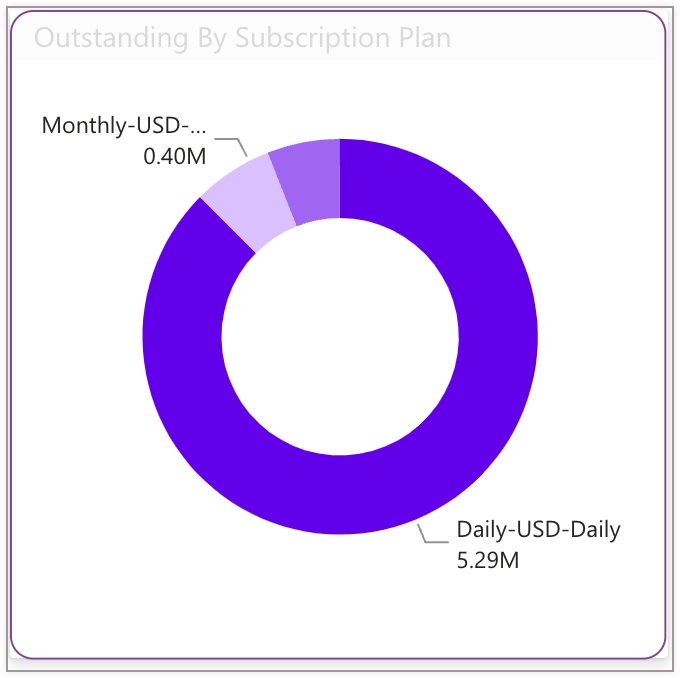
Example
The following information in the table represents the total outstanding balance calculated from all the open invoices of a customer XYZ-01 who subscribed to a Monthly-USD-Monthly subscription plan.
| XYZ-01 (Customer's Name) | Balance |
|---|---|
| Monthly-USD-Monthly | USD 6,27,0798 |
Total Outstanding by Auto Collect
Auto collection determines how you want to charge your customers when the invoices are generated for a subscription plan. Using Chargebee, you can set the auto-collection as On or Off to charge your customers automatically when the invoices are generated. For more information, see creating subscriptions in Chargebee.
The following scenarios given below may help you understand the outstanding invoices based on auto-collection status:
- Auto Collection On: With auto collection turned On, customers have no outstanding invoices and the amount is automatically paid to collectors. However, a customer can raise a dispute or issue against the invoices after the amount is paid, and the issue amount is calculated as outstanding.
- Auto Collection Off: With auto collection turned Off, invoices are generated for customers on a specific billing date. If a customer has not paid for the invoice on the due date, the invoice amount is calculated as outstanding.
Regardless of the customer's auto collection status, you can analyze the statistics for outstanding amount by auto collection status chart. The chart provides you with a clear insight into invoices that are outstanding and helps you address the issues related to payment failure.
The horizontal bar of the chart represents the statistics of outstanding amount along with the auto collection status.
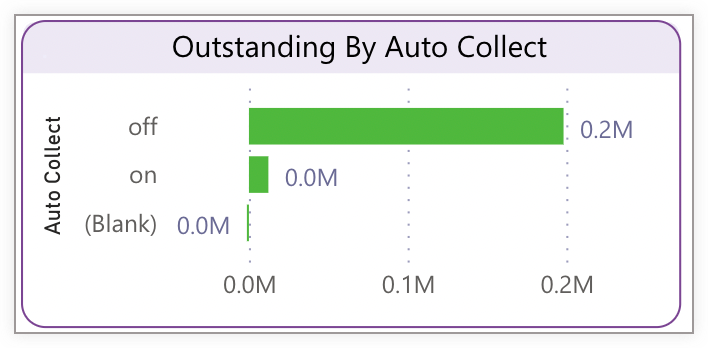
To further drill-down to the information displayed in the chart, select a auto collection status from the chart. You can also expand the information by clicking the data values on the respective charts and tables.
Total Outstanding by Subscription Status
Chargebee allows businesses to offer products and services to their customers on a recurring basis by creating multiple subscription plans, add-ons, and charges. For a specific subscription, the status shows the current stage of the subscription for all the customers. If the invoices are outstanding in a subscription plan, you can analyse the overall outstanding amount by its subscription status. The horizontal bar in the chart highlights the total outstanding amount from all your customer's open invoices with the following subscription status:
- Active: Invoices are generated for customers when they are charged for subscription plans, add-ons, and billing period.
- Canceled: Invoices are generated when customers have open invoices in a subscription plan which will no longer renew.
You can further drill down to the information by clicking on the subscription status label in the chart and gather the additional information associated with your customers, invoices, subscription plans, and more. You can also expand the information by clicking the data values on the respective chart and tables.
Example
The table below represents the total outstanding amount calculated from all the open invoices of customers who have cancelled the subscription. The total outstanding amount is calculated from the beginning of the billing period. As the billing period starts, the invoice are generated and the aging is calculated based on the outstanding period.
| Subscription Status | Outstanding |
|---|---|
| Canceled | USD 1,756,659 |
Viewing the Customer and Invoice data table
Customer Table
The customer and invoice table is a great resource for businesses to keep track of customers and associated billing data. The table lists all the customers across the business and visibilities such as location and business unit. It includes the customer details along with the collection information such as outstanding amount, overdue amount, total number of open invoices, net overdue, open debits (if any), and more. You can keep track of all your customers and related collection information from the columns displayed on the customer table.
When you interact with the customer table, the table data changes accordingly and shows the additional details about a particular customer in respective charts and tables displayed in the dashboard. You can customize the overall view of the customer table by performing actions on rows and columns altogether. For more information, see actions on charts and table data.
See also
Receivables Tech Glossary to know more about the columns in customer table.
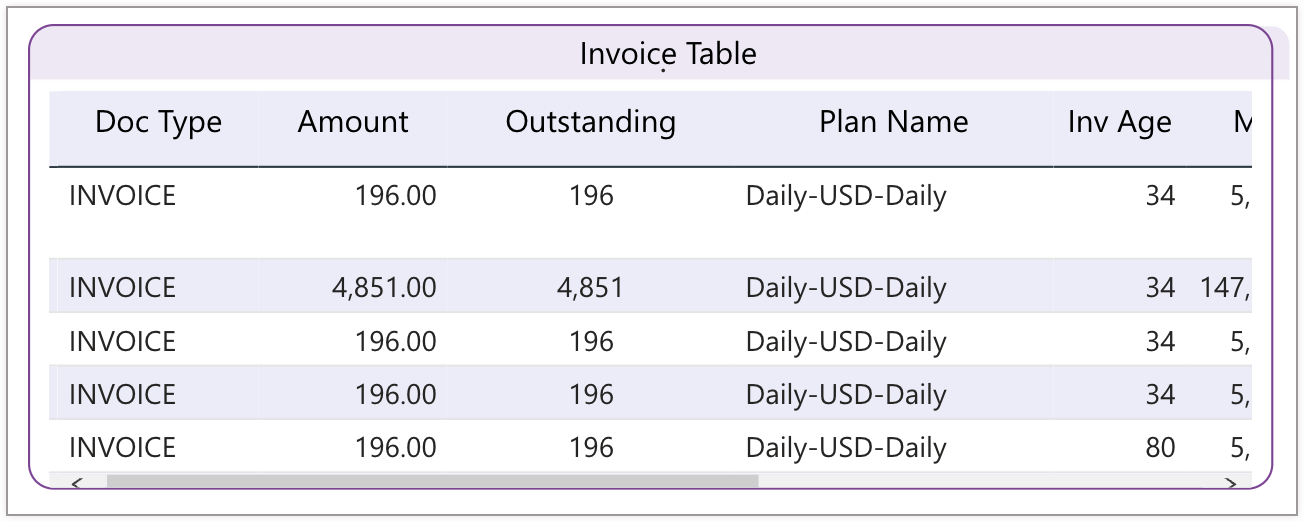
Invoice Table
An invoice is a document that provides details of the amount along with the product purchased by the customers. The invoice table in analytics report displays billing data about all your customers, including the invoice amount, customer details, total average due days, associated subscription plan, and more.
With an invoice table, you can visualize the overall outstanding amount of your customers and identify the issues related to invoices over the period. Similar to the customer table, when you interact with the invoice table, the data value changes accordingly and shows the additional details about a particular invoice in respective charts and tables displayed in the dashboard.
You can also customize the view of the invoice table by performing actions available on charts and tables.
AR Customer Analysis
The report in Customer Analysis dashboard provides you with detailed information about the aging summary, outstanding, promised-to-pay statistics, and more related to customers across business unit, location, and account owner level visibility. It provides you with hierarchy-based reports, that help you drill down to the information for each customer. The dashboard contains the chart and tables that interprets the detailed collection information about your customers. It is helpful in forecasting the cash flow and determining a more detailed summary of when payments are likely to be received.
To access the Customer Analysis dashboard, click Analytics > AR Customer Analysis.
The Customer Analysis dashboard contains the following set of analytics reports that help finance leaders to visualize the collection information and make better decisions on managing the cash flow:
The charts help you identify the key indicators and manage the cash flow of your business by analyzing the statistics important to your business and team members. You can further click on the data points displayed in the chart or table to find additional details about them.
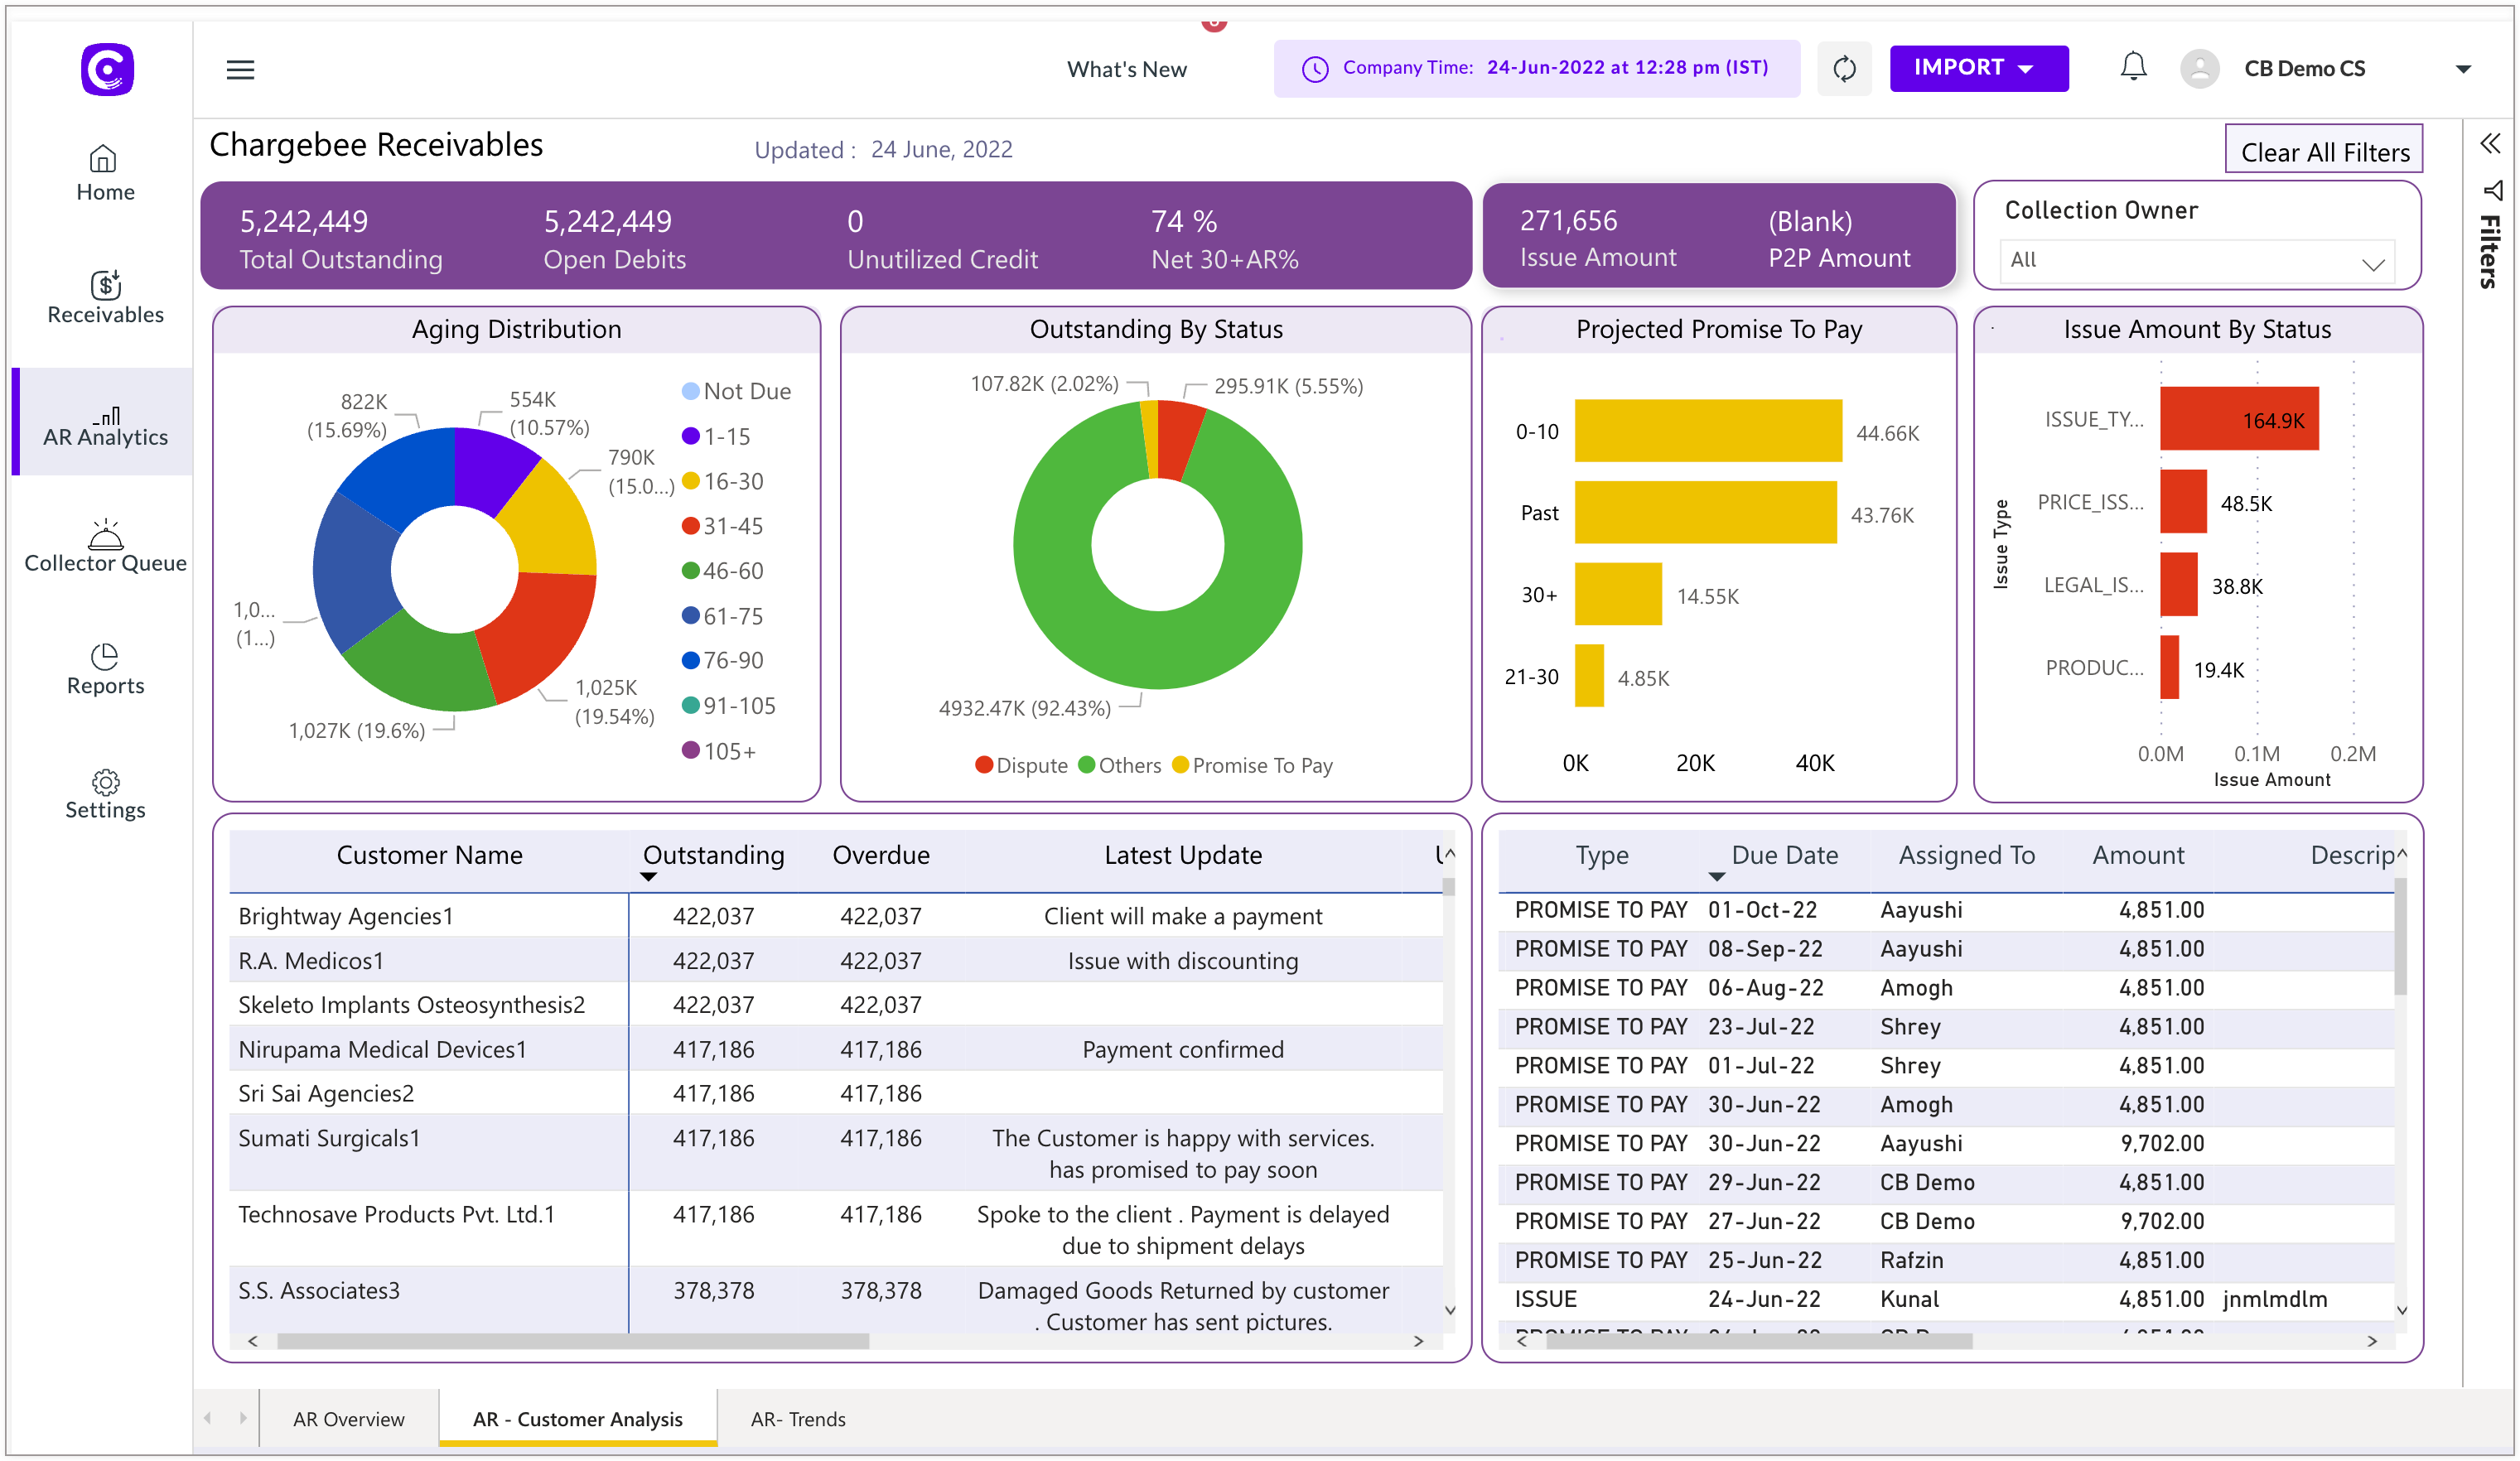
Aging Distribution Chart
If you want to visualize the outstanding amount of your customers by aging buckets, then the outstanding distribution chart will help you analyze that. The outstanding aging distribution chart shows the total outstanding balance amount for which the customers' invoices are outstanding and have been rendered. It also indicates how long these invoices have been outstanding in an aging bucket. The Donut Chart distributes and compresses the overall outstanding balance by aging buckets. The statistical analysis of the chart is helpful for businesses to forecast the cash flow and determine which customers may need attention to ensure timely payment.
Additionally, applying the drill-down operation to a particular section of the chart helps you find more details about the outstanding such as list of customers, projected promise-to-pay statistics, issue amount status(if any), and more.
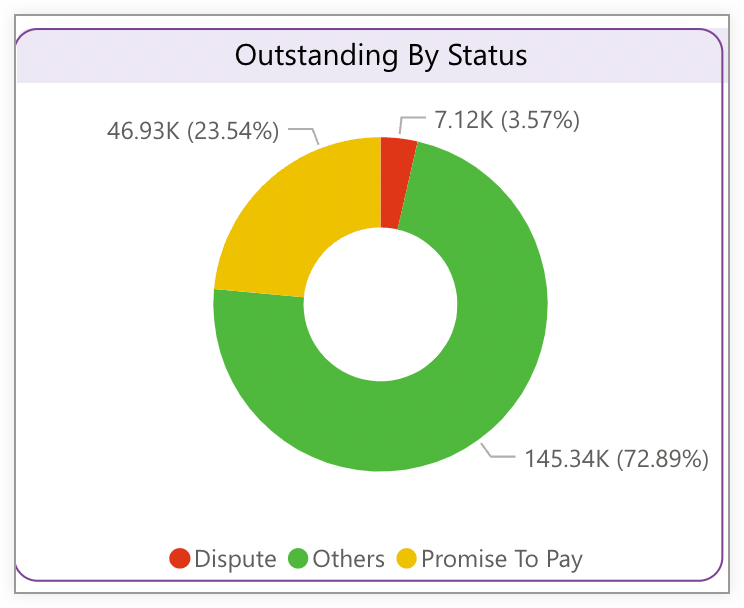
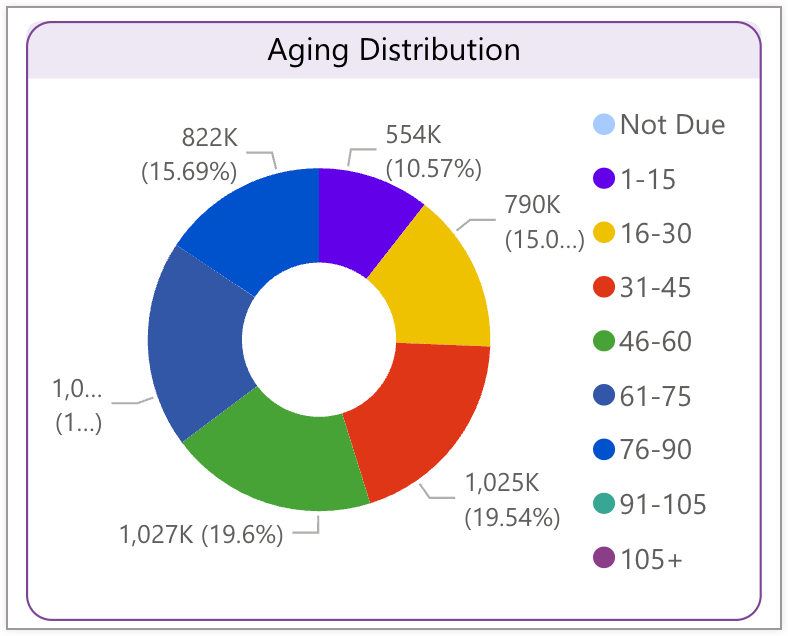
Outstanding by Status
Receivables AR Analytics provides you with an advanced report on outstanding balance that helps you stay updated with all the recent collection activities and historical collection data about your customers. Receivables handles the outstanding invoices and balance by continuously syncing the the status of invoices and payment made by the customers.
The invoice status and balance get updated whenever any collection activities event occurs on the invoices. You can get more visual insights into the outstanding balance data by viewing the outstanding status, such as outstanding balance when the customer has raised disputes, or the outstanding balance when customer has promised to pay a certain amount on a specific date.
The donut chart displays the total outstanding balance along with the current status that helps you find the current stage of the outstanding such as outstanding by dispute, promise to pay, and others.
If you want to see more detailed information about the outstanding status, select a particular section in the chart and drill down to the information. Based on the selected preferences, the dashboard displays the information in the respective charts and tables.
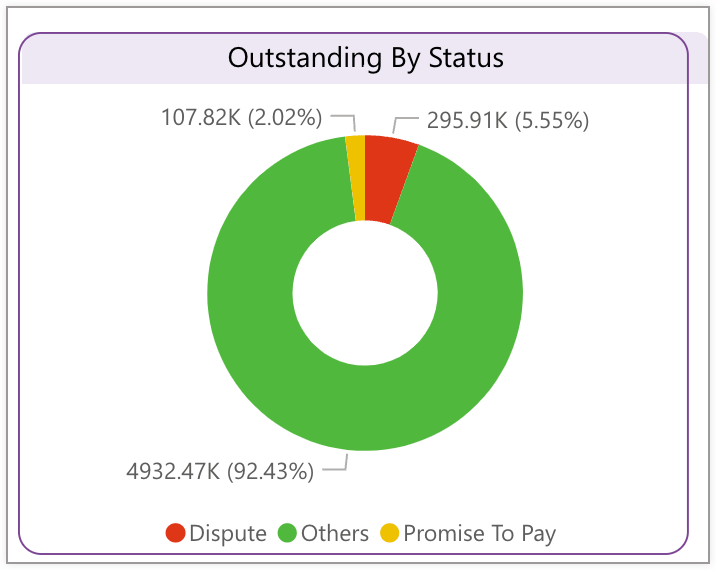
Projected Promise To Pay (PTP)
The Promise to Pay (PTP) statistic reflects how many days on average the sales has been covered from the current invoices at any given time. Knowing this figure helps you plan your company budget and measure the business cash flow. The Projected Promise to Pay (PTP) chart helps analyze the duration of overall promise to pay amount from all your customers. The horizontal bar of the chart represents the total amount projected during a specific period of time.
You can analyze the projected PTP amount by drilling down to the specific duration and listing the associated invoices along with the delinquent customers. Selecting a projected period in the chart reveals the additional information about a specific amount, such as customer details, invoice details for which the customer has given promise to pay, issue amount (if any), and more.
To find more additional information about the customers select a bar in the chart and further drill down to the information. You can find all the relevant information associated with the selected promise to pay period, such issue amount, overall outstanding, customer details, and invoice list from the chart or table displayed in the dashboard.
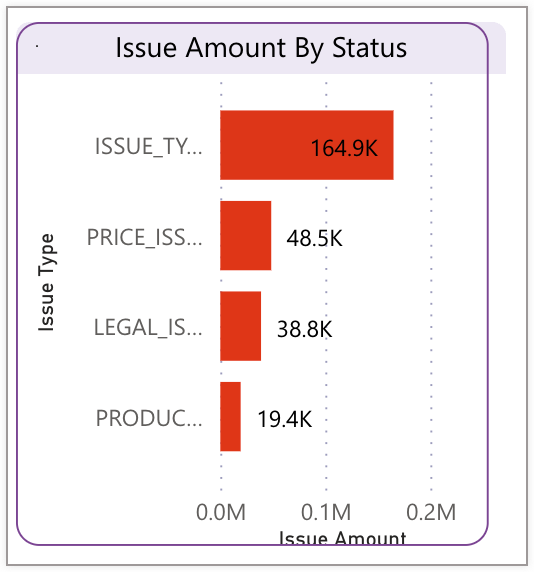
Issue Amount by Status
The report helps you analyze the amount stuck in issues that are raised by the customers and collectors in the event of specific collection activity. The issues are created in Receivables for a number of reasons like when a customer raises a dispute on invoices for receiving the damaged product or when the service is unsatisfactory, and more. The issues can be tracked and accessed via Collector Queue in Receivables.
The advantage of using this report is that it provides you with a concise and clear insight into the issue amount that reflects the collection workflow of your business. The chart displays the horizontal bars defining the total issue Amount with respect to the issue type.
To get more detailed information about a specific issue amount in the chart, select an issue type and the dashboard displays the details in the respective charts and tables.
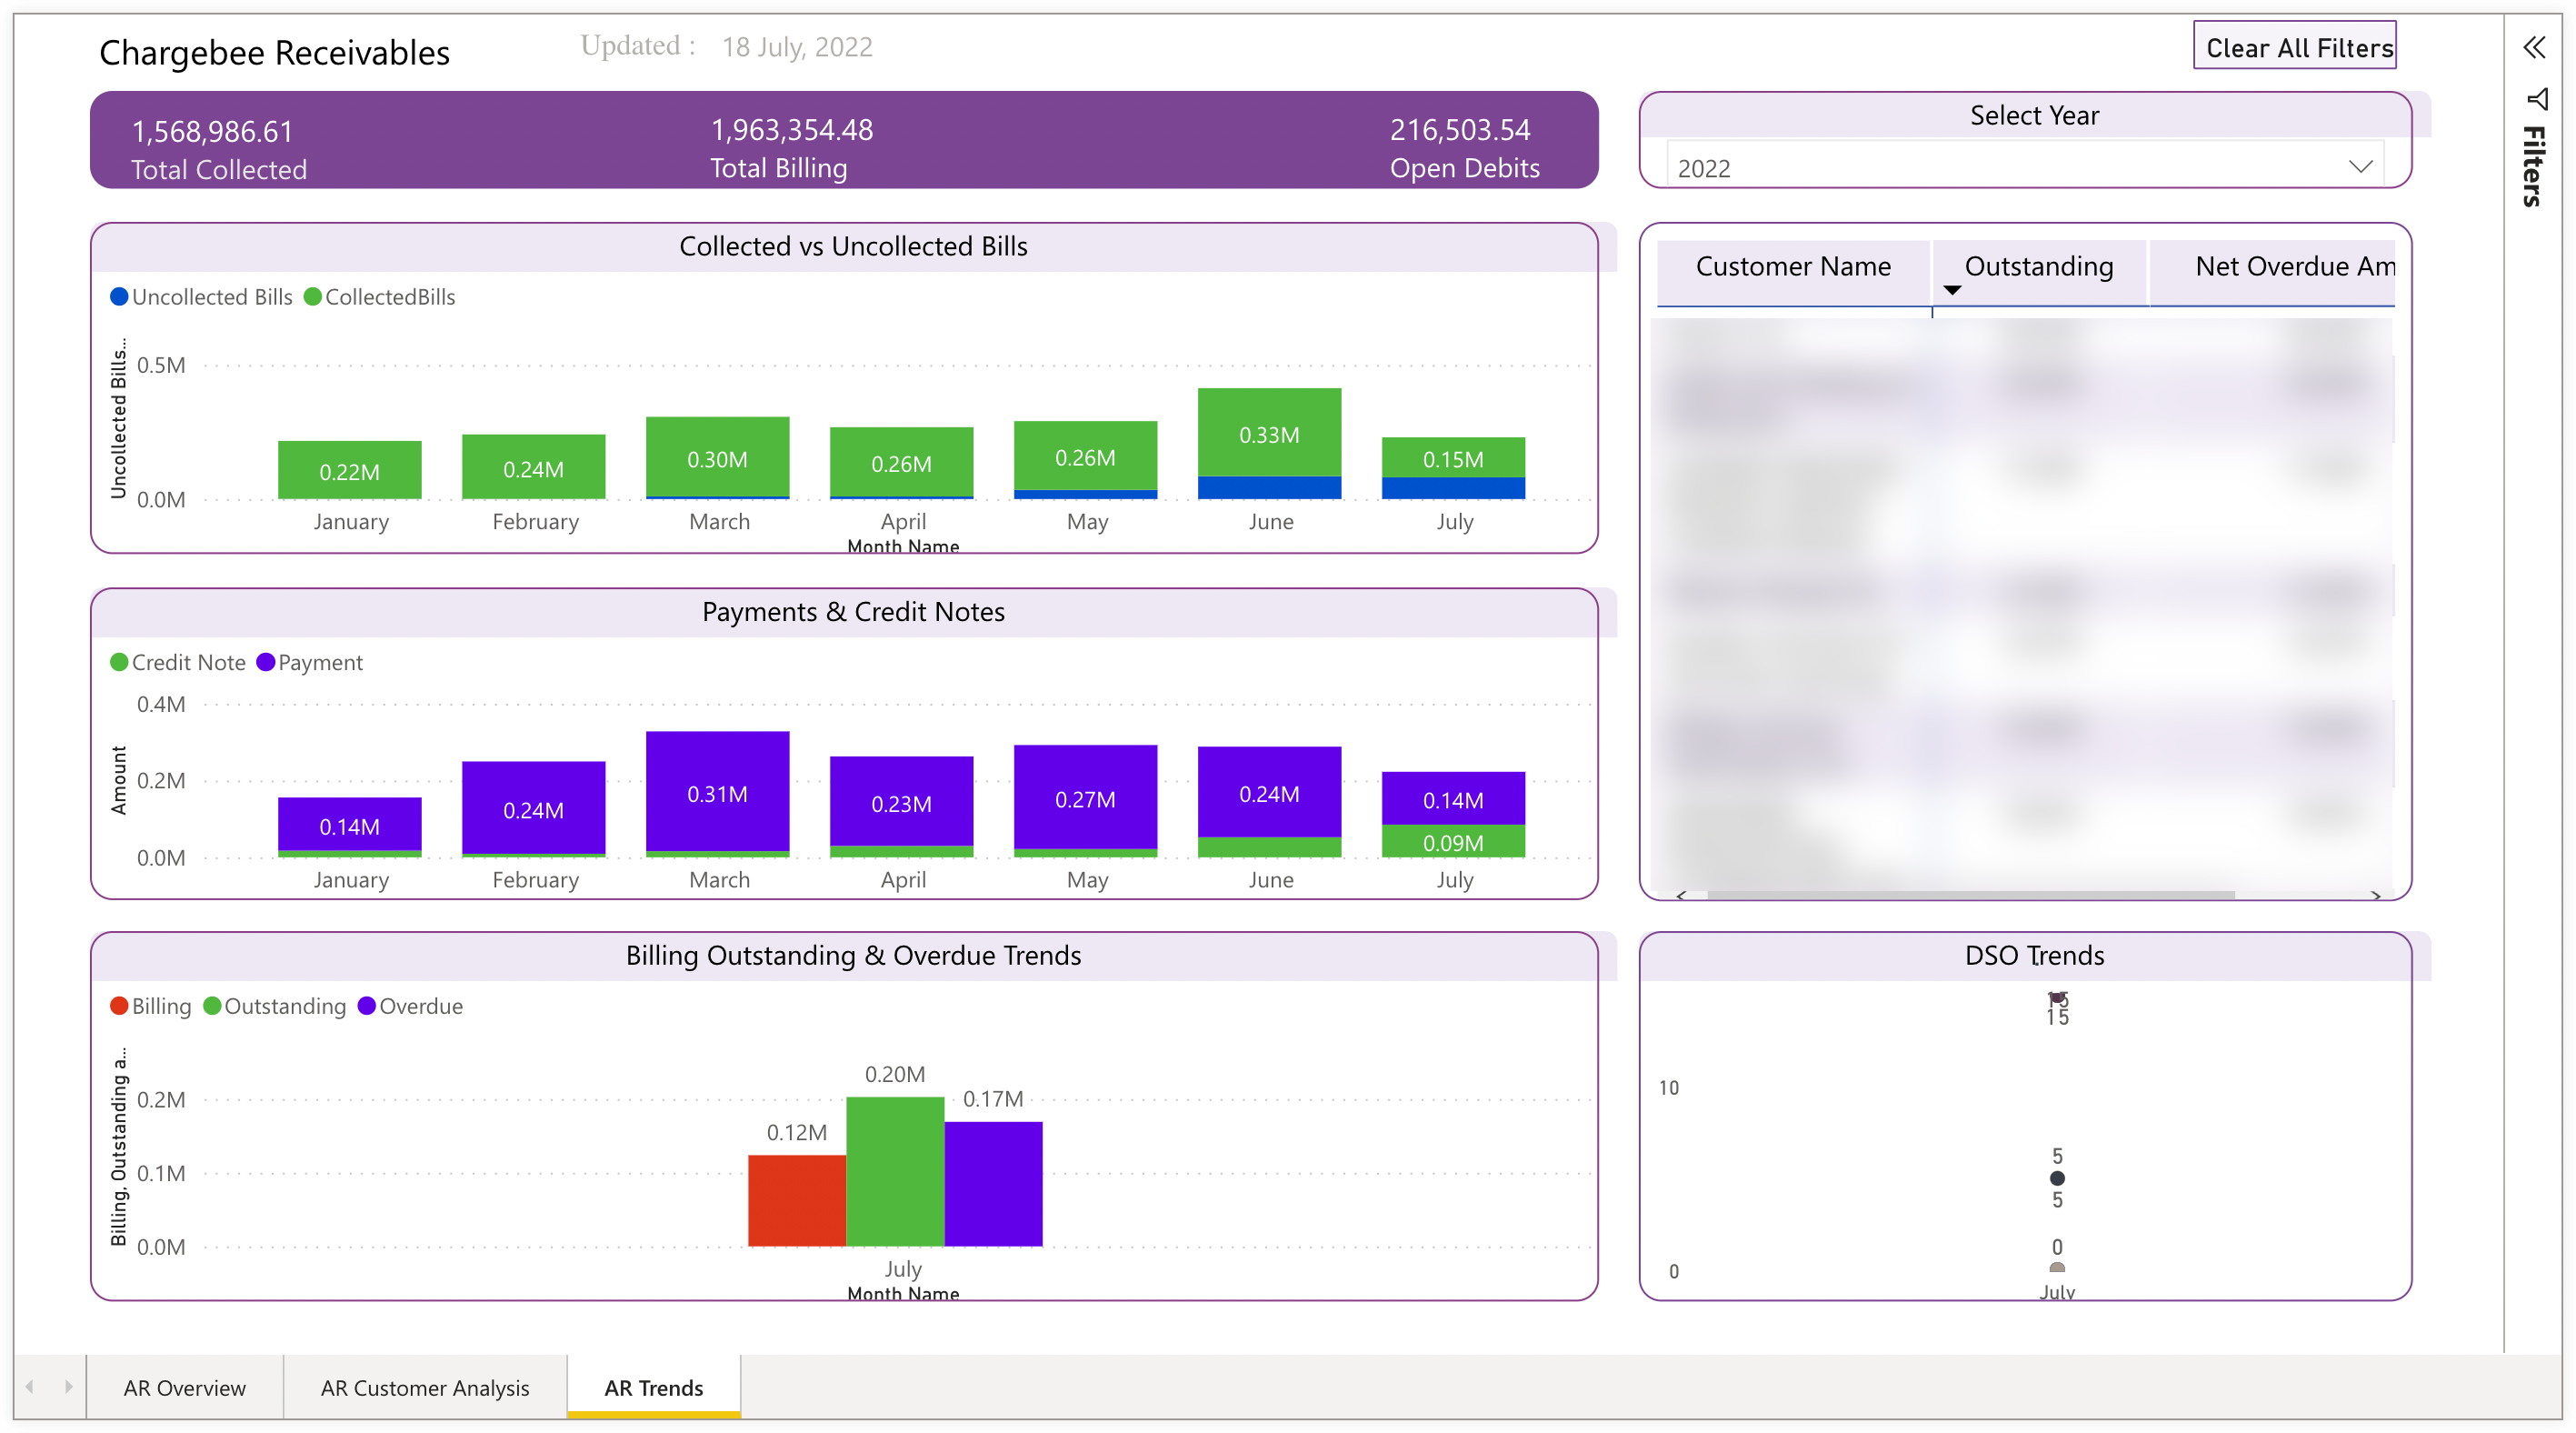
AR Trends
Businesses follow collection strategies that govern how they record and maintain their cash flow by performing collection-related activities in Receivables. It allows them to collect early payments from outstanding and overdue invoices from customers. With AR Trends dashboard view, you can monitor the payment collection from your customers over a period. It displays the historical performance of your business's collection processes, enabling you to assess the total outstanding amount from all your customers at a more granular level.
The AR Trends dashboard displays the overall statistics on total payment collection, uncollected payments or bills, and total payment amount from all your customers. You can get a summary of overall payments made by customers and credit notes issued over a period.
Click AR Analytics > AR Trends tab to view the charts and tables and get insights on customer-specific collection performance over a period. This highlights the overall outstanding billing performance and Daily Sales Outstanding (DSO) that impacts your business cash flow.
Was this article helpful?