PFR Commission Report
This detailed report shows what you have been charged for during a month. It also offers a reference list of failures recovered via Receivables after retries.
Follow the steps below to generate the report:
-
Log in to your Receivables account.
-
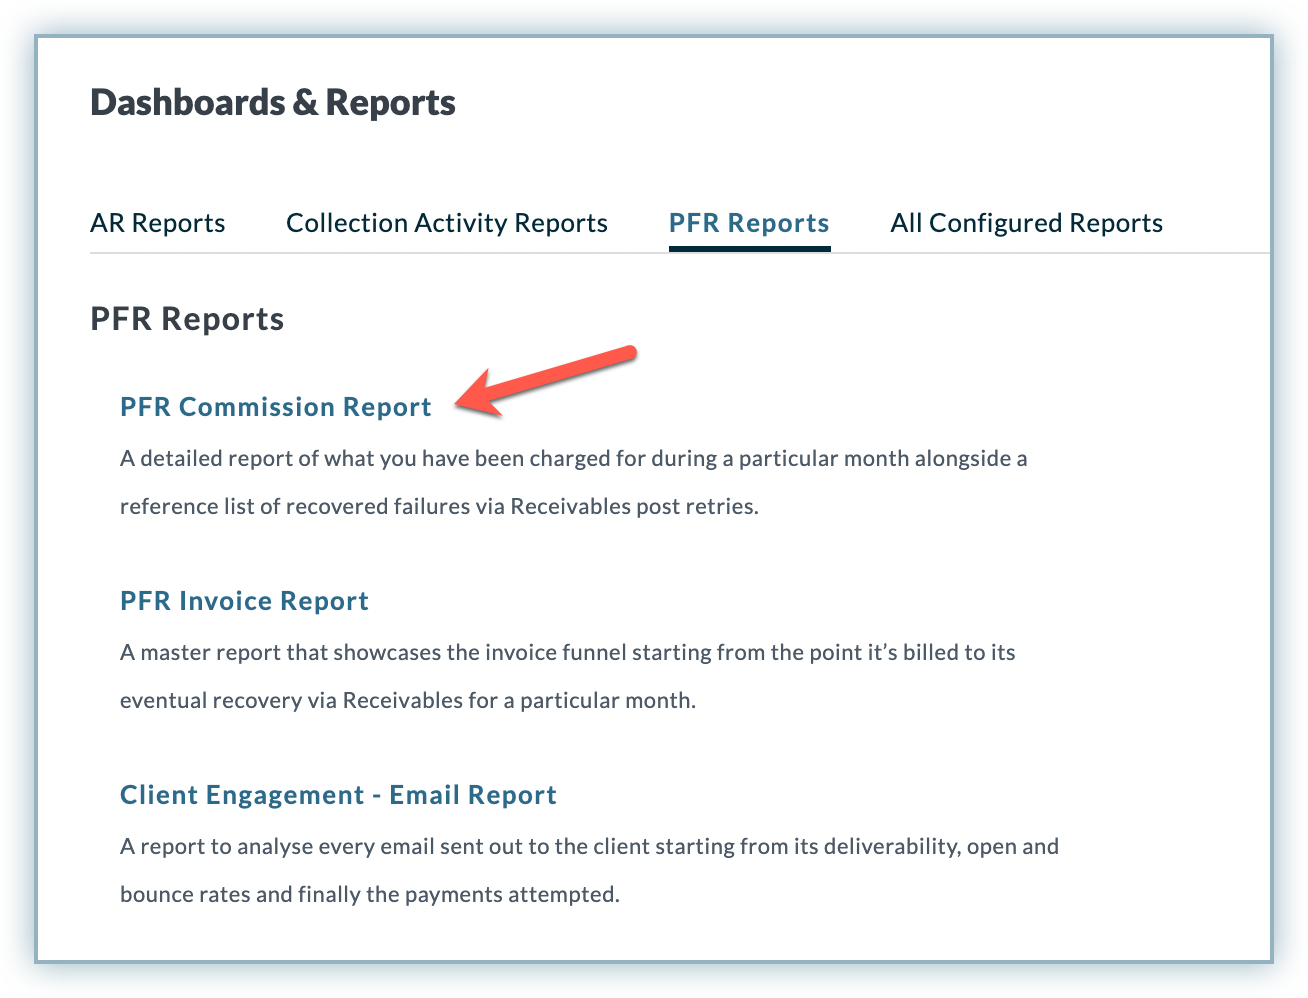
Go to Reports > PFR Reports.
-
Click PFR Commission Report.
-
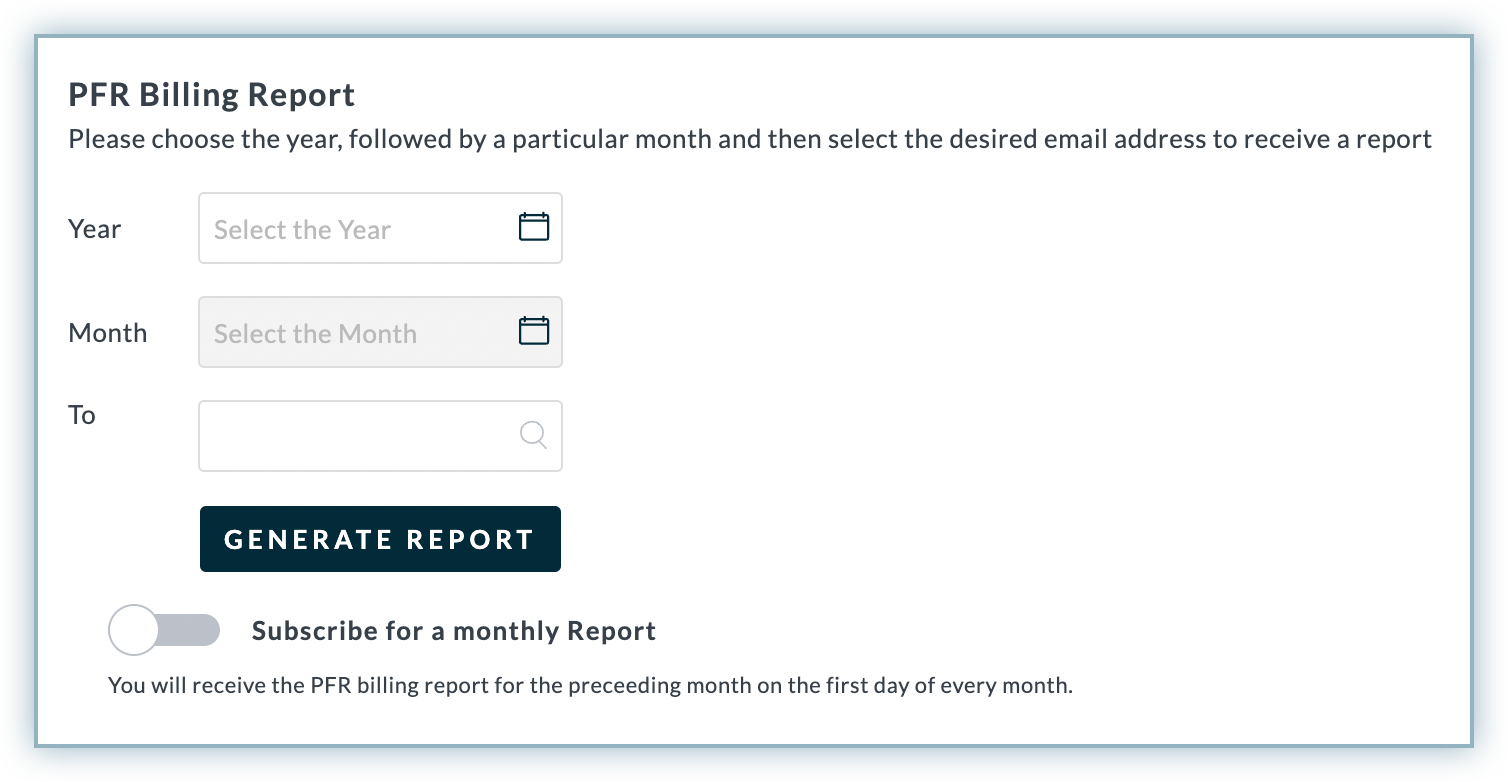
Select the Year and Month for which you want to generate the report.
-
Select the user to whom you want to send the report. Select You from the list if you want to receive the email.
-
Enable Subscribe for a monthly report if you want to receive the PFR Commission Report monthly.
-
Click GENERATE REPORT. You will receive an email with a link as a call to action to download the report.
-
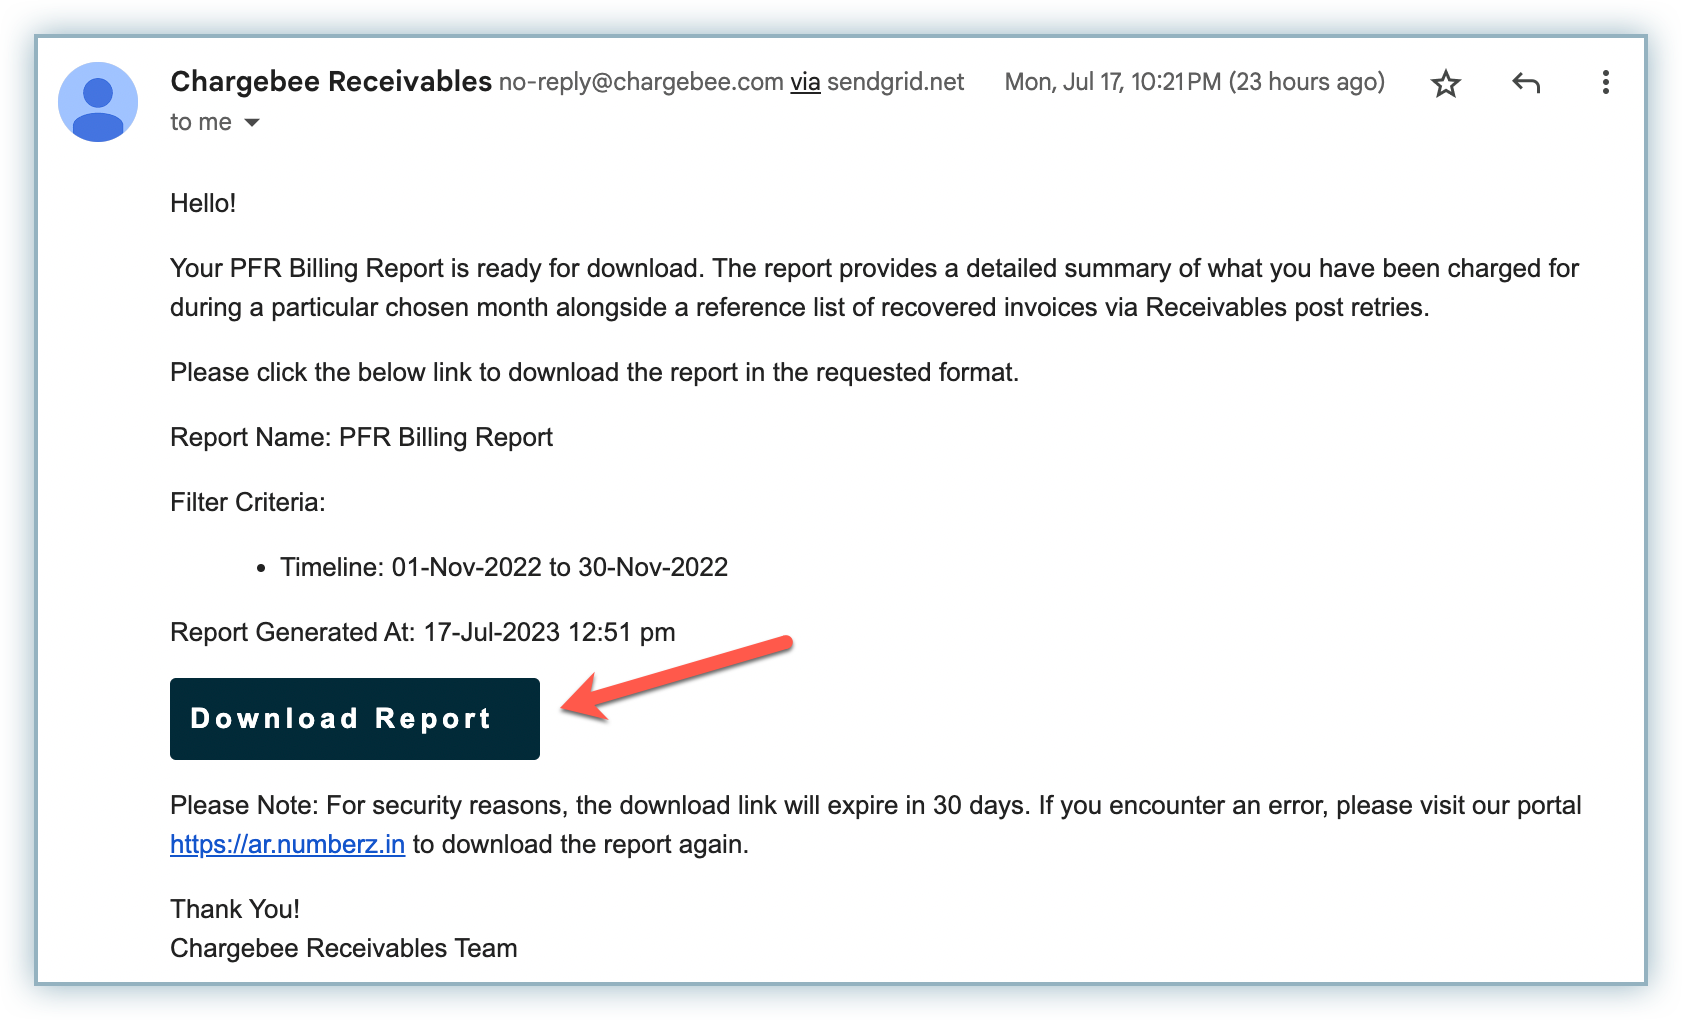
In the email, click Download Report to download the report file to your system.
Now that you have downloaded the report, let's dig deeper into the columns and rows of the report:
This report contains two sheets: Summary Report and Reference Invoice Report. The Summary Report shows a summary with numerical data for your payment failure recovery, while the Reference Invoice Report shows the details of all the recovered invoices, including fields like customer name, month billed, month paid, and more.
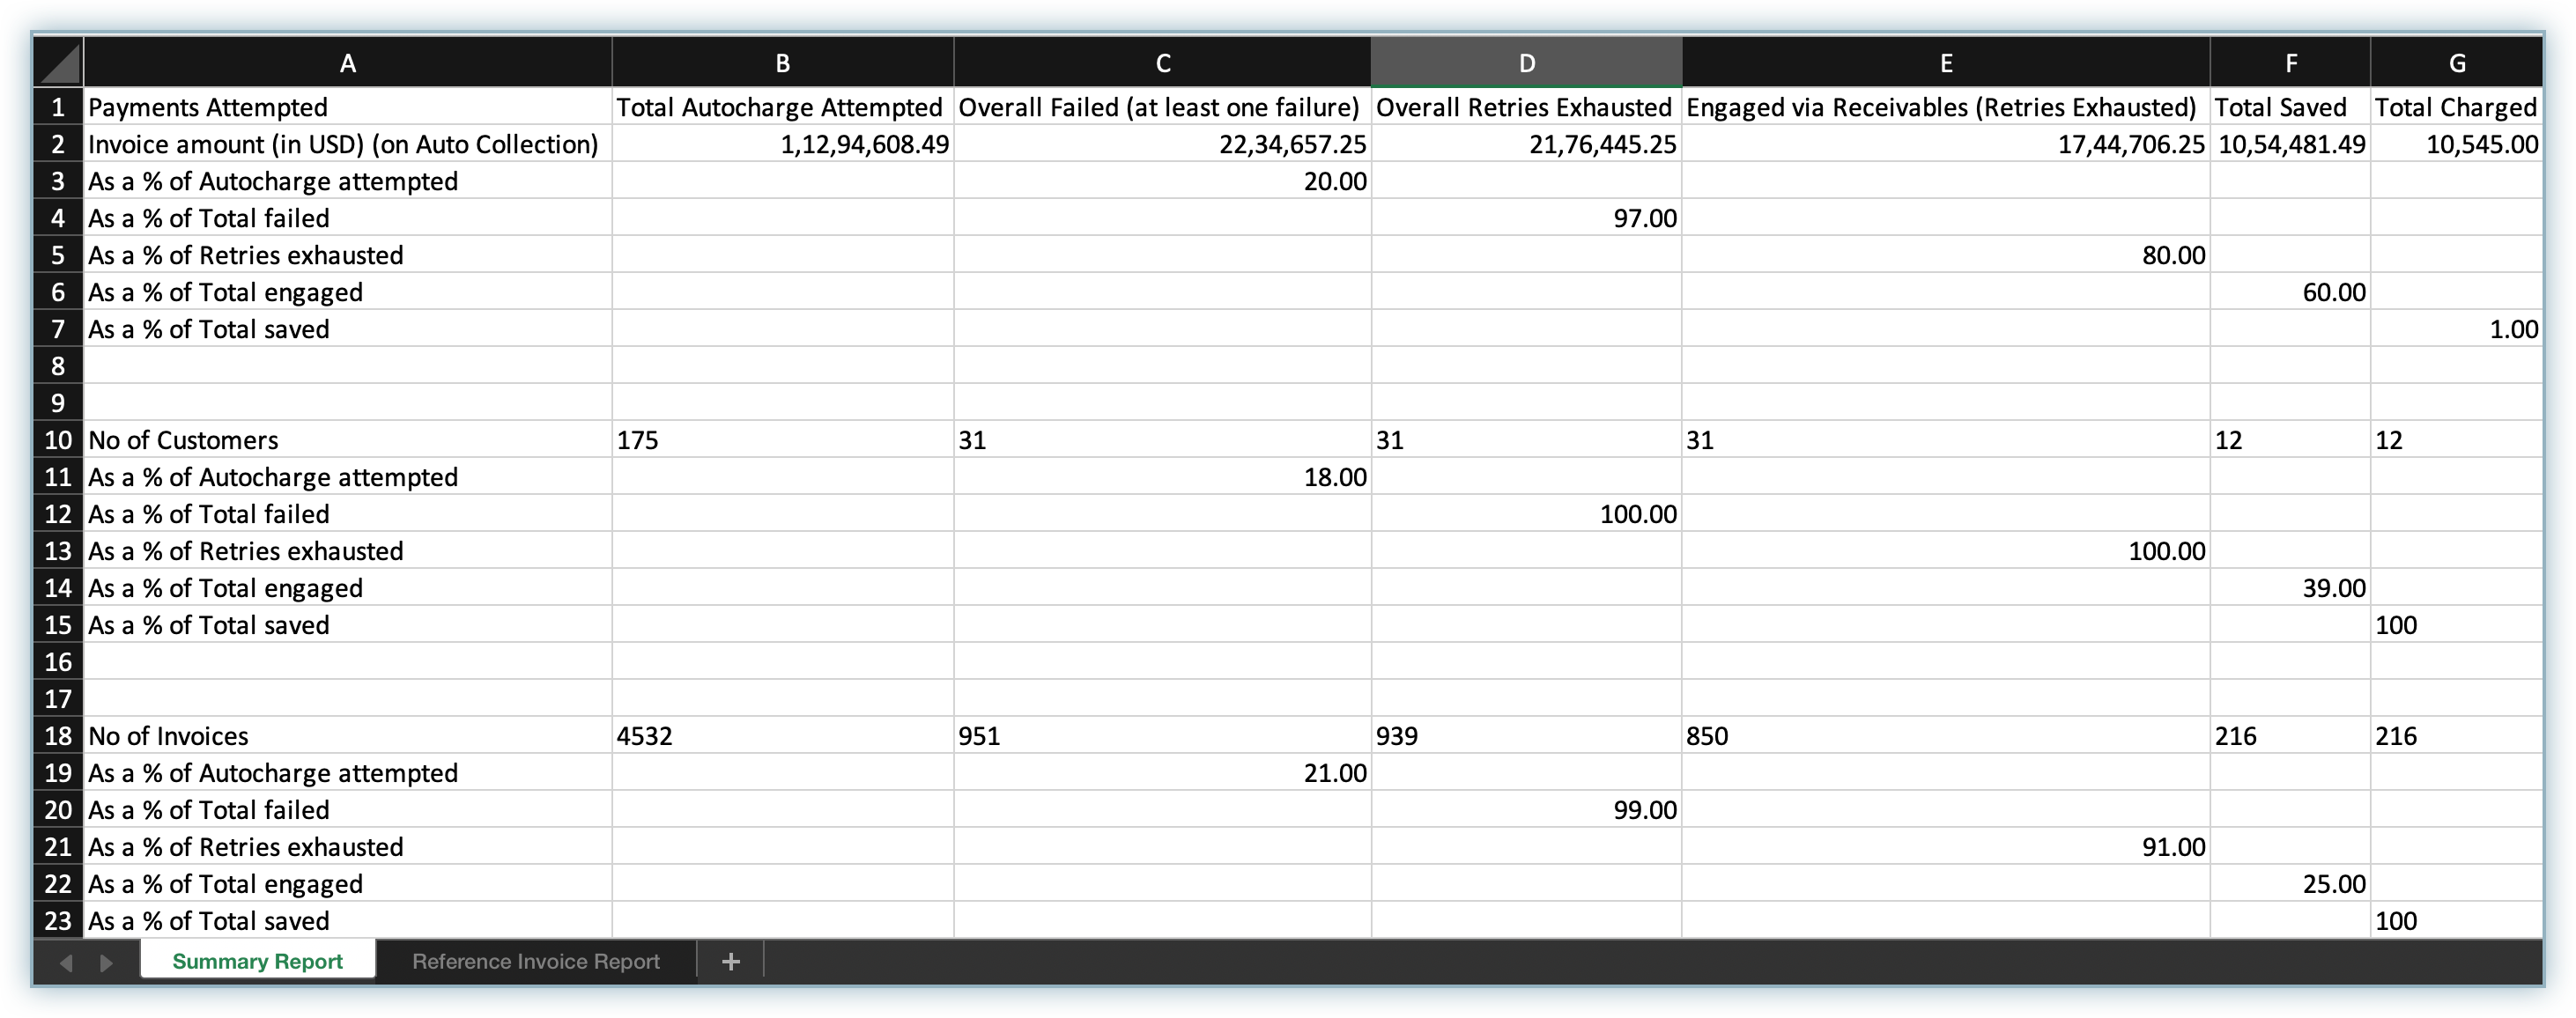
Summary Report
The summary report is divided into three funnels: Payments Attempted, Number of Customers, and Number of Invoices. Each of these funnels contains the following columns:
| Column | Description |
|---|---|
| Total Autocharge Attempted | The total amount of automated payments that were attempted during a selected period. |
| Overall Failed (at least one failure) | The total amount of failed payments out of the total attempted during a month. This includes the data for customers with at least one payment failure. |
| Overall Retries Exhausted | The total amount of payments for which retries were exhausted out of the total failed. |
| Engaged via Receivables (Retries Exhausted) | The total amount of failed payments whose all retries were exhausted and engaged via Receivables. |
| Total Saved | The total amount of payments that were recovered via Receivables whose all retries were exhausted. |
| Total Charged | The total amount you are charged by Chargebee for the recoveries made via Receivables. |
Interpreting the Report
This report represents a funnel that breaks down into multiple statistical values as you move from one column to the next.
Here, in the Payments Attempted section,
| Column | Description |
|---|---|
| Total Autocharge Attempted | It represents the total amount that was charged. |
| Overall Failed (at least one failure) | It represents the total amount of failed payments out of the Total Autocharge Attempted. |
| Overall Retries Exhausted | It represents the total amount of invoices with retries exhausted out of the Overall Failed. |
| Engaged via Receivables (Retries Exhausted) | It represents the total amount that was attempted to recover by engaging via receivables out of the Overall Retries Exhausted value. |
| Total Saved | It is the total amount recovered from the Engaged via Receivables value. |
| Total Charged | It is the amount charged as a percentage of the Total Saved value. |
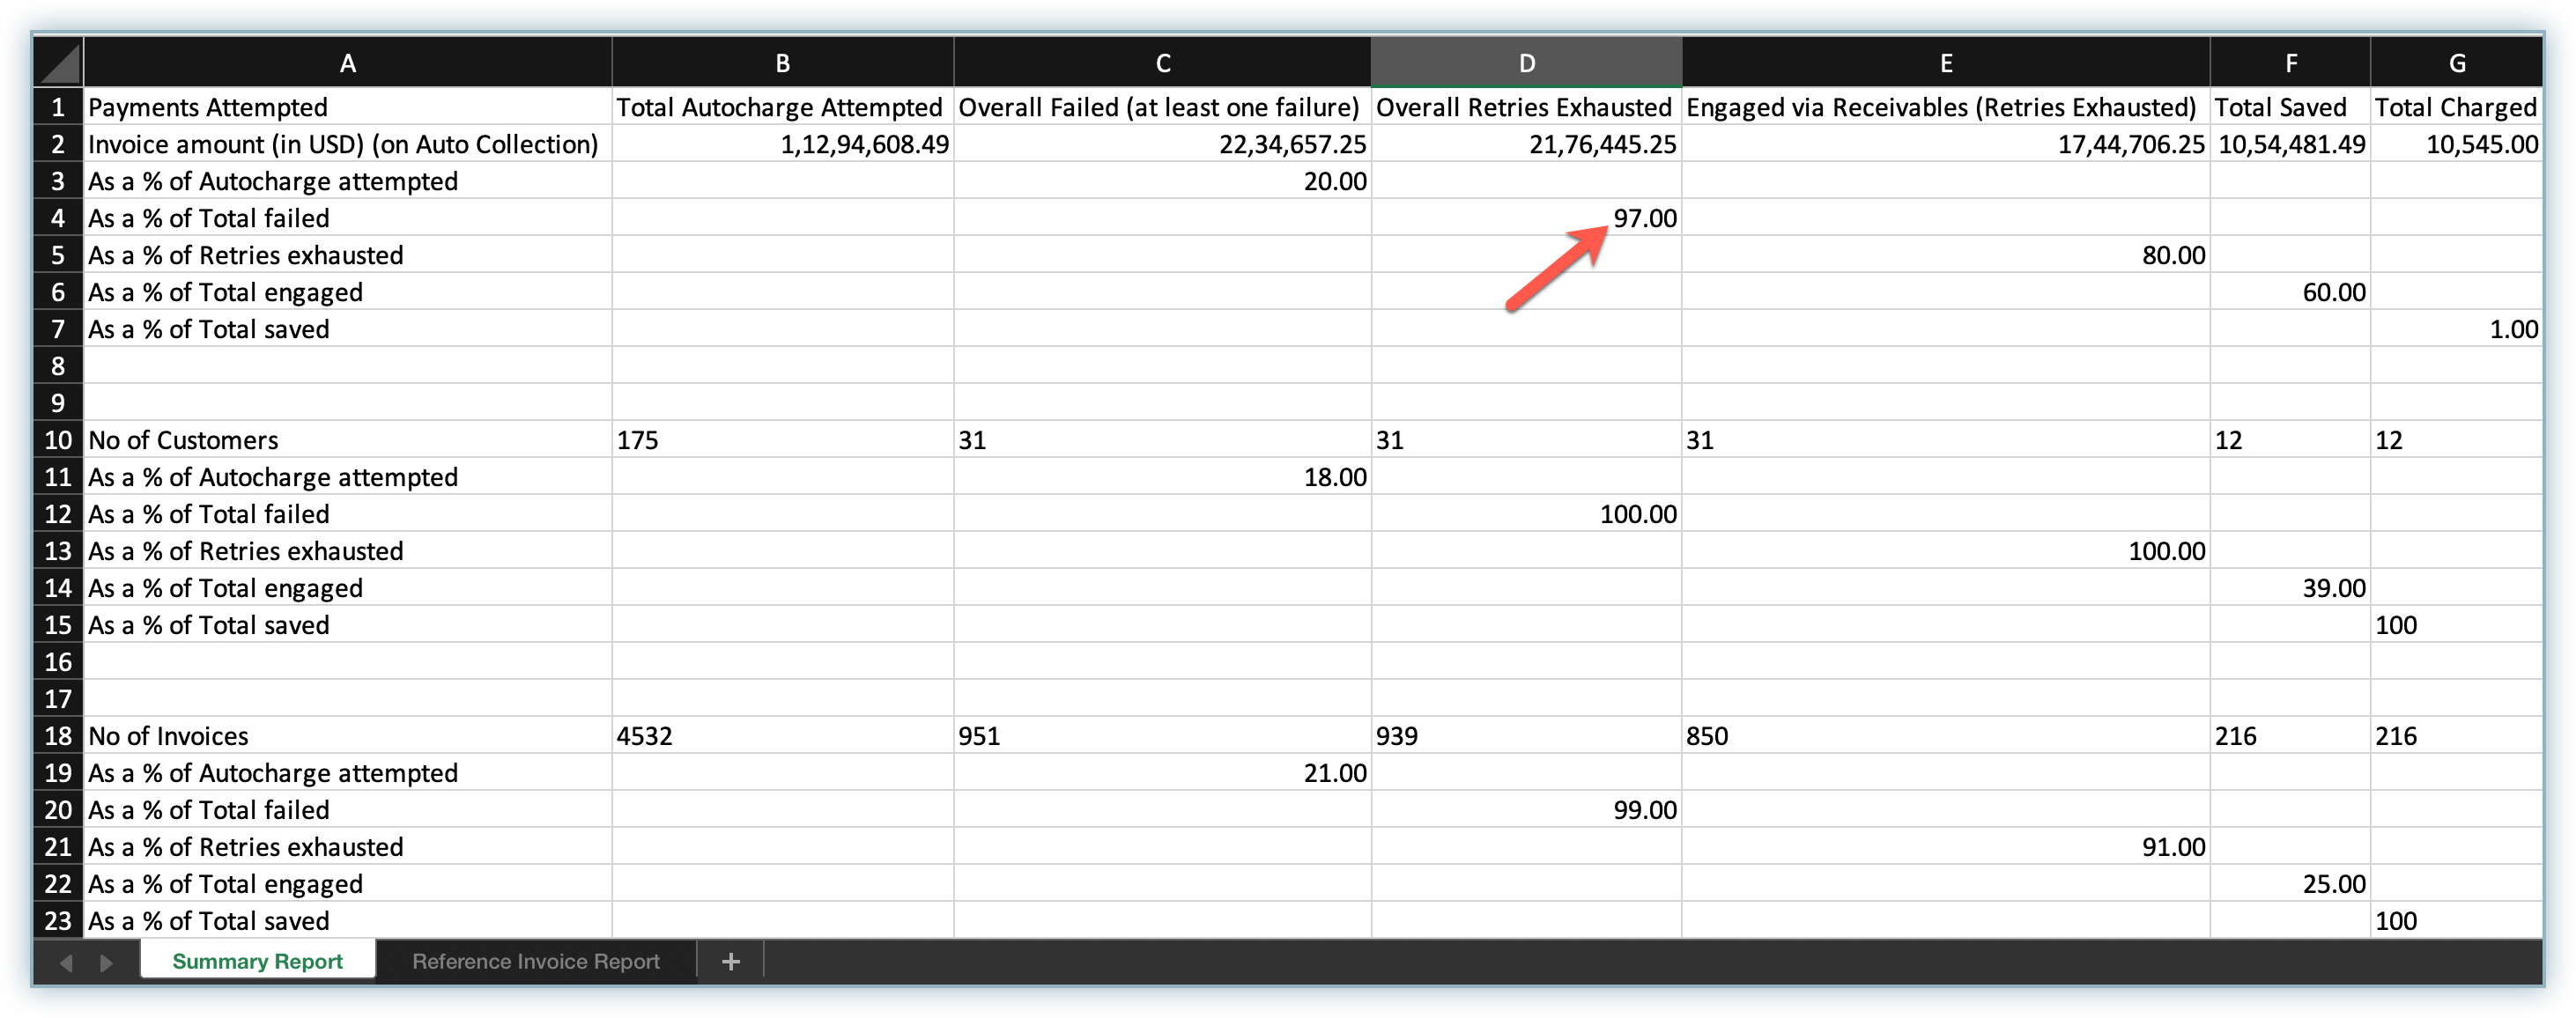
Once you understand this, let's see how you can map the rows and columns of the report:
For example, on the left, you have As a % of Total Failed, and there is a value of 97.00 under the column Overall Retries Exhausted. This means that 97% of Total Failed payments (row) had Retries Exhausted (column).
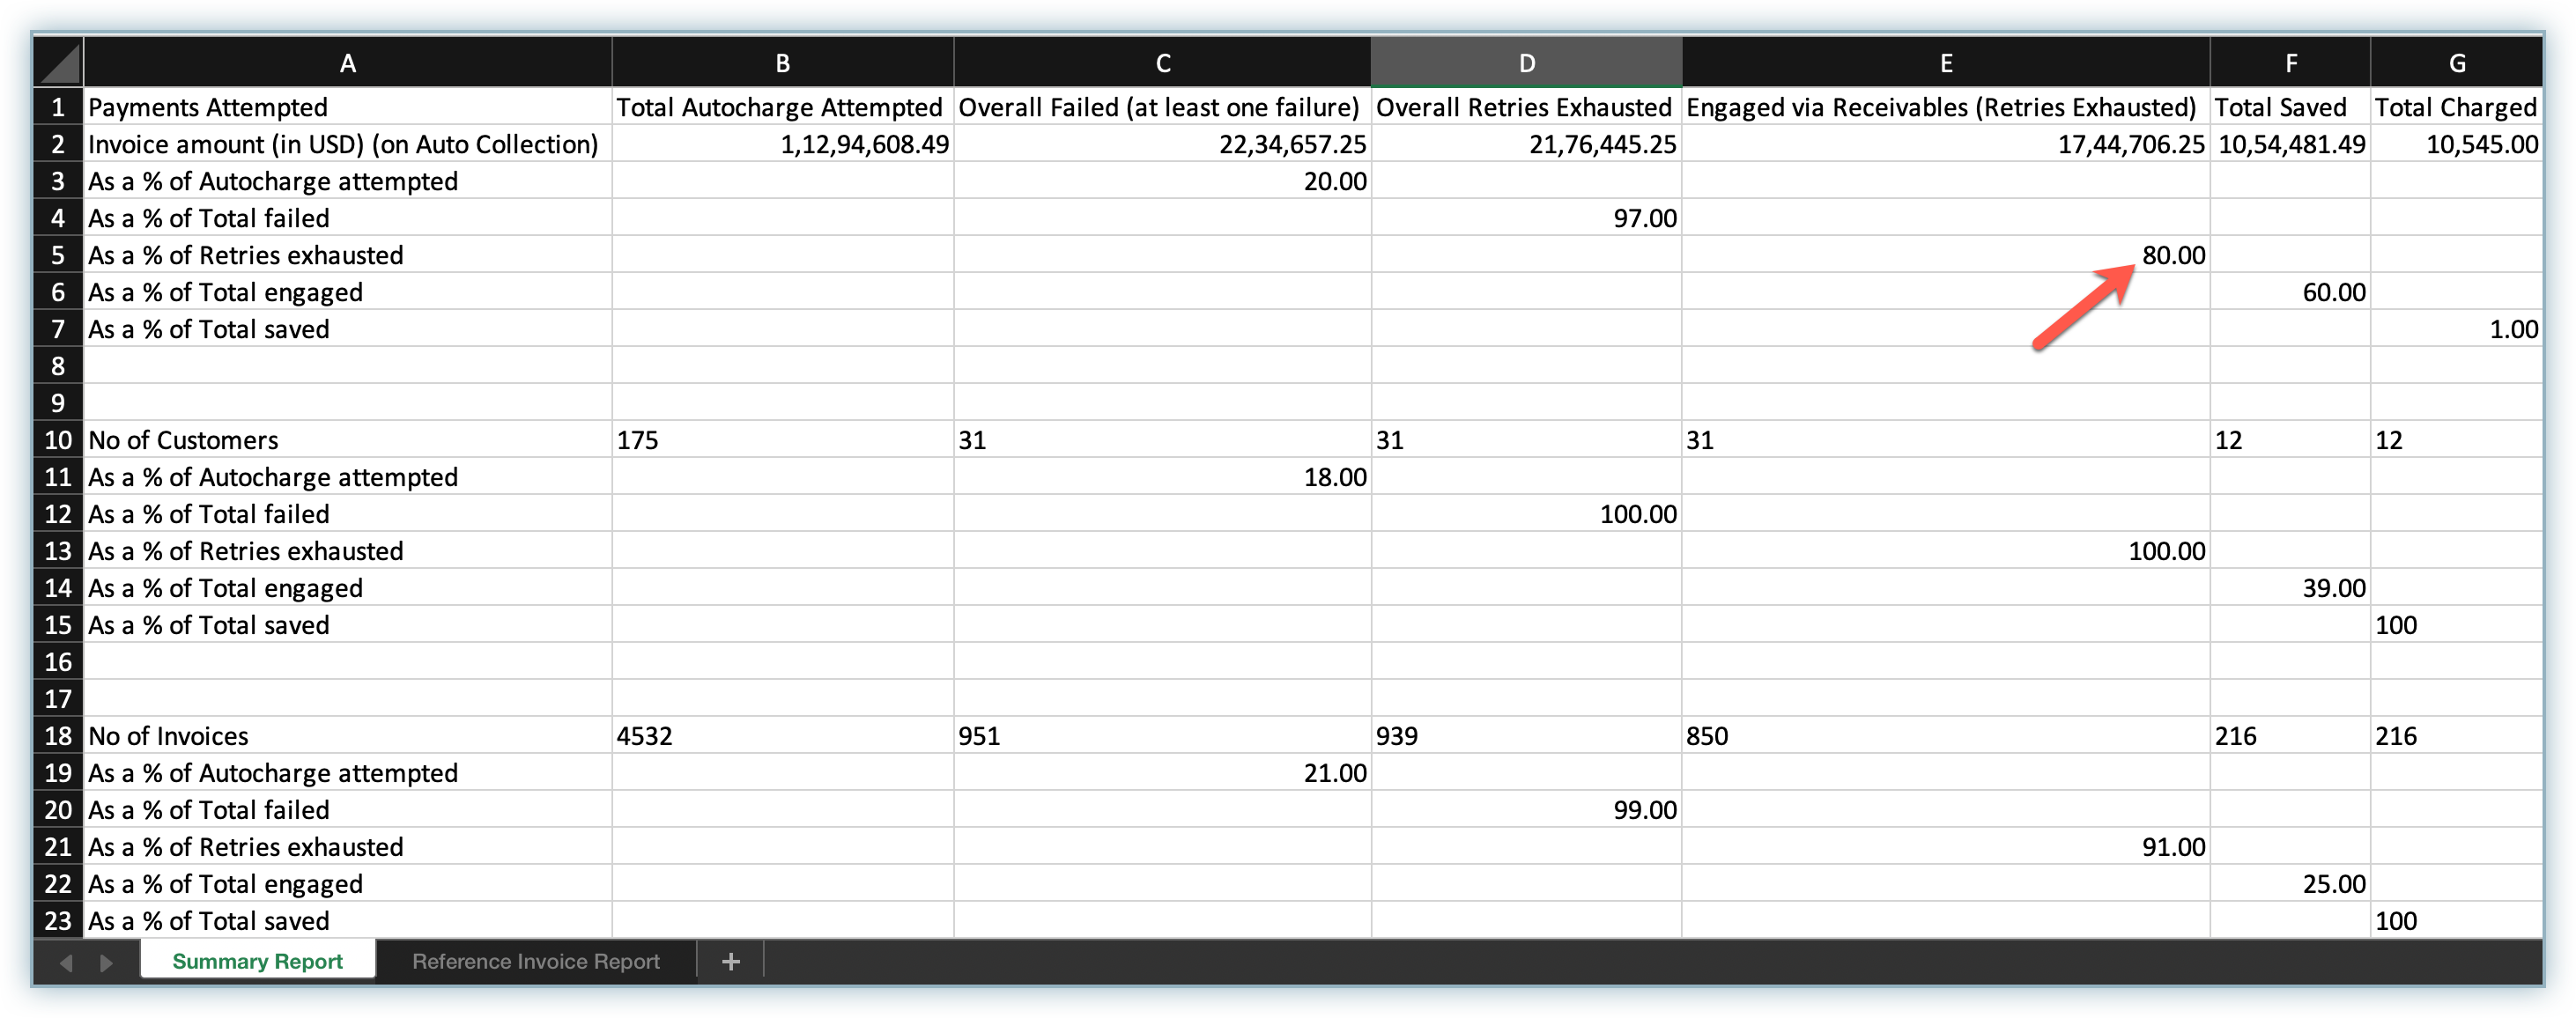
Another example:
On the left, you have As a % of Retries exhausted with a value of 80.00 under the Engaged via Receivables (Retries Exhausted) column. This means that 80% of the failed payments with retries exhausted (row) were engaged via Receivables (column).
Similarly, you can map other rows and columns and get the proper context of the values under them.
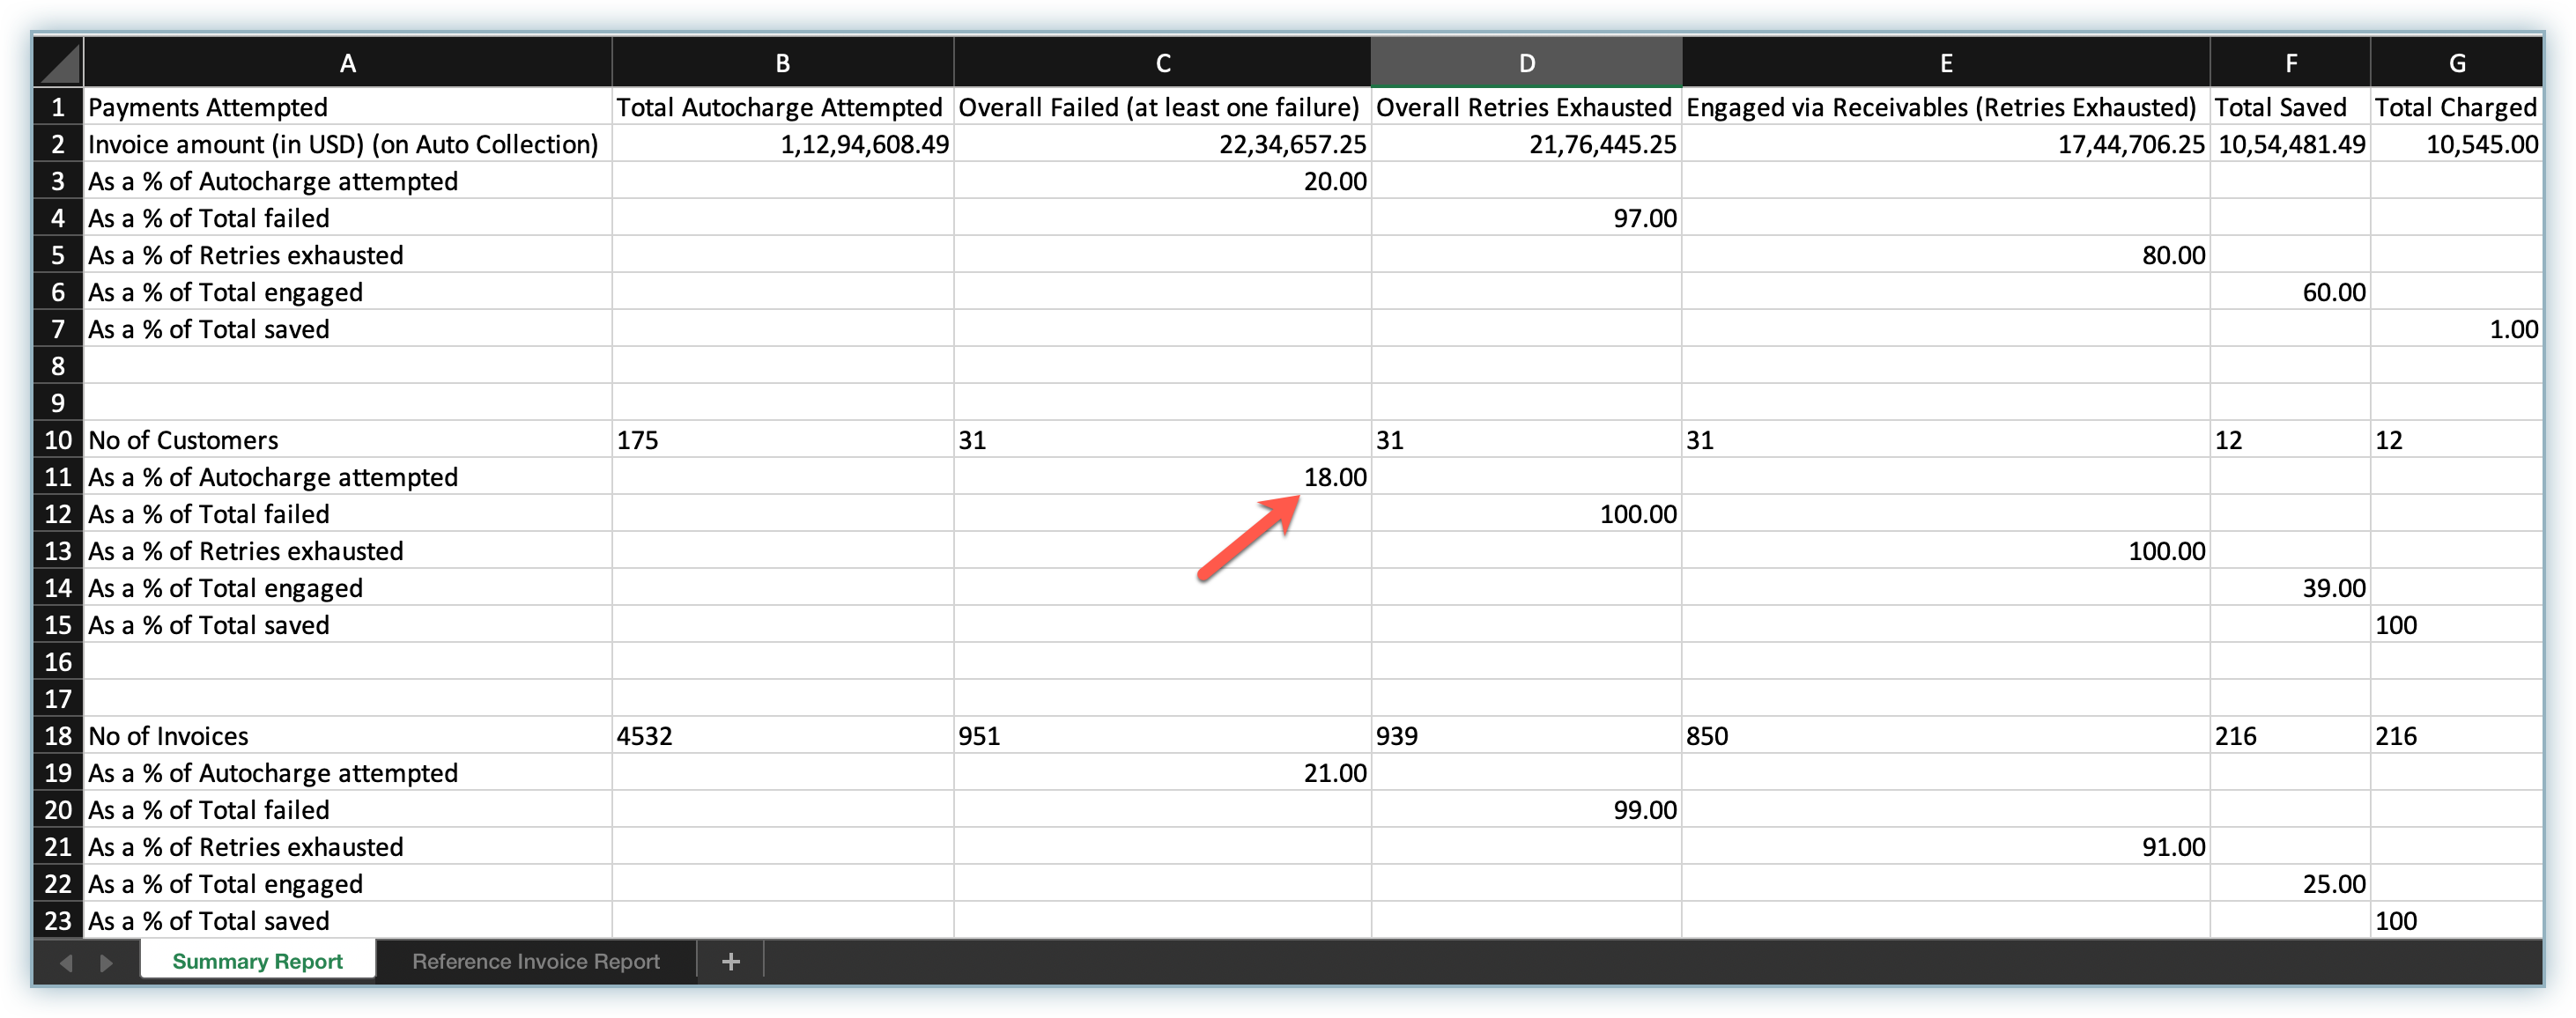
Also, the Number of Customers section contains the data as a percentage of the number of customers, and the Number of Invoices includes the data as a percentage of the number of invoices.
For example, here we have As a % of Autocharge attempted on the left with a value of 18.00 under the column Overall Failed (at least one failure). This means that 18% of the customers who were charged (row) had at least one payment failure.
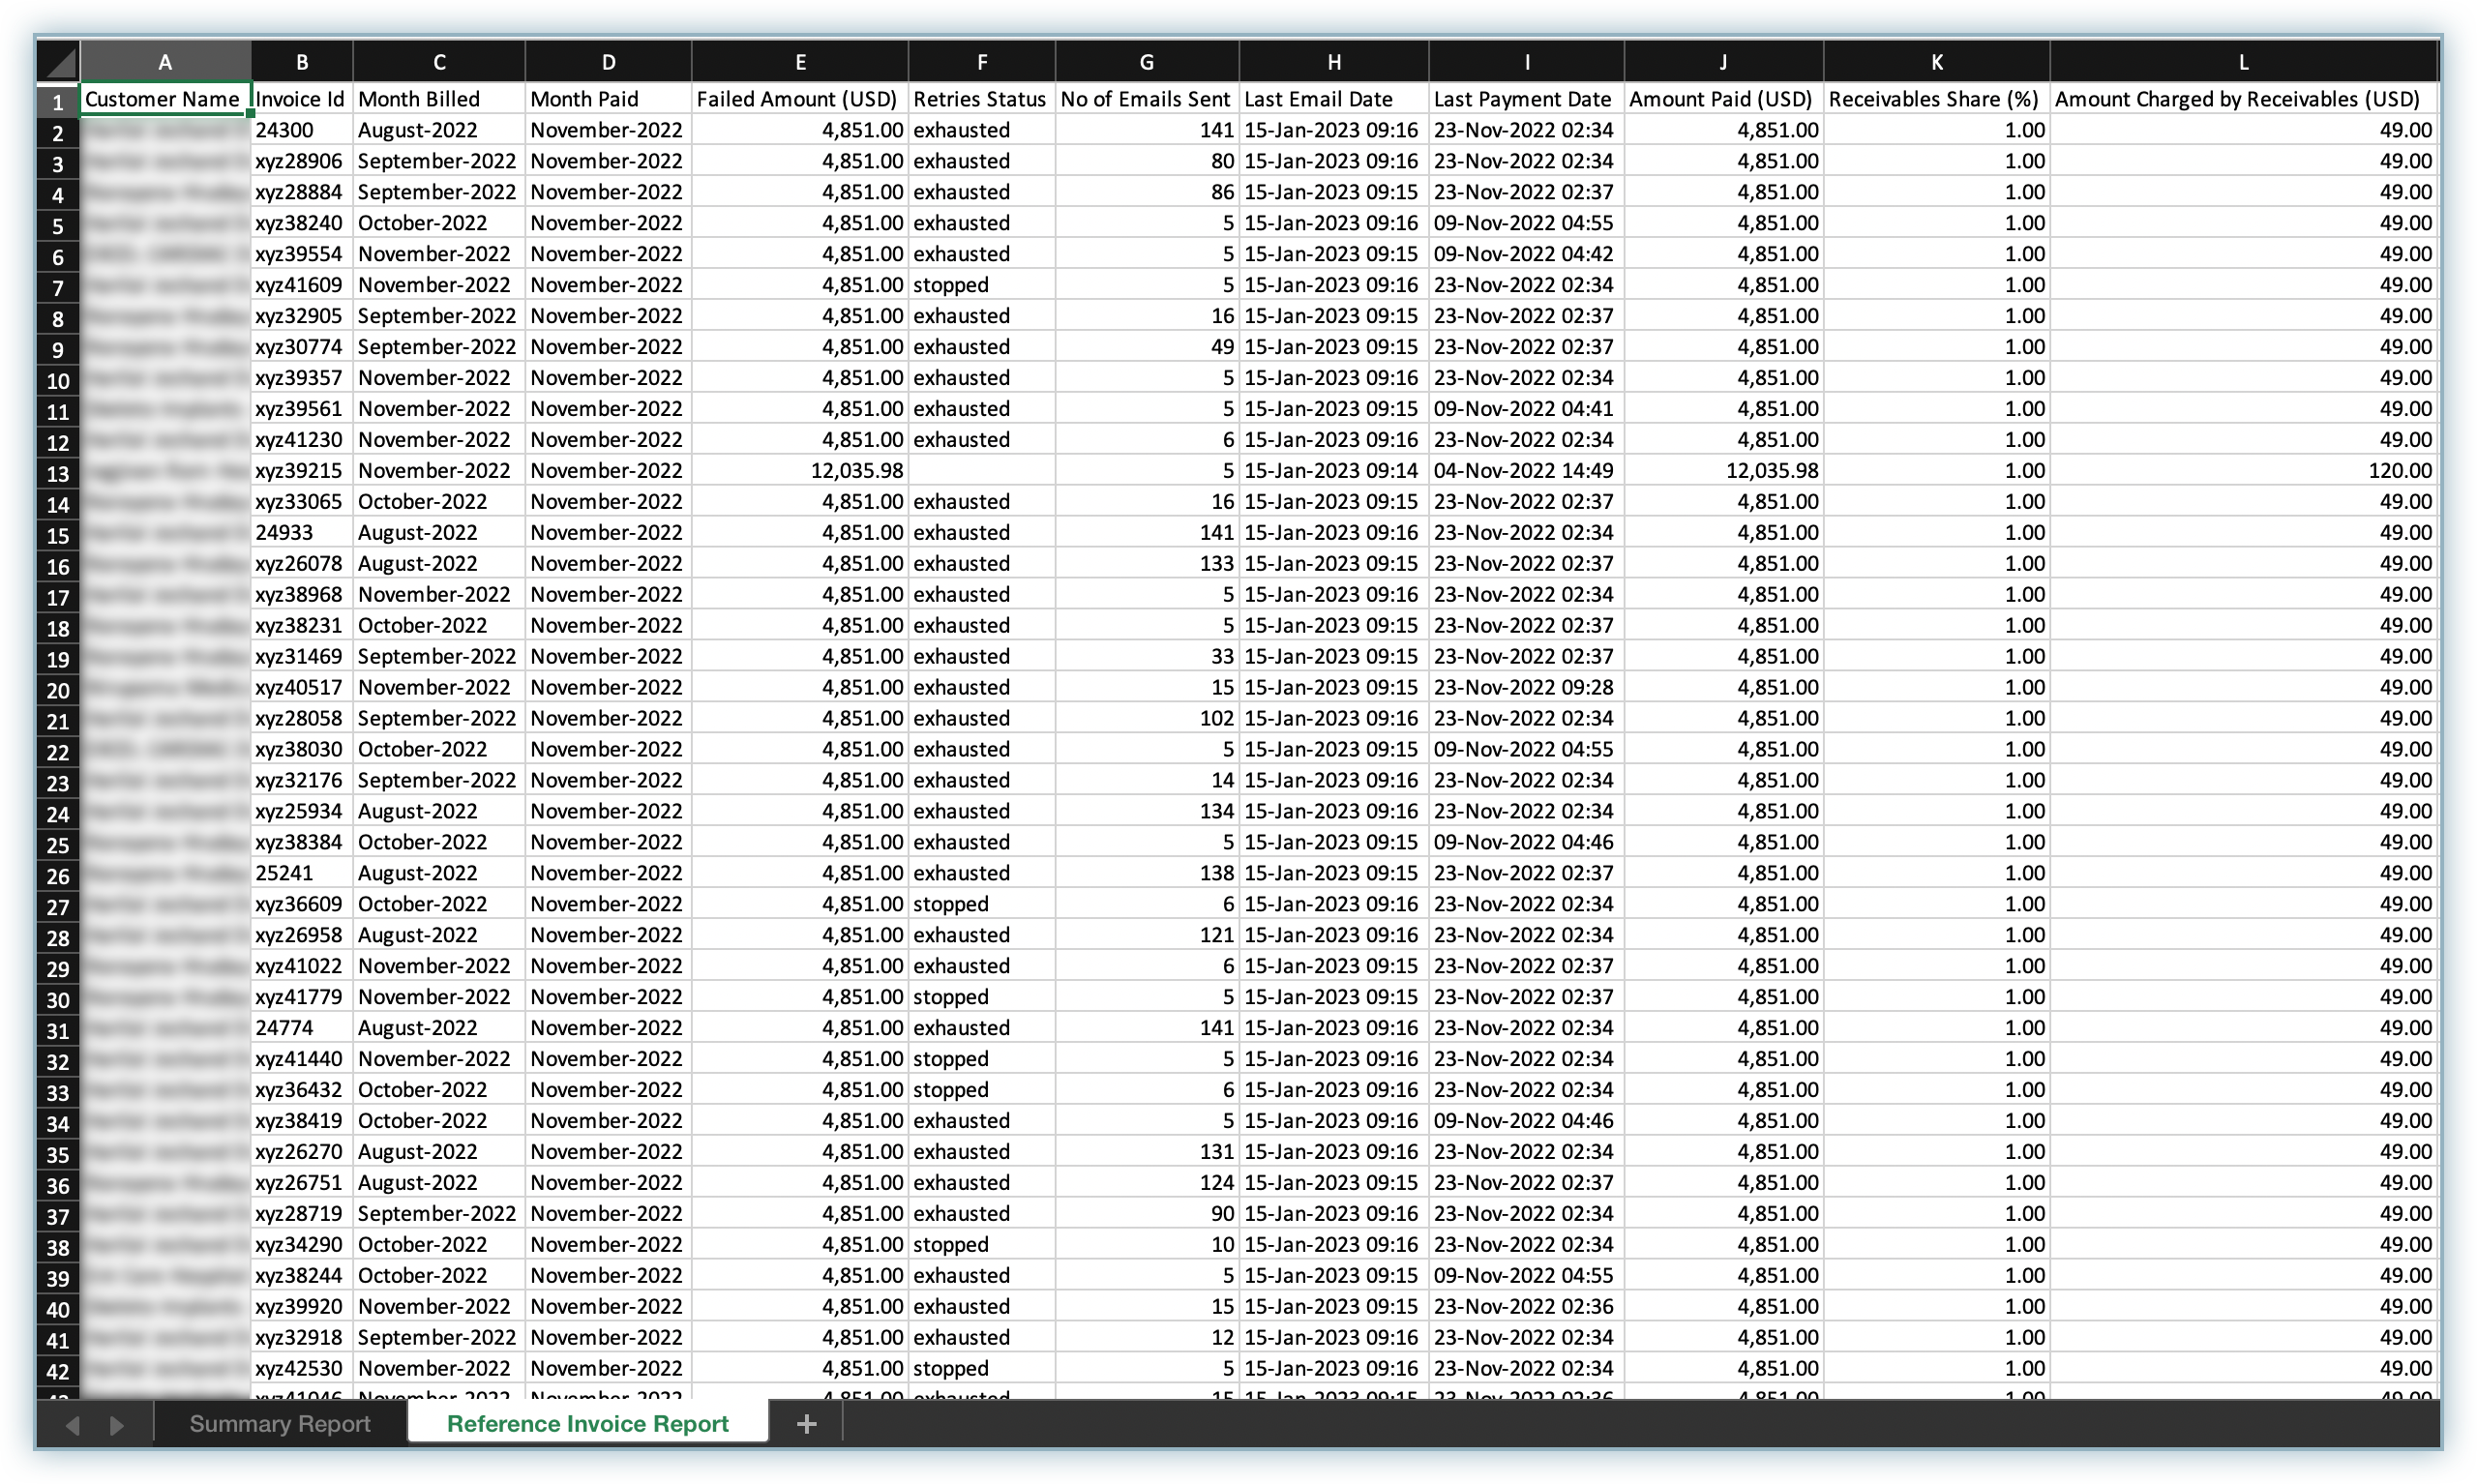
Reference Invoice Report
The second sheet under the report—Reference Invoice Report—contains all the customer and invoice-specific details in this report.
This report helps you find customer and invoice-specific details like Month Billed, Month Paid, Failed Amount, Last Payment Date, and more, which help you identify which customers you should engage with based on this report.
Was this article helpful?