Analyzing Standalone Selling Price
Overview
RevRec allows you to analyze the prices of your products and services via the SSP Analyzer functionality. The data derived by analyzing SSP can be used to explore the variability of sales prices in your sales orders. By examining the summary data and the histogram, you can gain insights into the pricing trends of your products.
Limitation
The SSP analyzer treats every product sold as individually sold, including the ones sold as part of the bundled products. Furthermore, credit notes are not considered, as they are not part of the original contract sale price.
Analyzing SSP
To initiate the SSP Analyzer process on your RevRec site, follow the steps:
-
Click Settings > Configure.
-
Under the Advanced section > Configure Accounting Rules, click Configure.
-
On the Accounting Rules page, click the ellipsis icon and click Run SSP Analyzer Job.
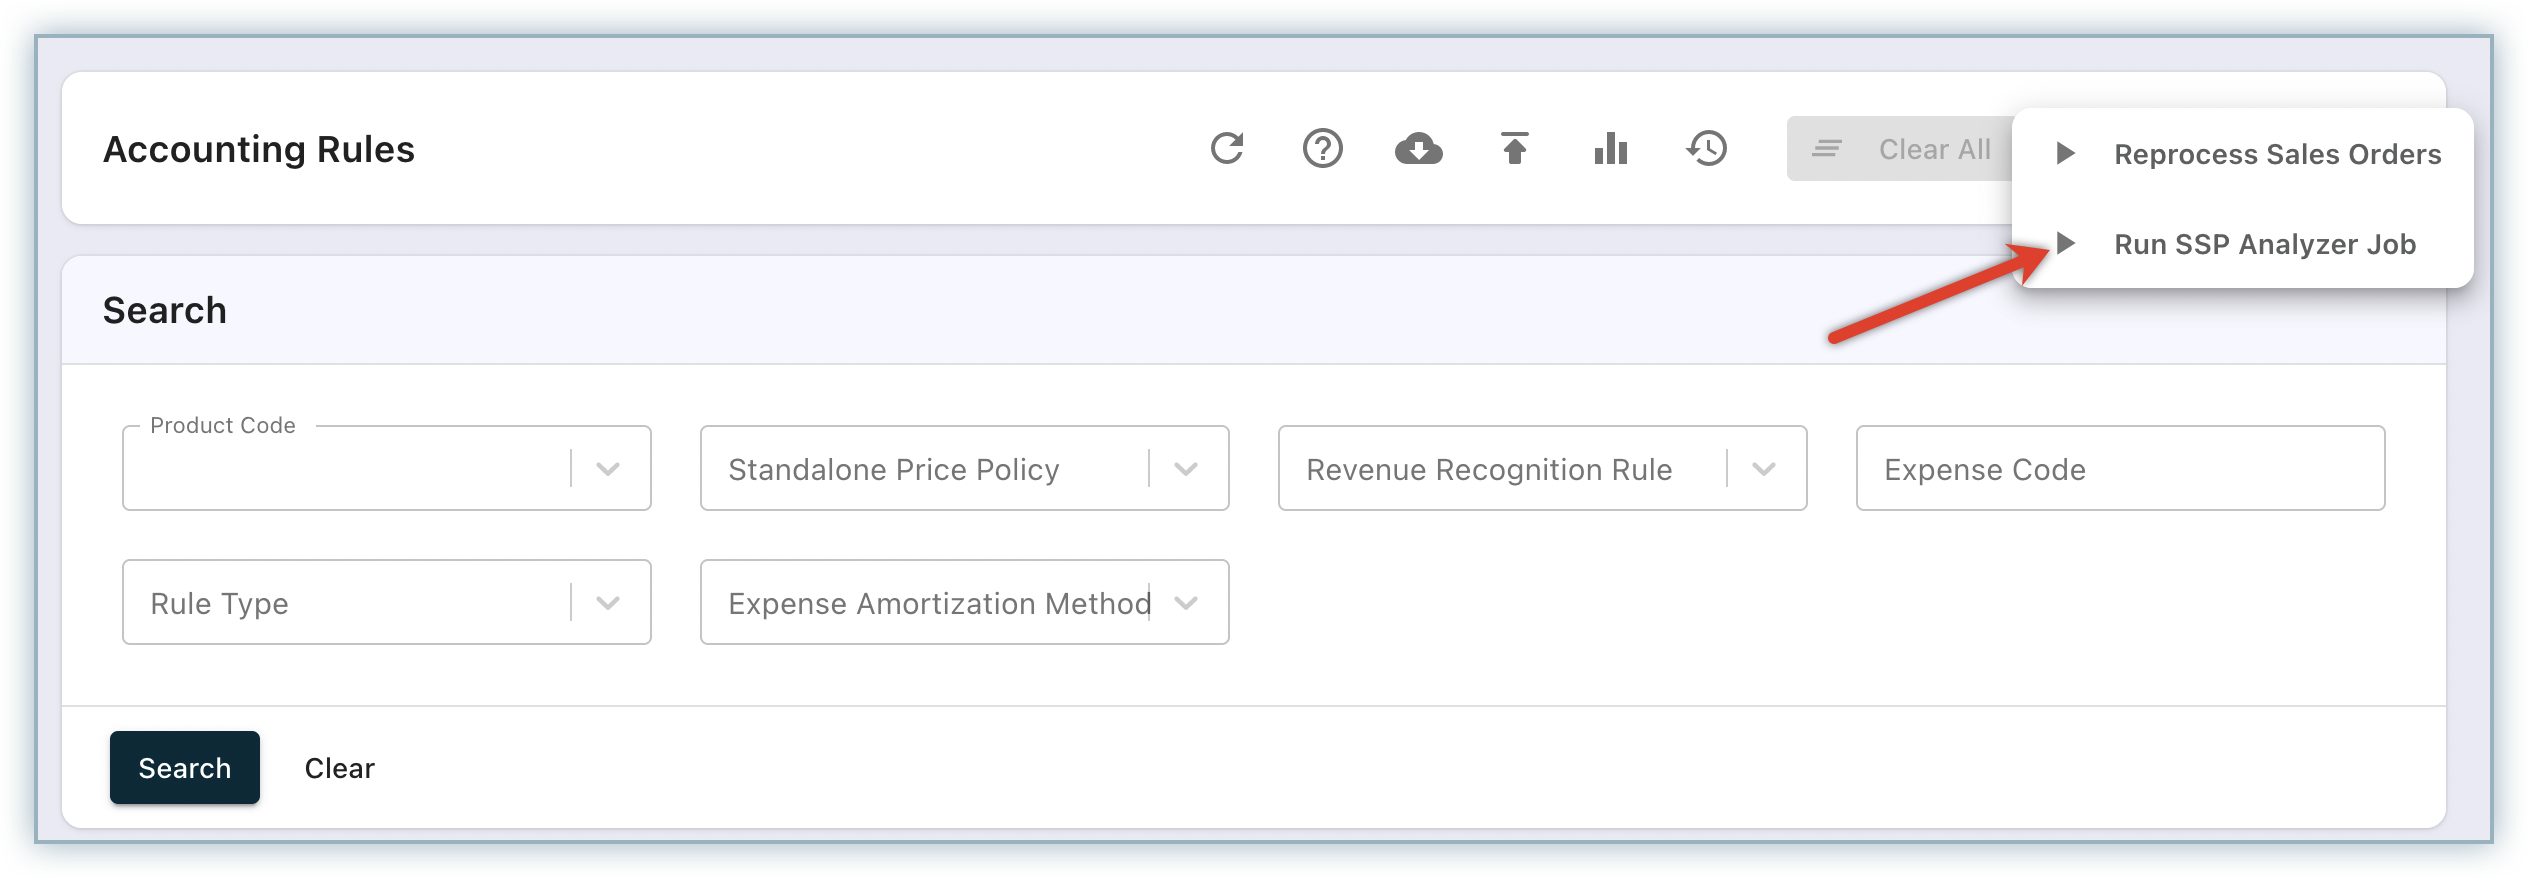
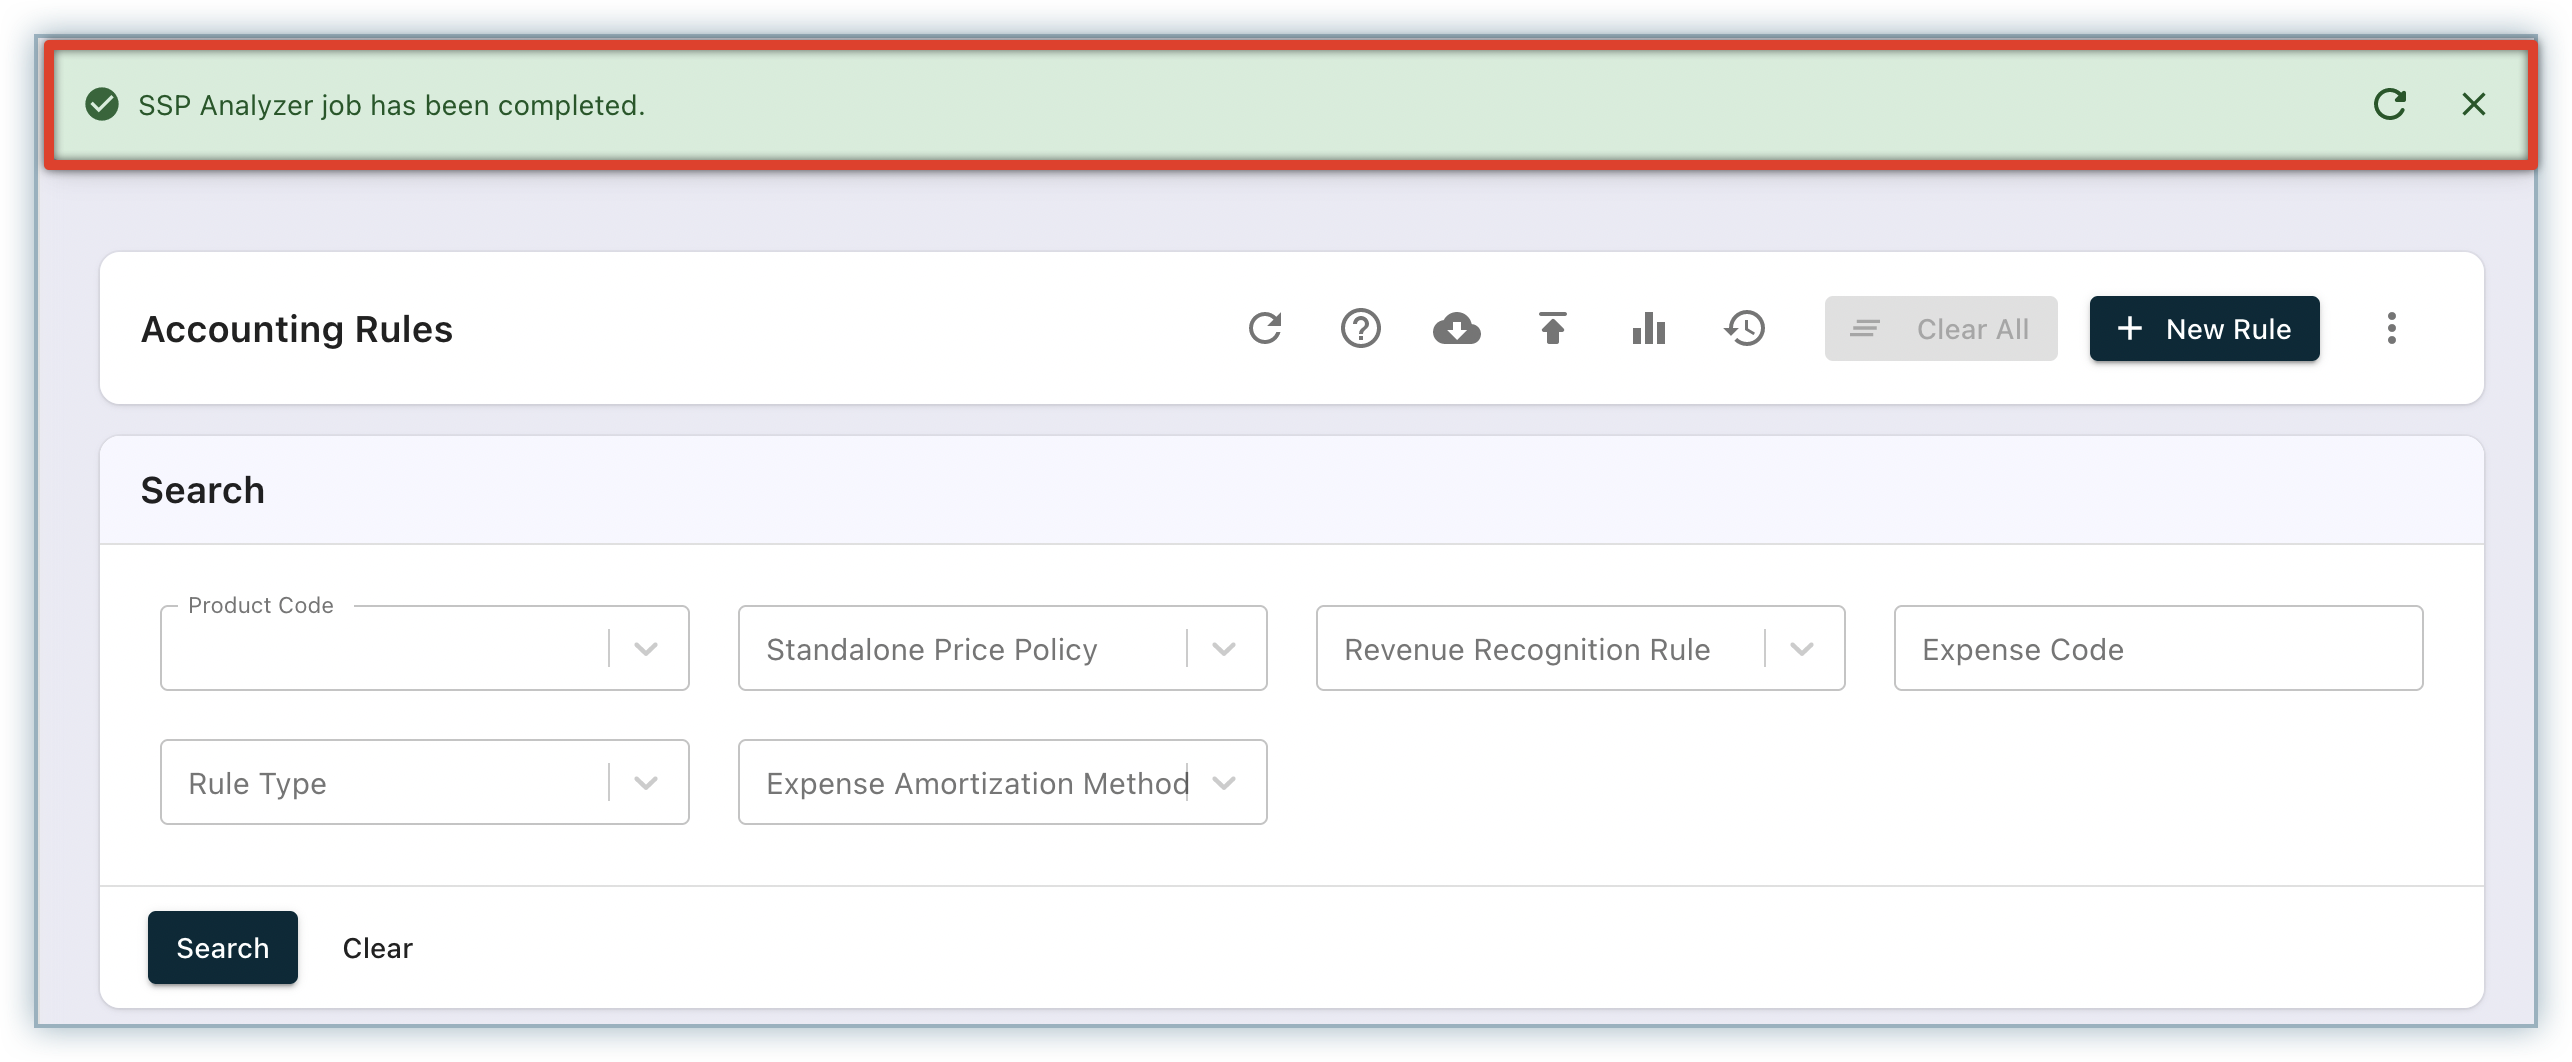
RevRec initiates the SSP Analyzer job and displays a banner conveying this message. Once the job is completed, a similar banner gets displayed.
-
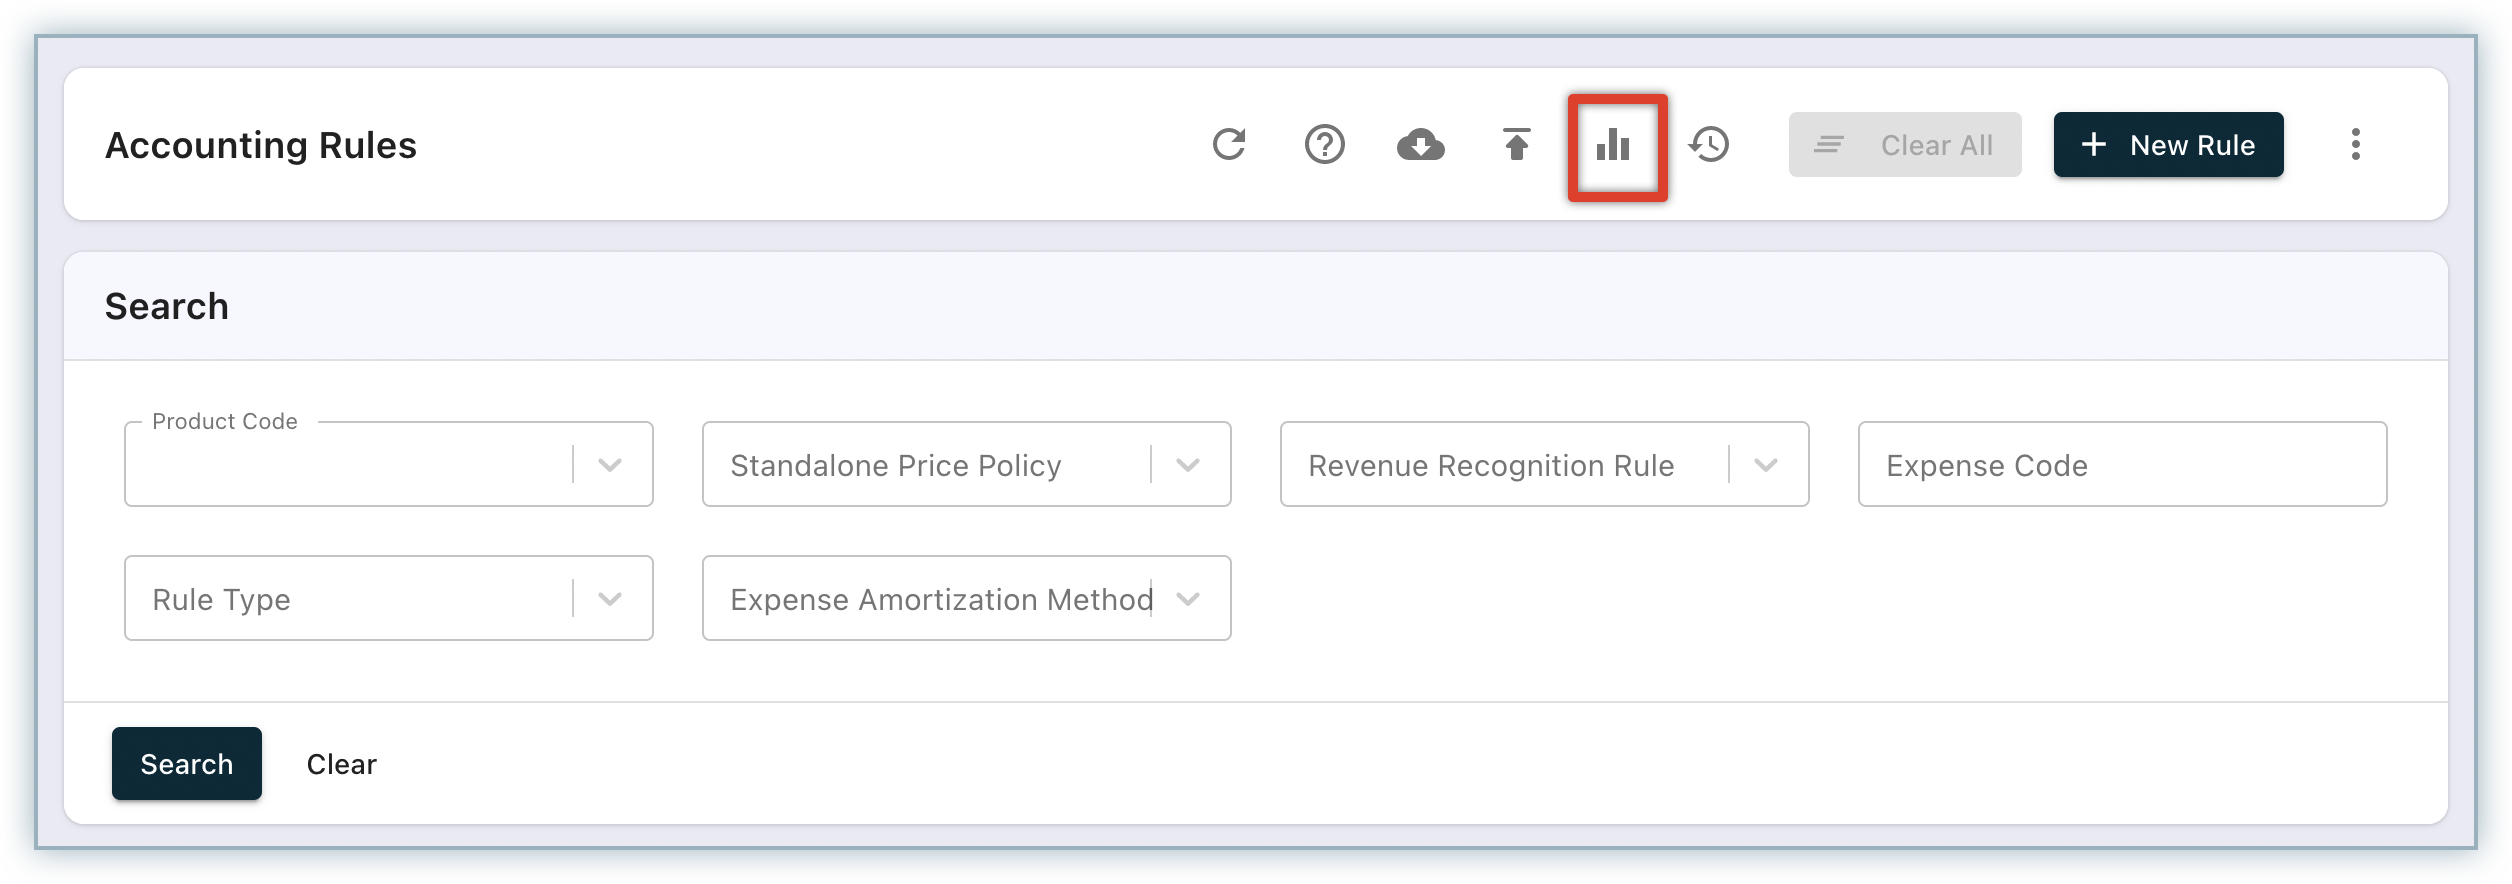
On the Accounting Rules page, click the Analyze SSP icon.
-
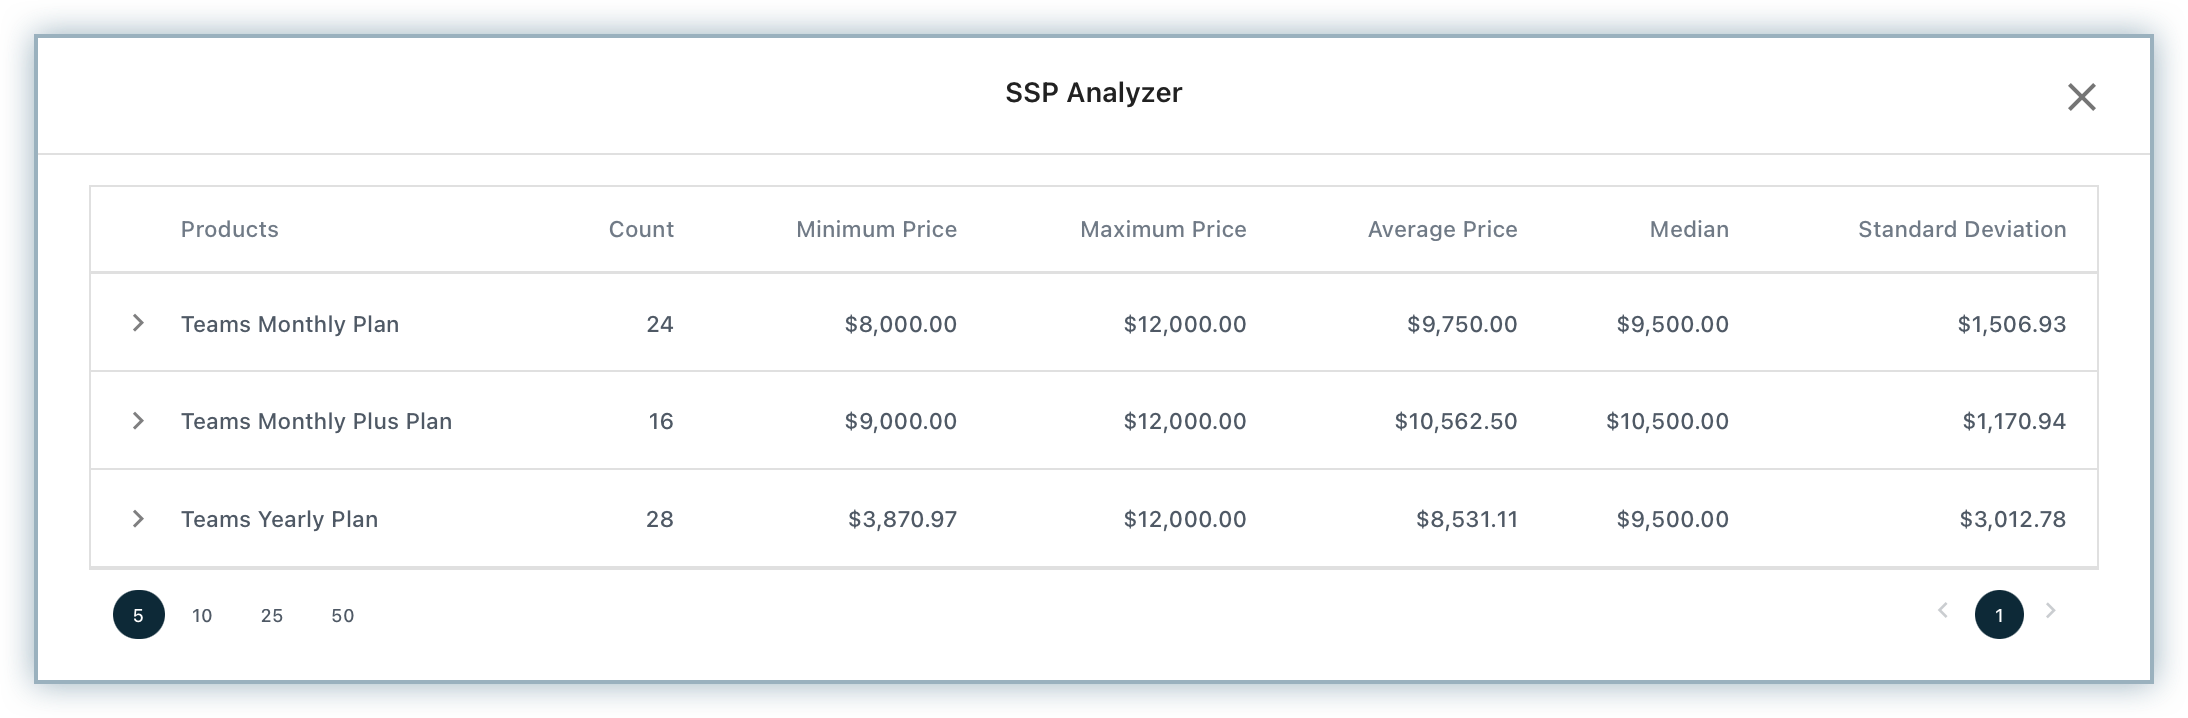
The SSP Analyzer popup displays the statistical data for each product. The analysis data is calculated using the normalized sales price for all active sales orders for the past six months. The statistical data includes the minimum, maximum, average, median, and standard deviation values for each product.
-
Click the expand icon to view histogram for each product.
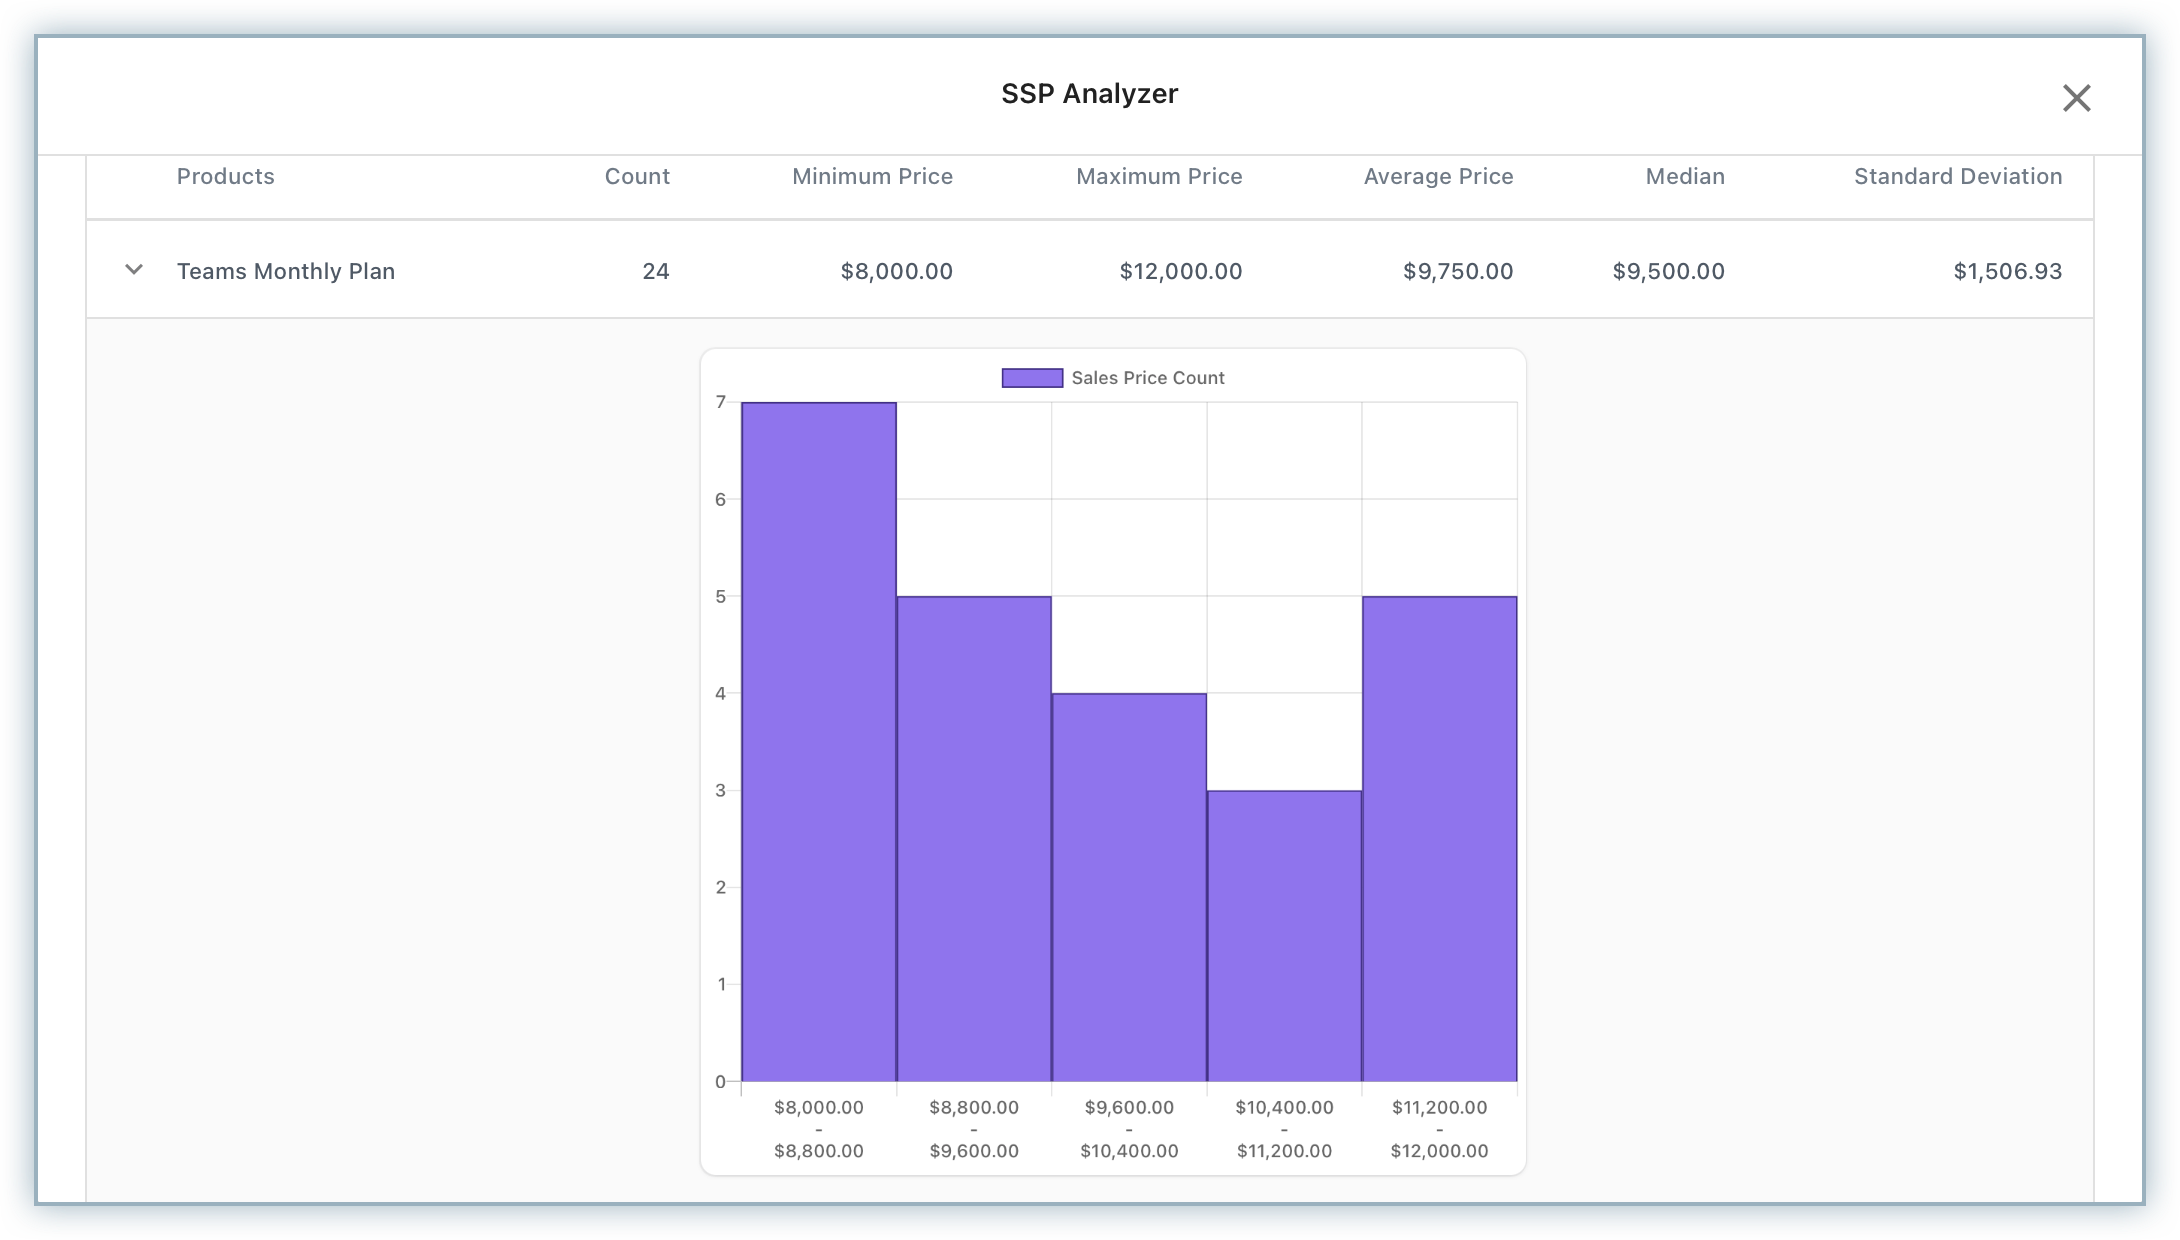
The histogram for each product is generated with uniform bin widths, calculated by taking the difference between the maximum and minimum normalized sales prices and then generating five equal fixed bins from it. The X-axis of the histogram represents the ranges and the Y-axis represents the normalized sales price count.
Note:
Normalized sales price is a pricing adjustment technique that considers the sales duration in order to adjust the sales price for any product. For example, if the price of a product is $1200 for a full year, and the contract is for 3 months, then the normalized price would be $300 for 3 months.
Example
Let's look at an example. Consider two product codes CRM and Workflow, with the following data:
| Product | Count | Min Price | Max Price | Bin Width (Formula: (Max - Min)/5) |
|---|---|---|---|---|
| CRM | 82 | $50 | $100 | $10 |
| Workflow | 556 | $60 | $120 | $12 |
RevRec computes the five ranges by adding bin width to min price.
| Product | Range 1 | Range 2 | Range 3 | Range 4 | Range 5 |
|---|---|---|---|---|---|
| CRM | $50 to $60 | $60 to $70 | $70 to $80 | $80 to $90 | $90 to $100 |
| Workflow | $60 to $72 | $72 to $84 | $84 to $96 | $96 to $108 | $108 to $120 |
Articles & FAQs
Was this article helpful?