Getting Around RevRec Premium
Introduction
To get the most out of RevRec Premium, it’s important to understand how to navigate and utilize its key features. This section walks you through the main areas of the application, including syncing data, exploring billing records, and generating reports.
Syncing the Data
You can sync data from your billing system into RevRec Premium with just a few clicks.
- Log in to your RevRec Premium site.
- Click Sync > Connector > Chargebee > Run Sync.
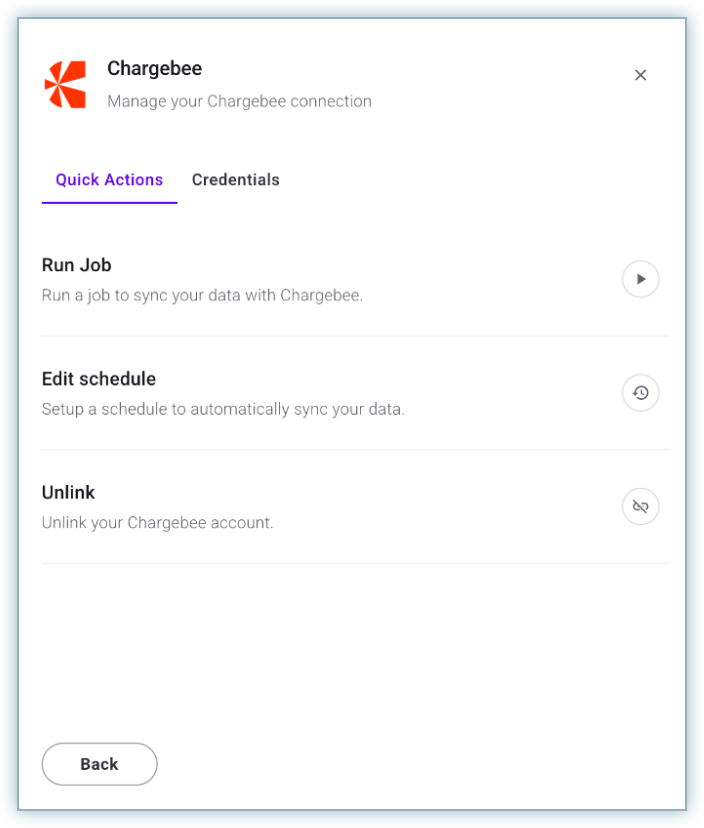
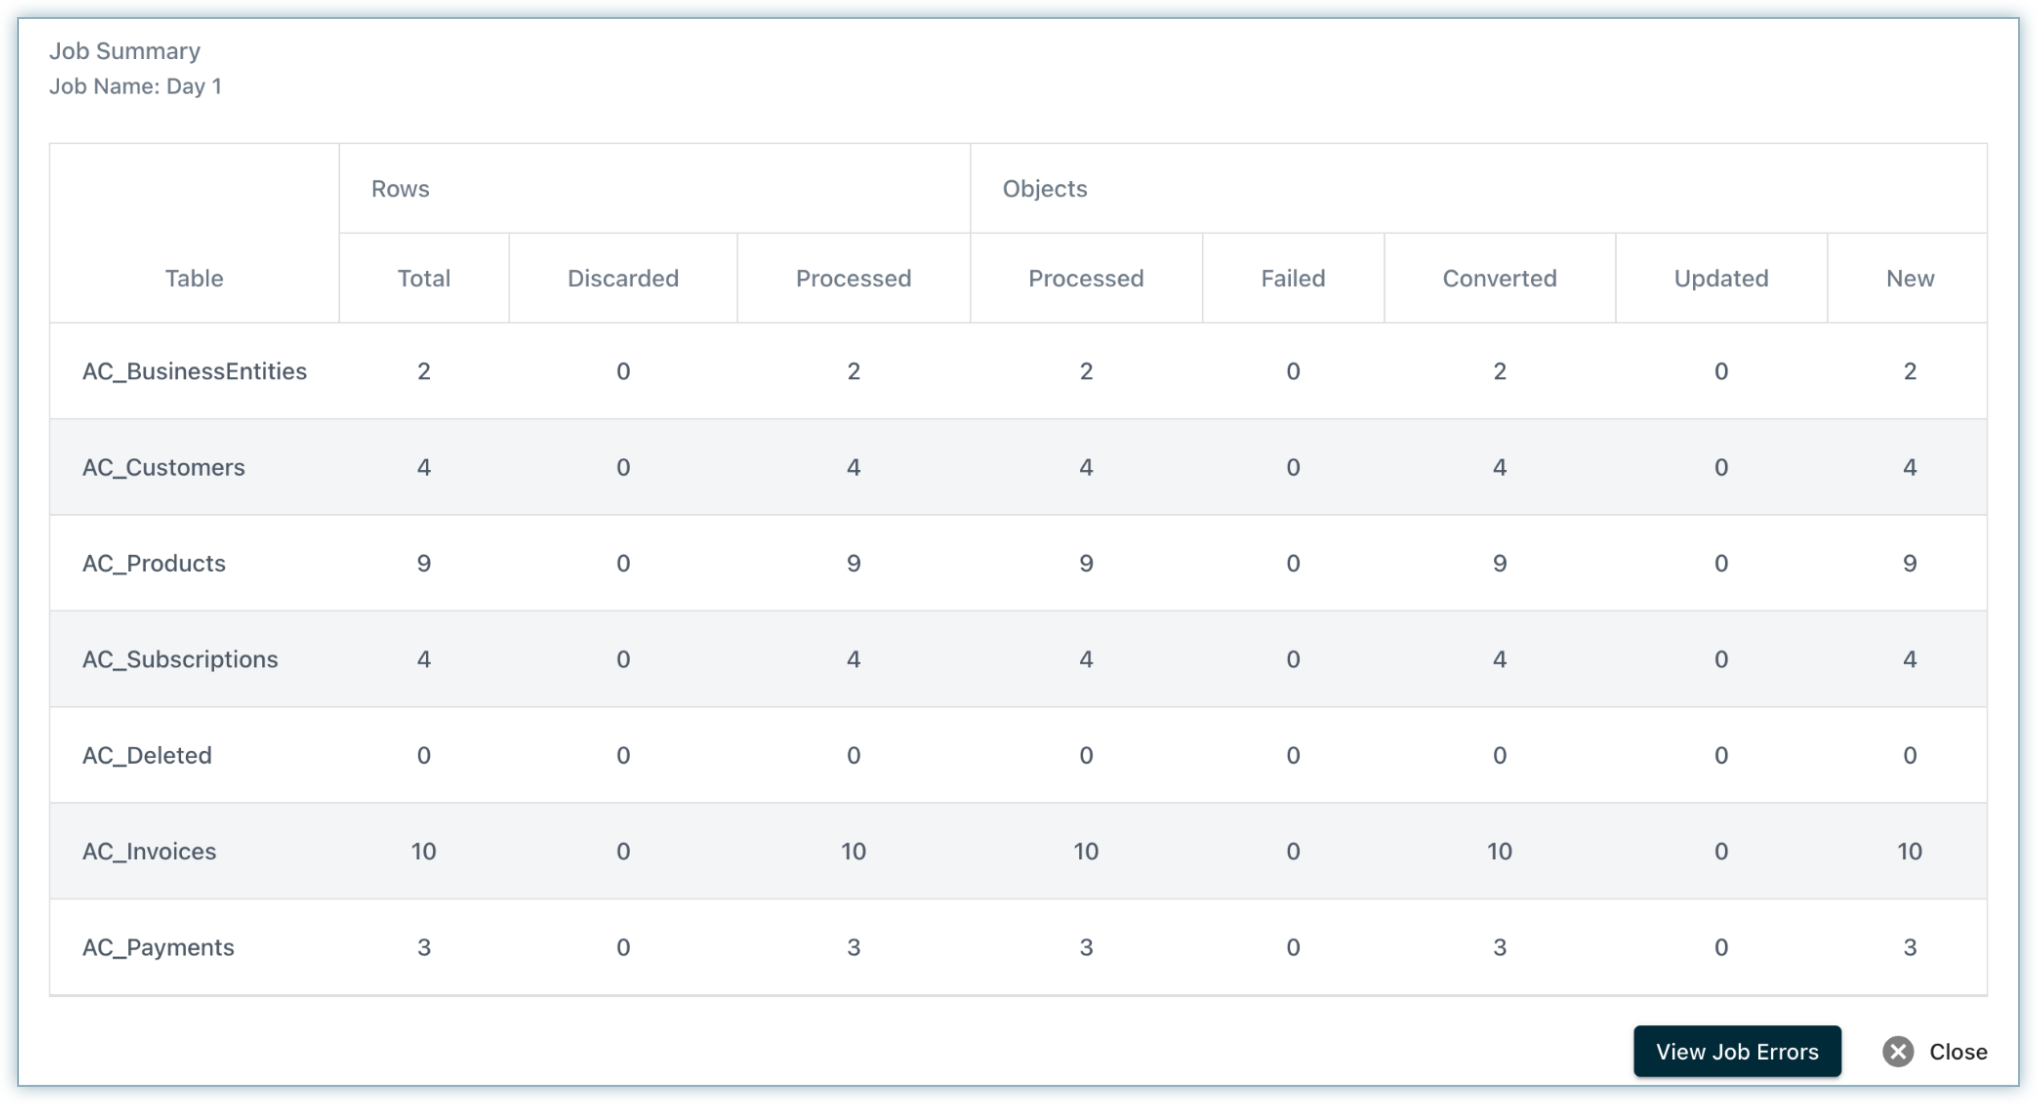
- Once the sync is complete, a Job Summary appears with the details of the run.
Home - Dashboard
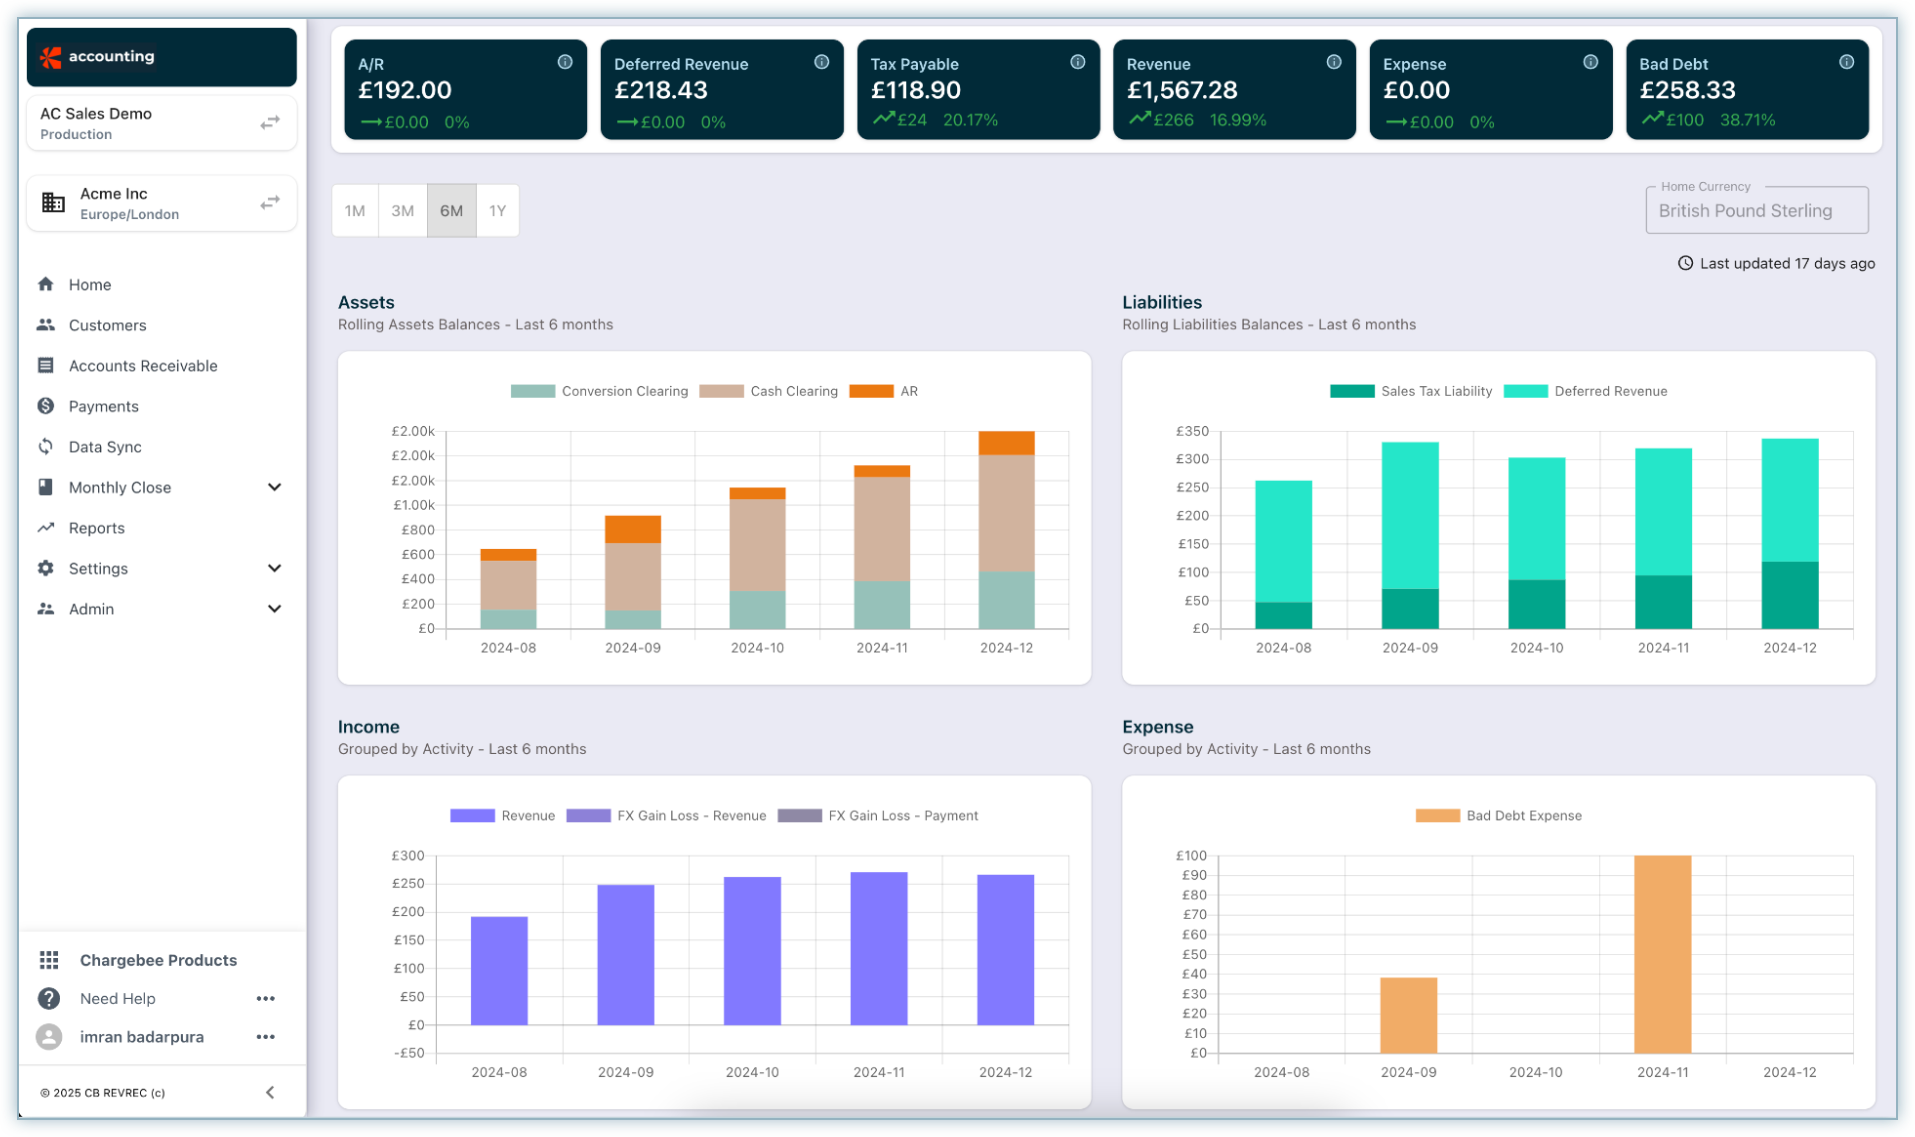
After your data is synced from the Chargebee Billing site, the Home Dashboard graphs and widgets are populated, providing a consolidated view of your organization’s financial data and performance trends.
Widgets
The widgets at the top of the dashboard highlight key financial indicators at a glance:
-
Accounts Receivable (A/R): Total accounts receivable from all billing and payment activities as of today.
-
Deferred Revenue: Total unearned revenue balance from all billing activities as of today.
-
Tax Payable: Total sales tax payable from billings as of today.
-
Revenue: Total revenue earned from all active sales orders, including prior period adjustments up to the last closed accounting period.
-
Expense: Contract costs and other recognized expenses, including prior period adjustments up to the last closed accounting period.
-
Bad Debt: Total bad debt expenses recognized for credit notes up to the last closed accounting period, based on the expense reason code.
Graphs
-
Graphs help you visualize balances and activity across four different account categories:
-
Assets: Displays rolling balances for general ledger (GL) accounts categorized as Assets. (e.g., Cash Clearing, Accounts Receivable).
-
Liabilities: Displays rolling balances for GL accounts categorized as Liabilities. (e.g., Sales Tax Liability, Deferred Revenue).
-
Income: Displays account activity for GL accounts categorized as Income. (e.g., Revenue, Foreign Exchange Gain/Loss).
-
Expense: Displays account activity for GL accounts categorized as Expenses. (e.g., Bad Debt, Gateway/Processing Fees).
Drill-Down and Export
You can drill into the finer details and extract insights with these options:
-
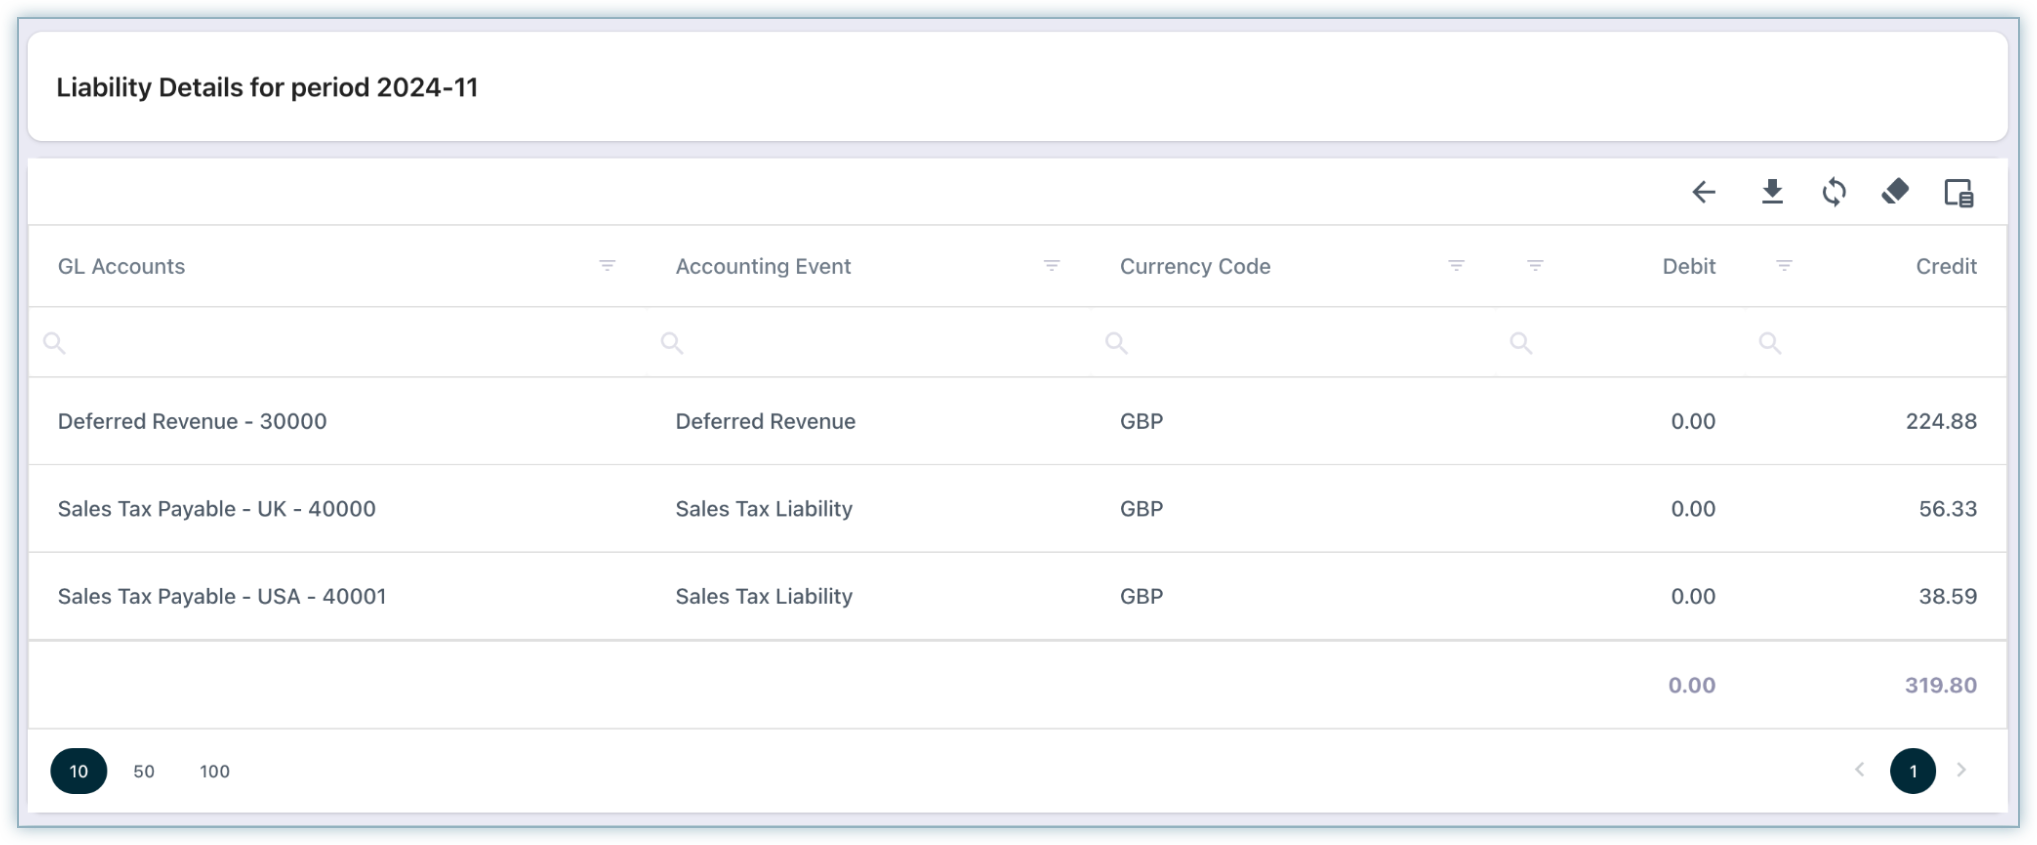
Click a graph bar to open a grid view of transactions.
-
Export the results to Excel for further analysis.
Customers
The Customers section provides a centralized view of subscriber details and related financial instruments.
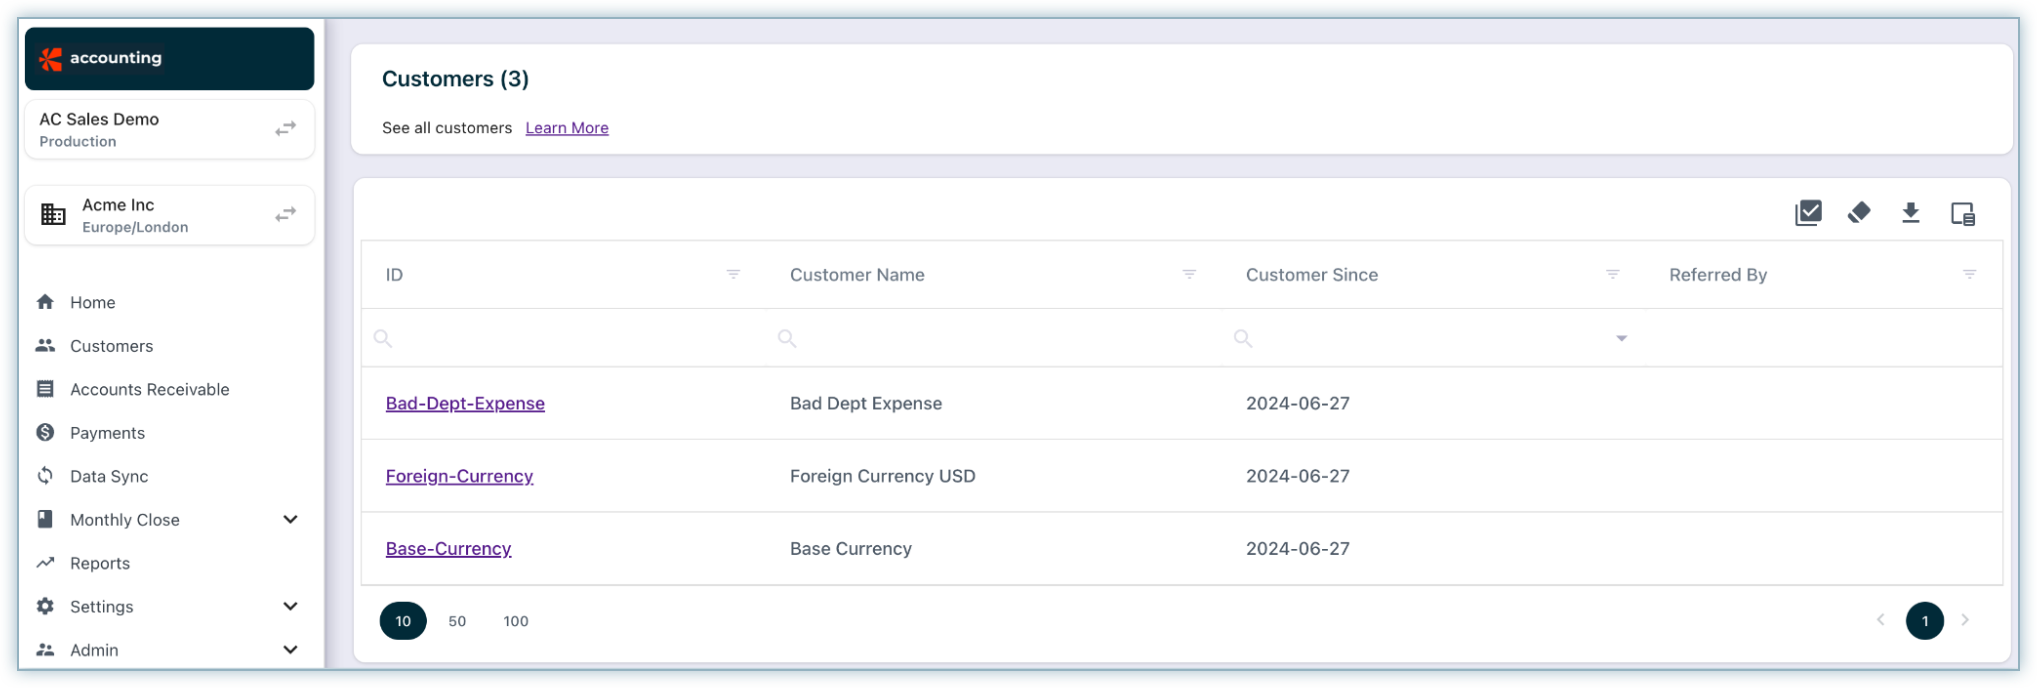
Clicking a Customer Name opens the details page with subscription, billing, and payment information.
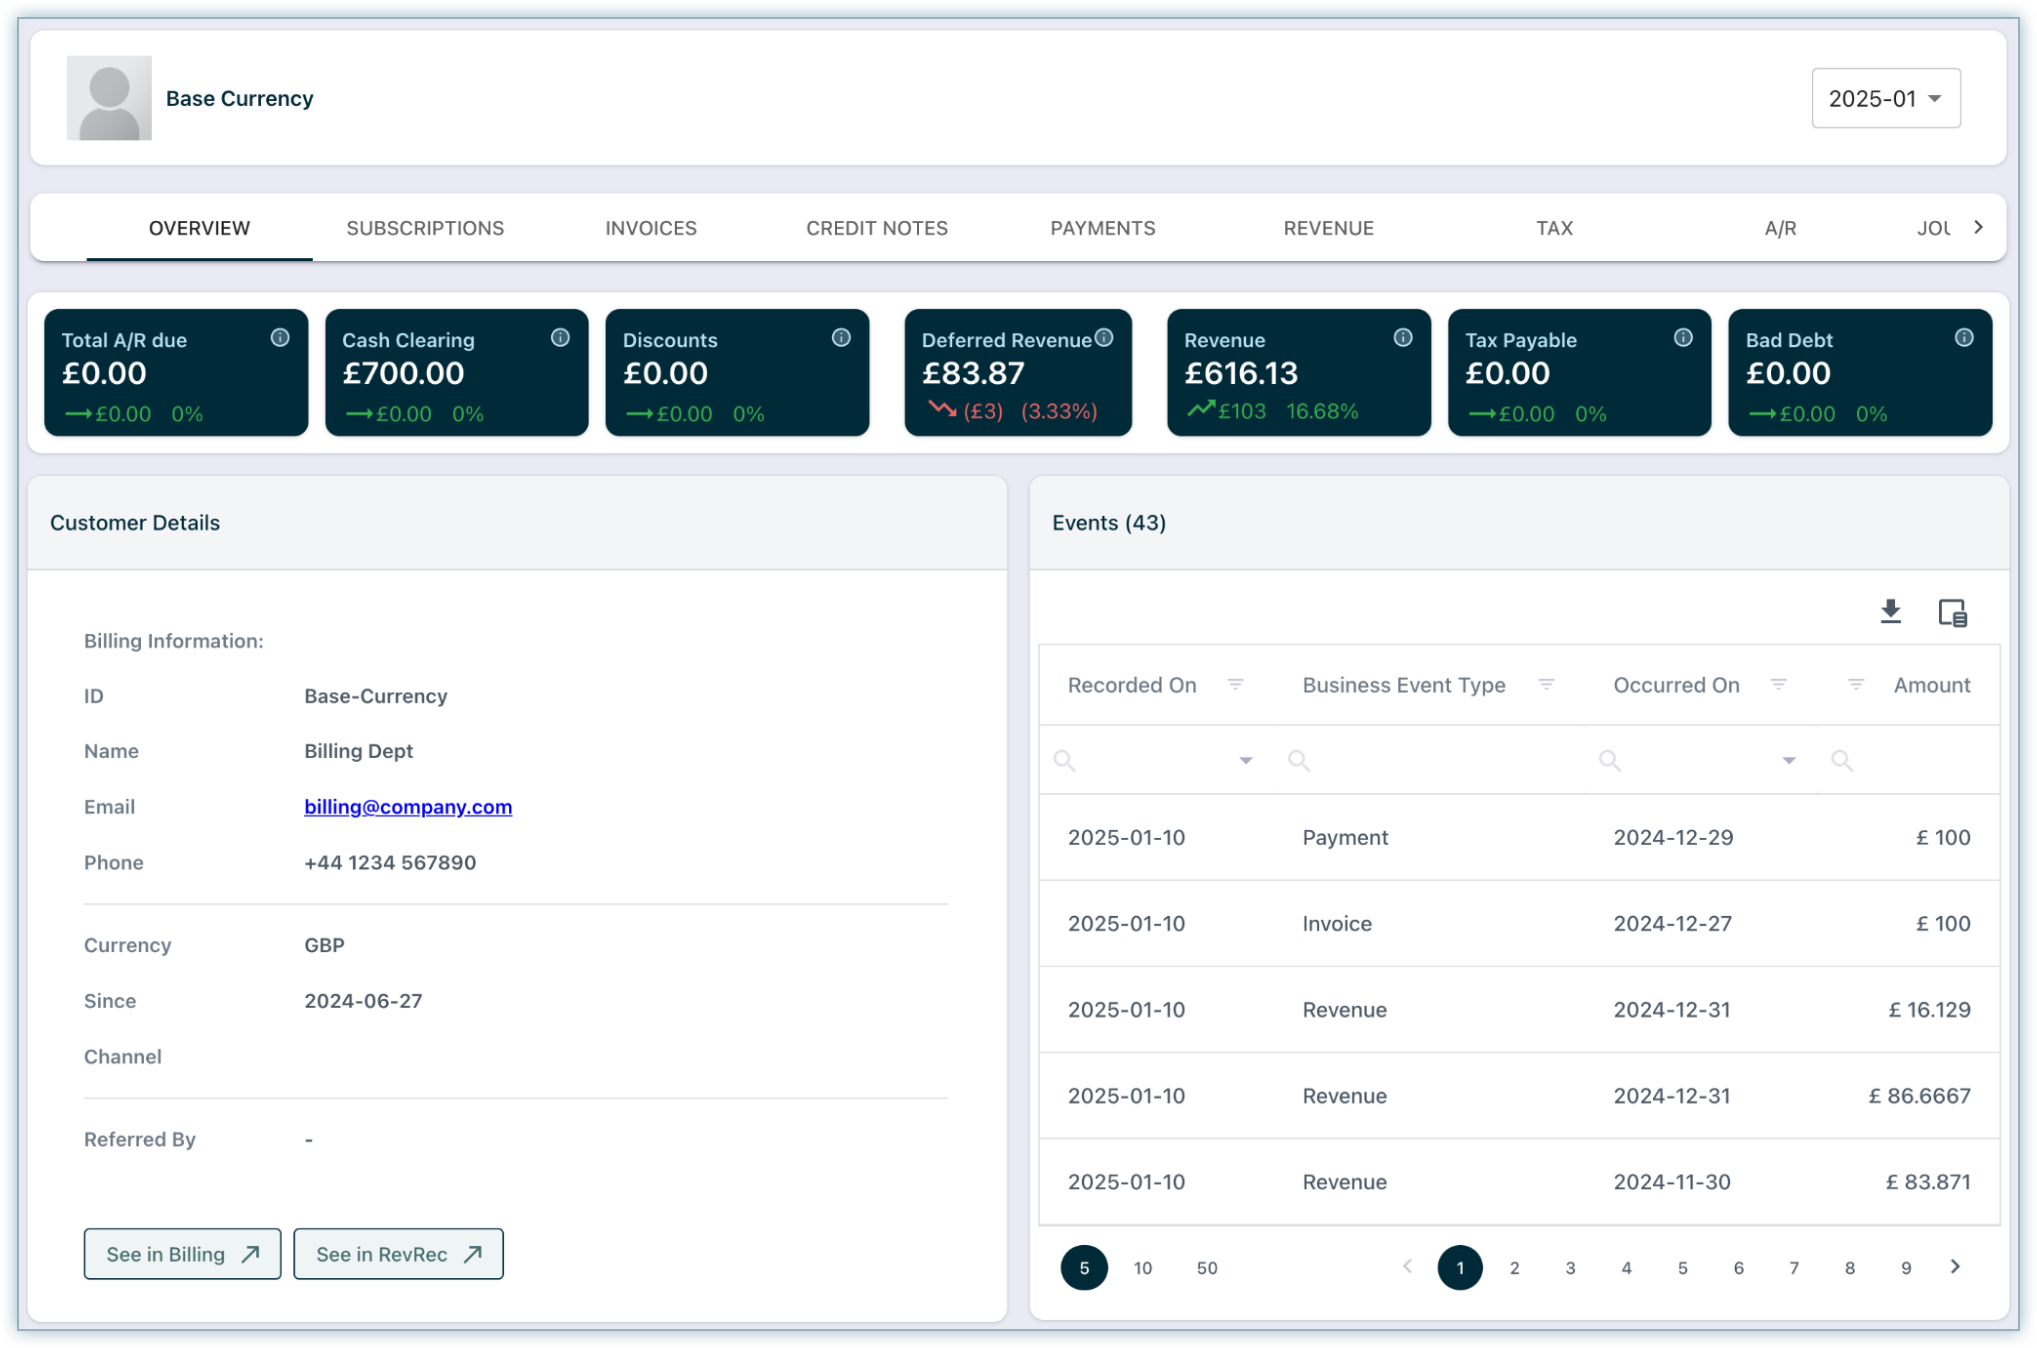
Overview
The Overview tab summarizes customer information in easy-to-digest cards:
-
Balances Widget Bar: Displays up-to-date balances and period-over-period changes.
-
Customer Details Card: Highlights essential customer details for quick access.
-
Events Card: Lists all customer events for easy tracking.
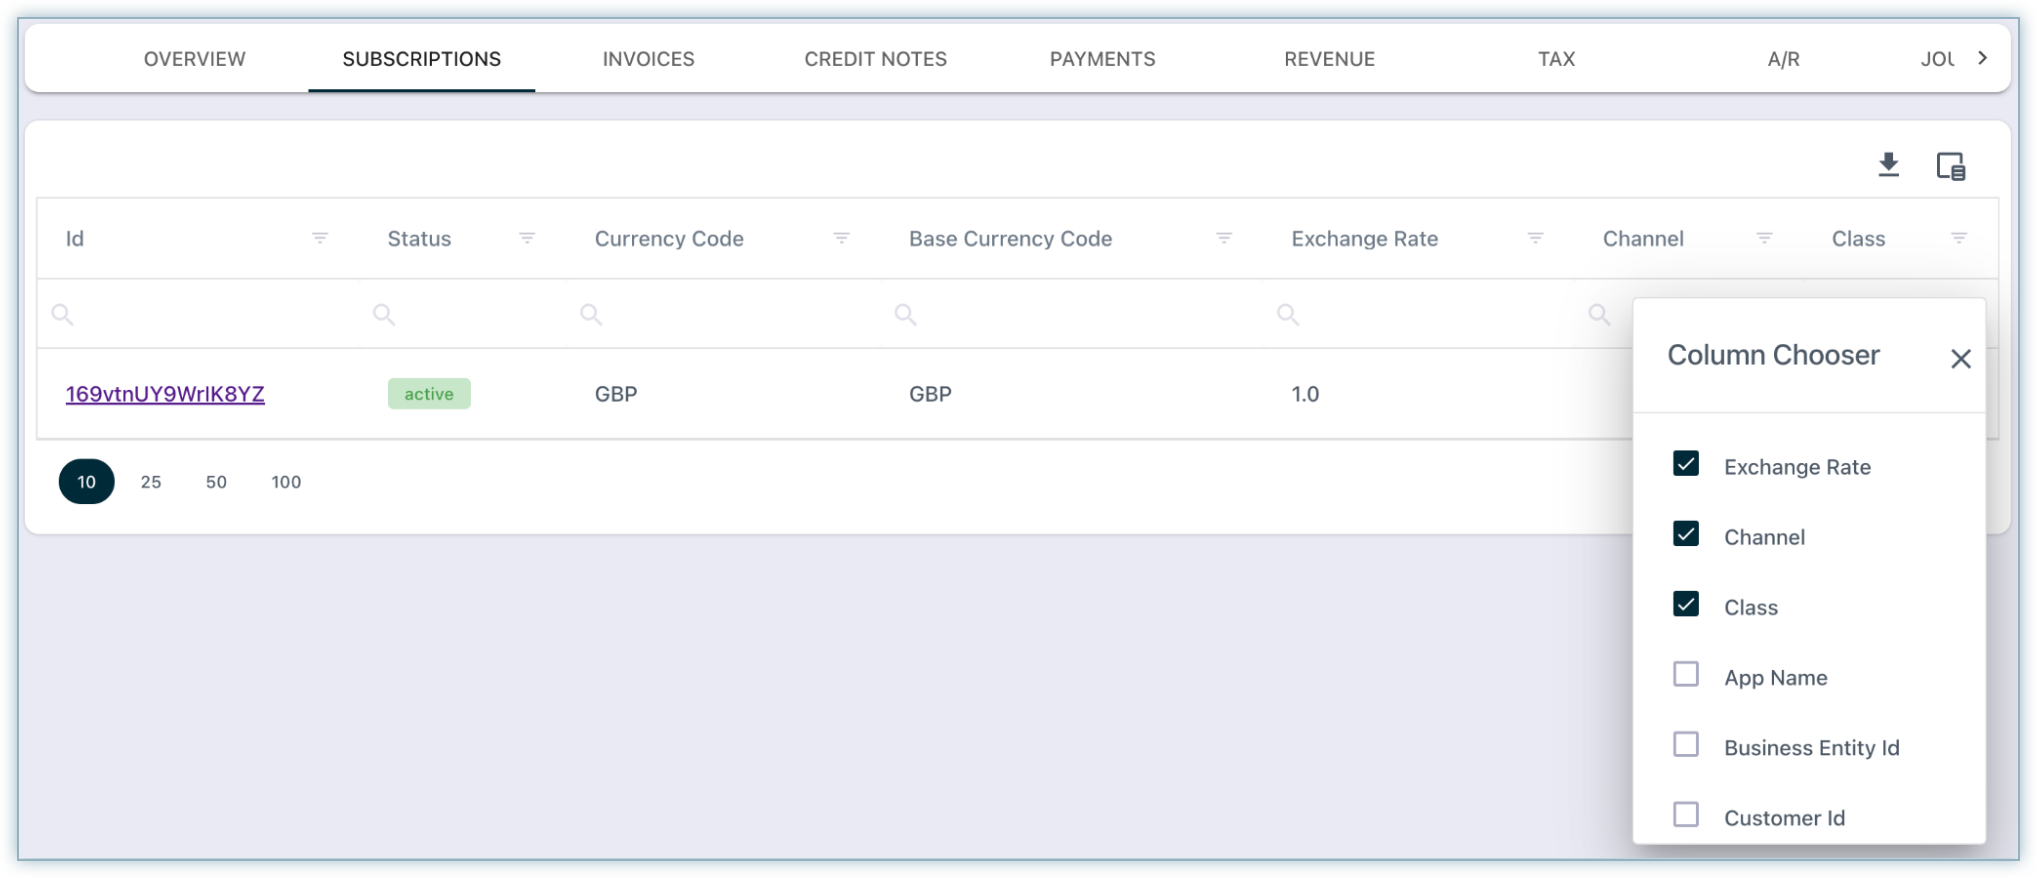
Subscriptions
In the Subscriptions tab, you can view all subscriptions and related information.
- Clicking the Subscription ID takes you to the respective subscription page of the customer on the Billing site.
- You can add or remove fields from this grid using the column chooser and export the data for analysis.
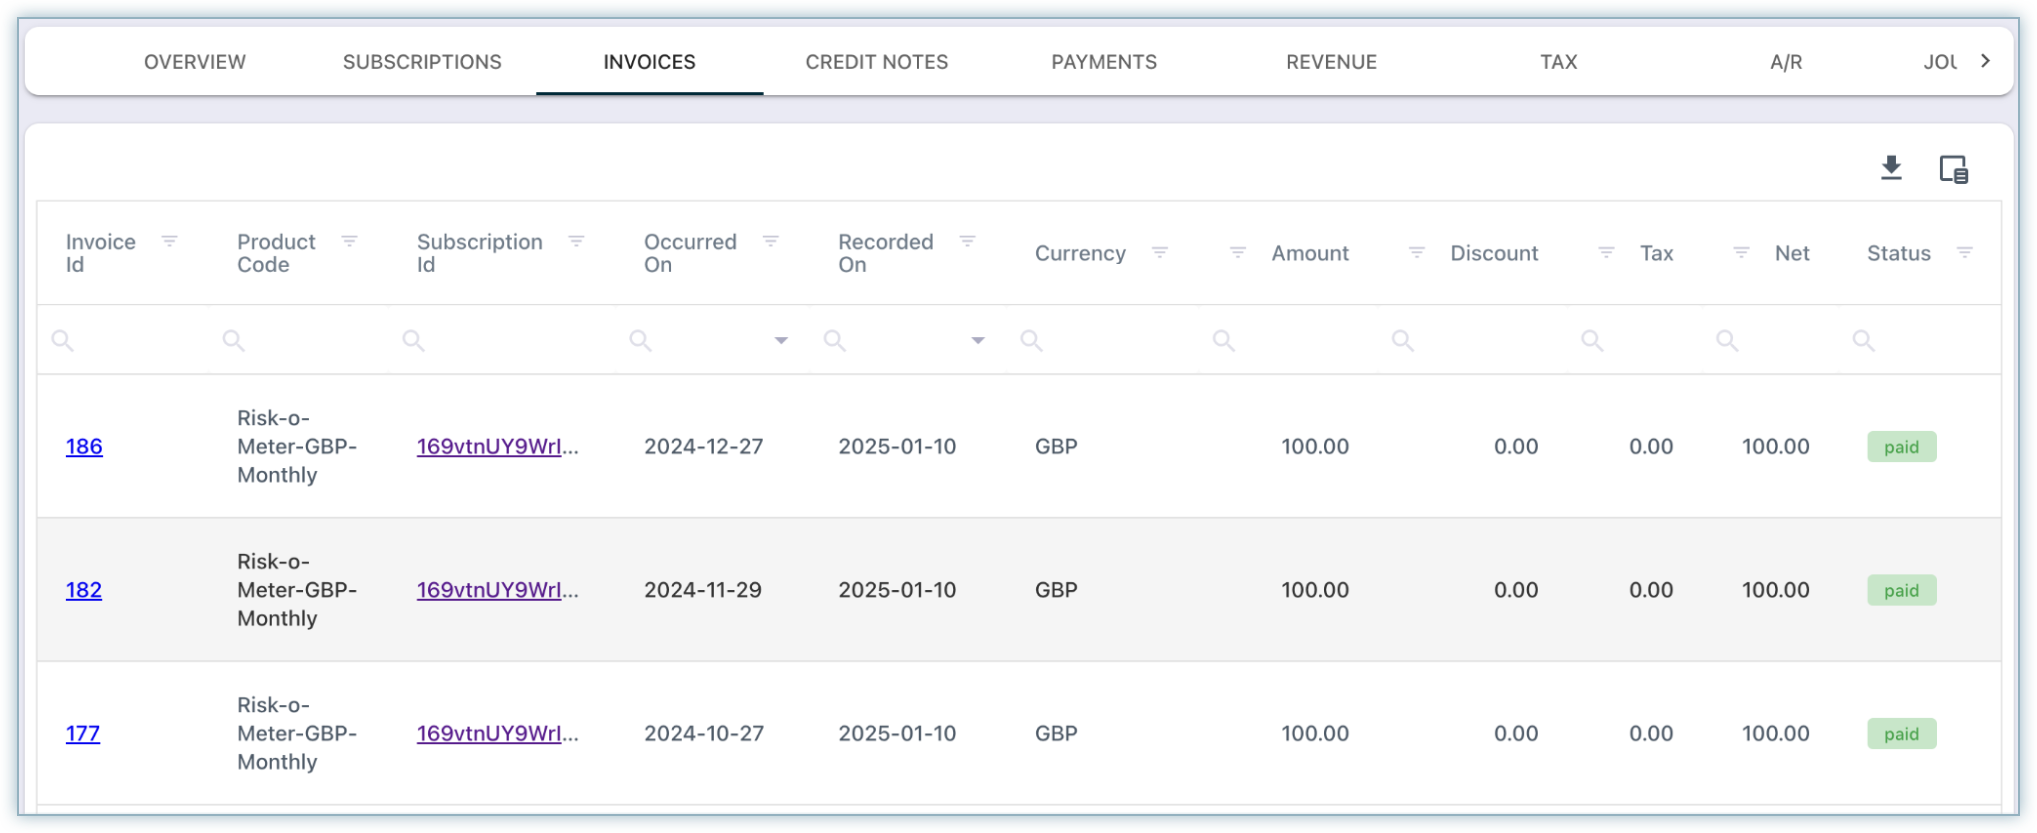
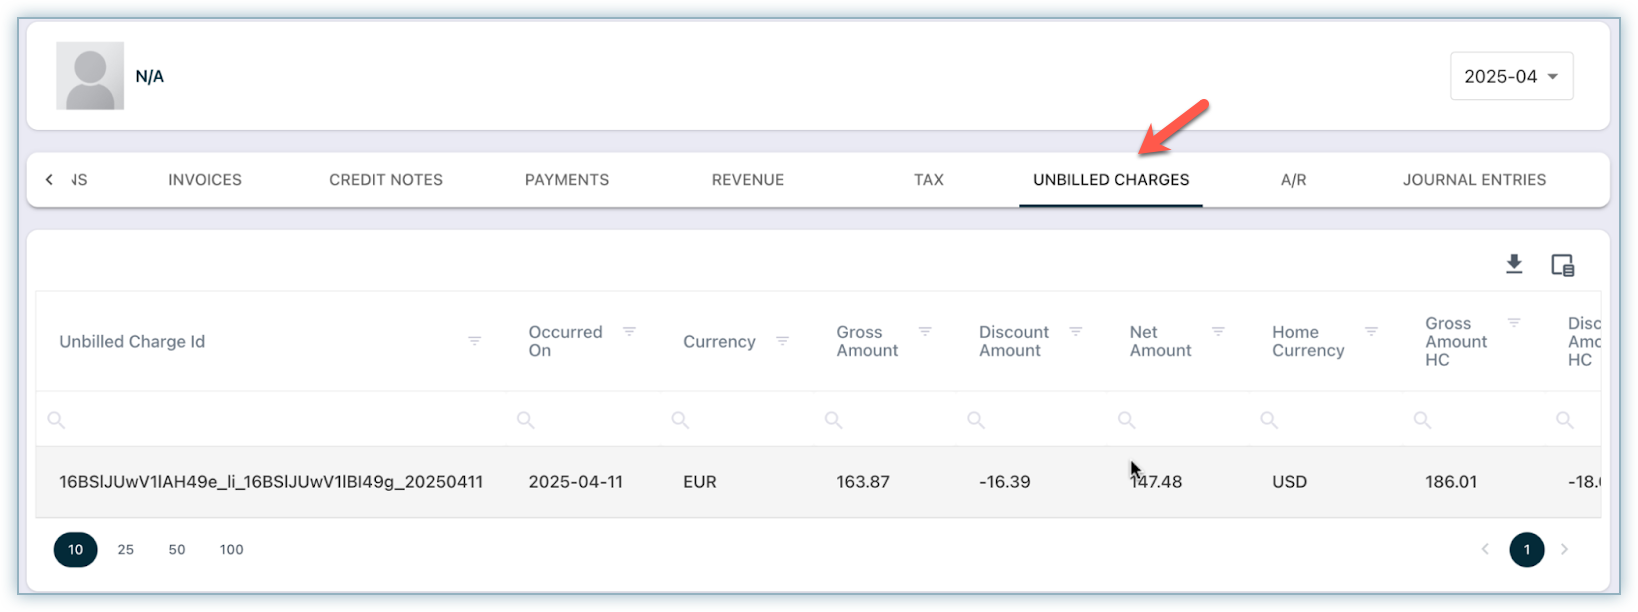
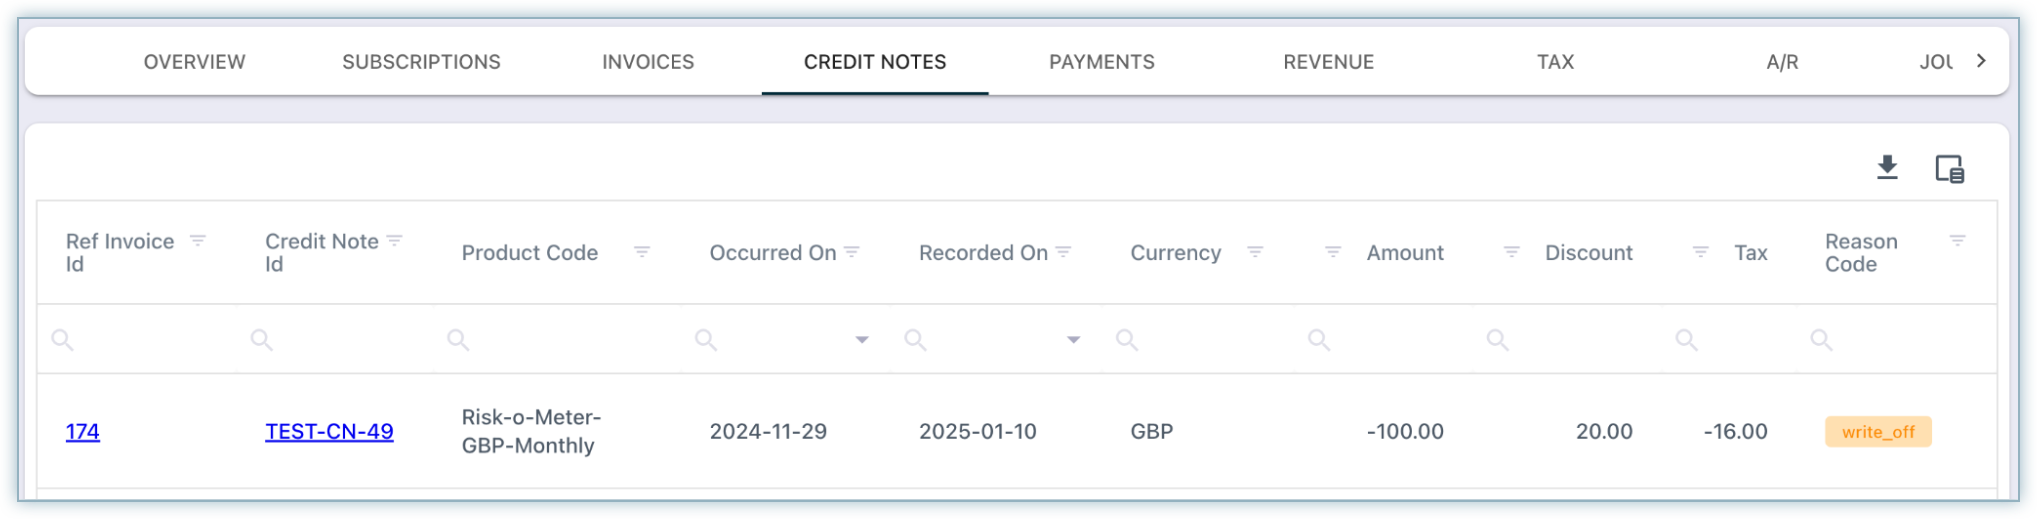
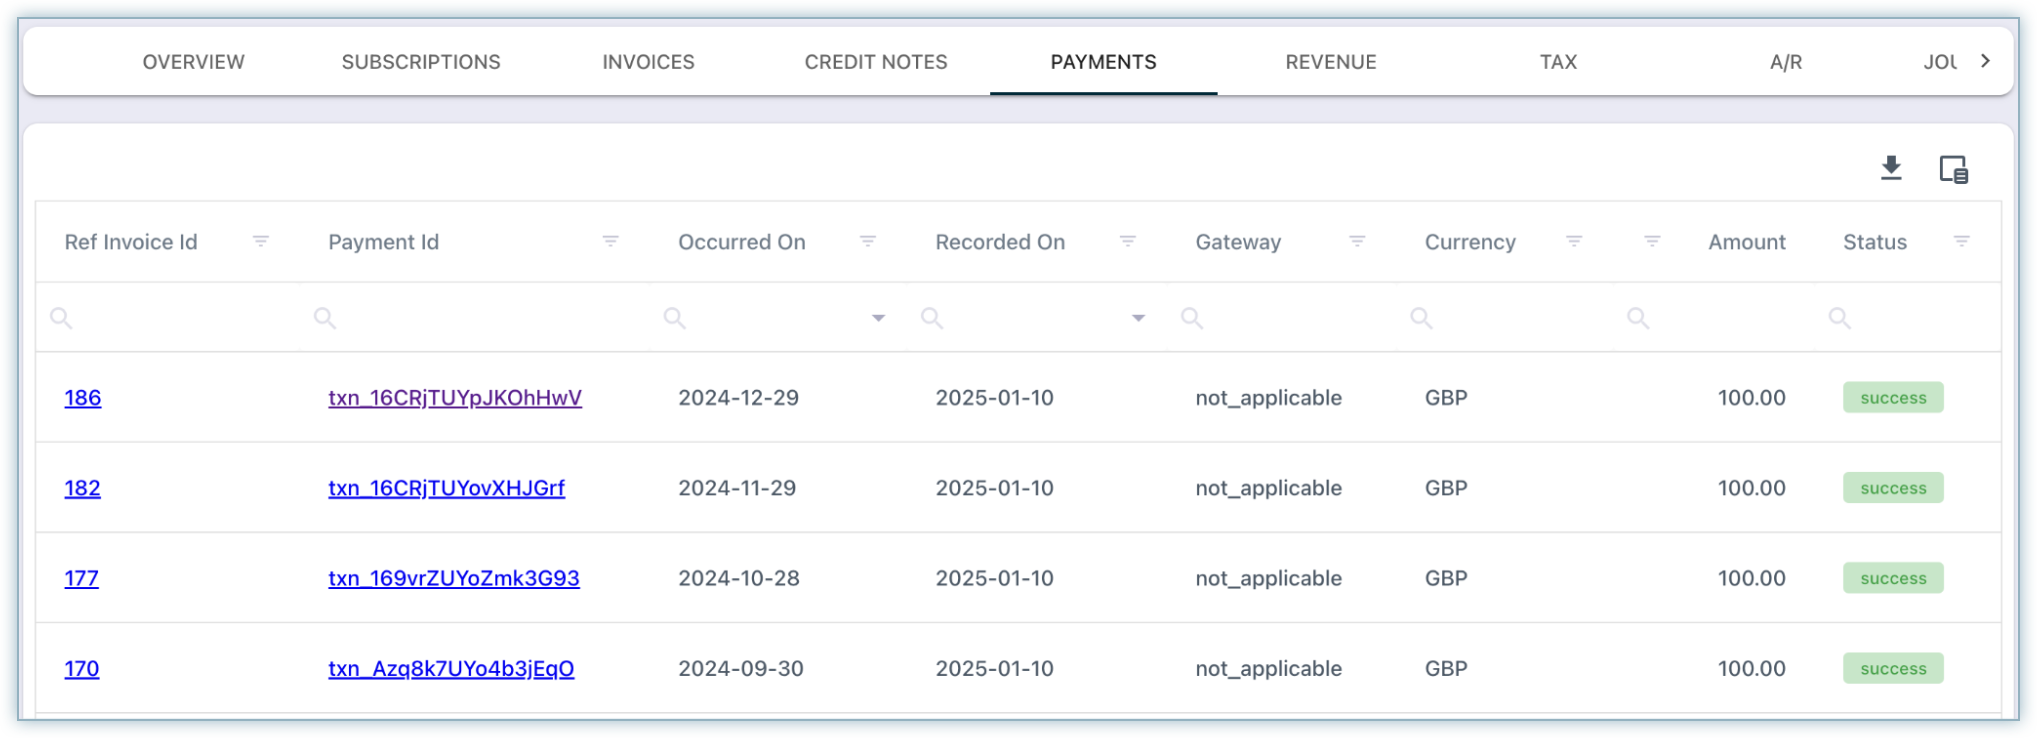
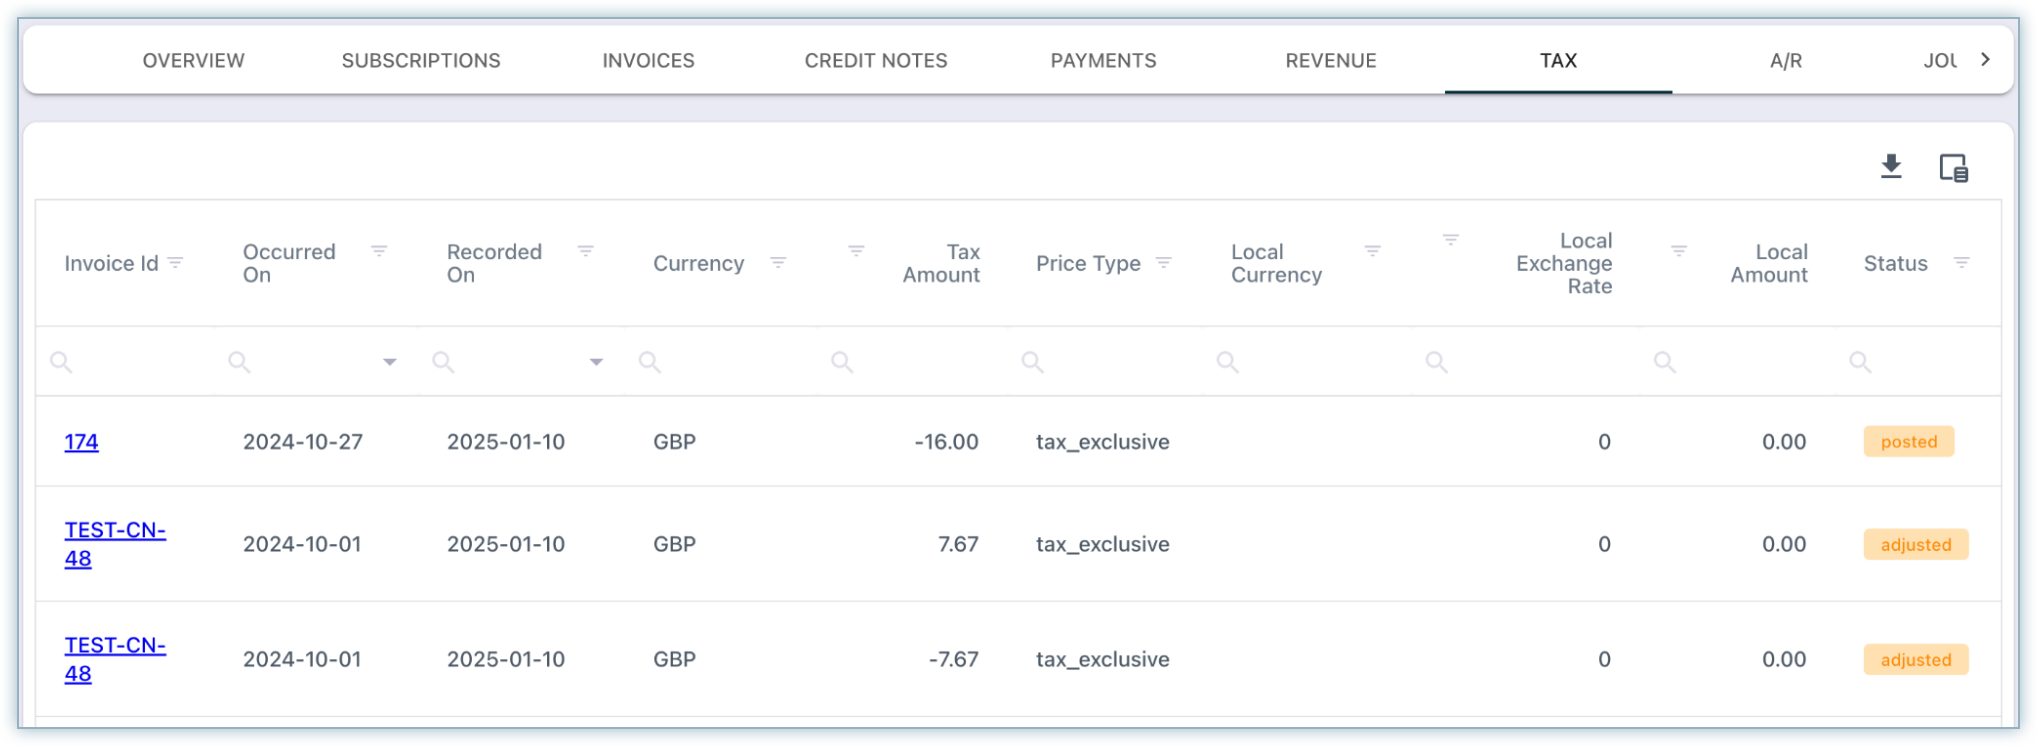
Invoices, Unbilled Charges, Credit Notes, Payments, Tax
Each tab allows you to manage and review specific customer-related transactions:
-
Invoices: View all invoices.
-
Unbilled Charges: View all unbilled charges.
-
Credit Notes: View all credit notes.
-
Payments: View payments, refunds, and unapplied payments.
-
Tax: Review tax components for invoices and credit notes.
Accounts Receivable (A/R)
The A/R section provides visibility into receivables and how they evolve across accounting periods.
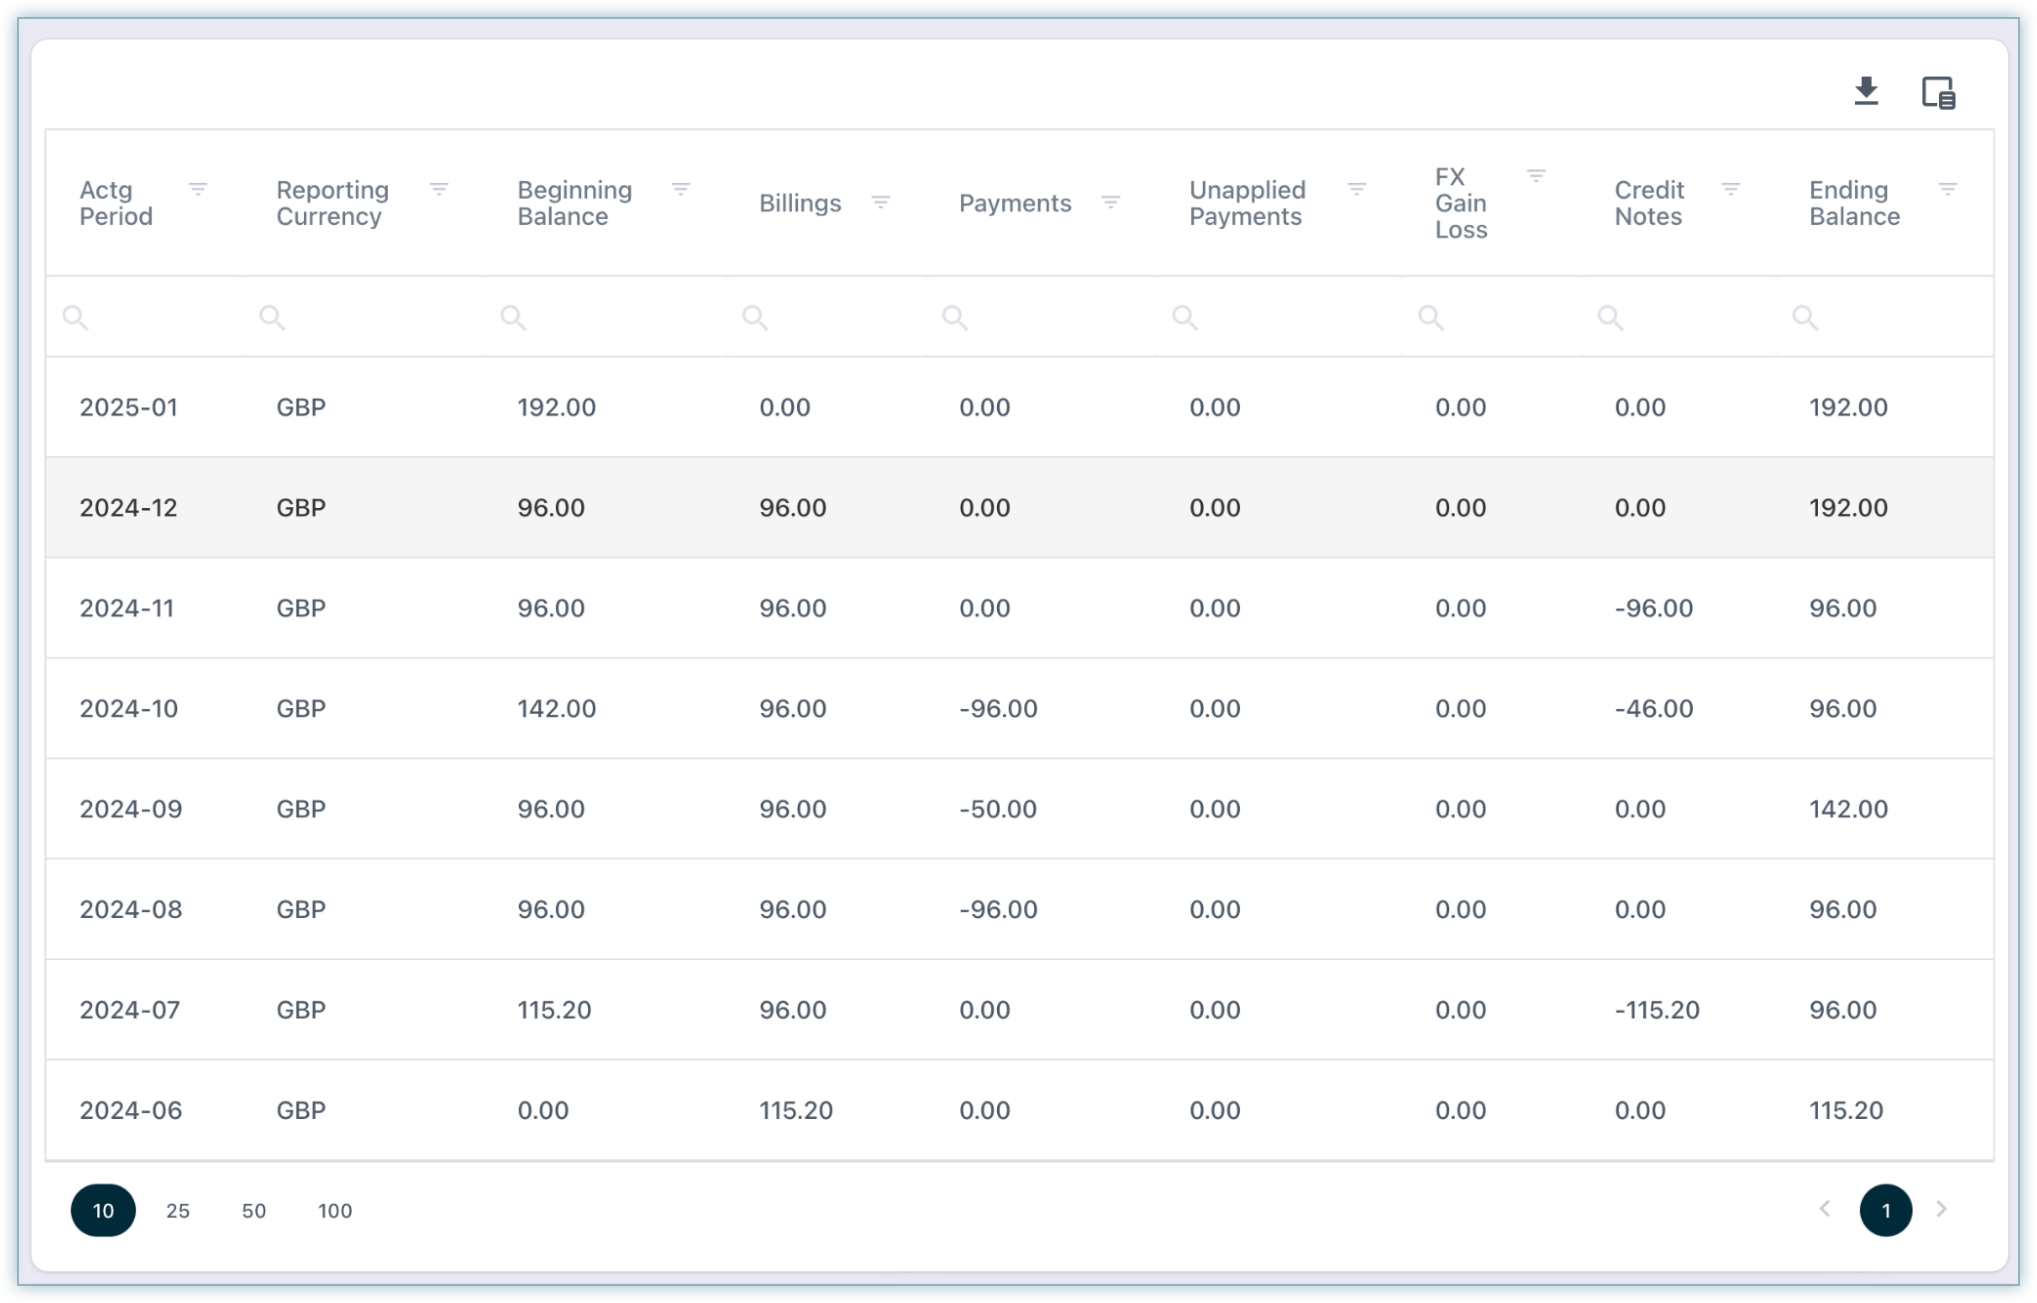
Columns
The following columns appear in the A/R Roll-Forward Report:
-
Accounting Period: Accounting period in YYYY-MM format.
-
Reporting Currency: Currency in which balances are reported.
-
Beginning Balance: Opening A/R balance.
-
Billings: New invoices raised.
-
Payments: Customer payments applied.
-
Unapplied Payments: Payments not yet allocated.
-
FX Gain/Loss: Adjustments for currency fluctuations.
-
Credit Notes: Reductions to invoices.
-
Ending Balance: Closing A/R balance.
You have the option to export the report.
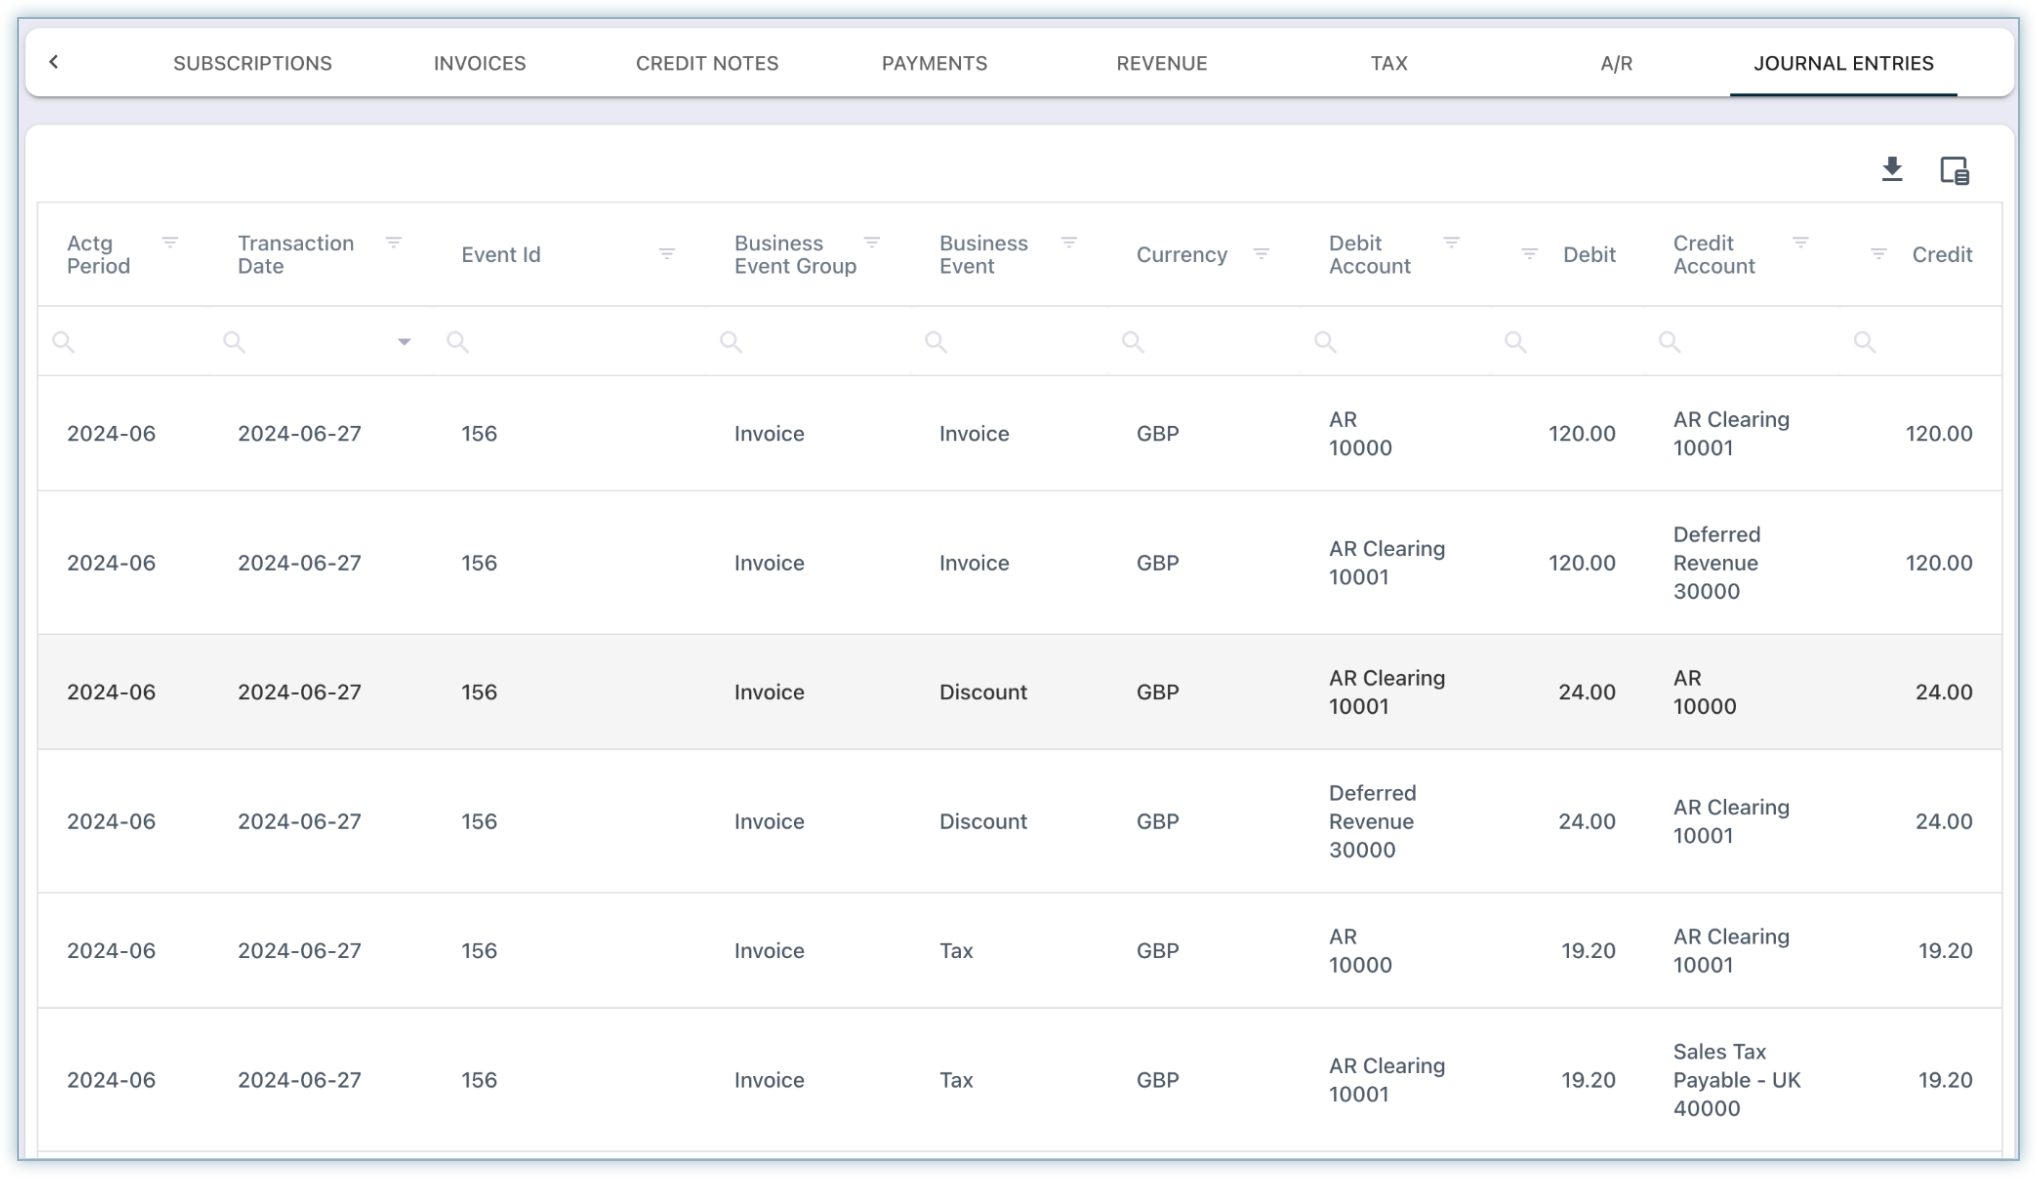
Journal Entries
The Journal Entries section captures system-generated entries for invoices, credit notes, payments, and reversals.
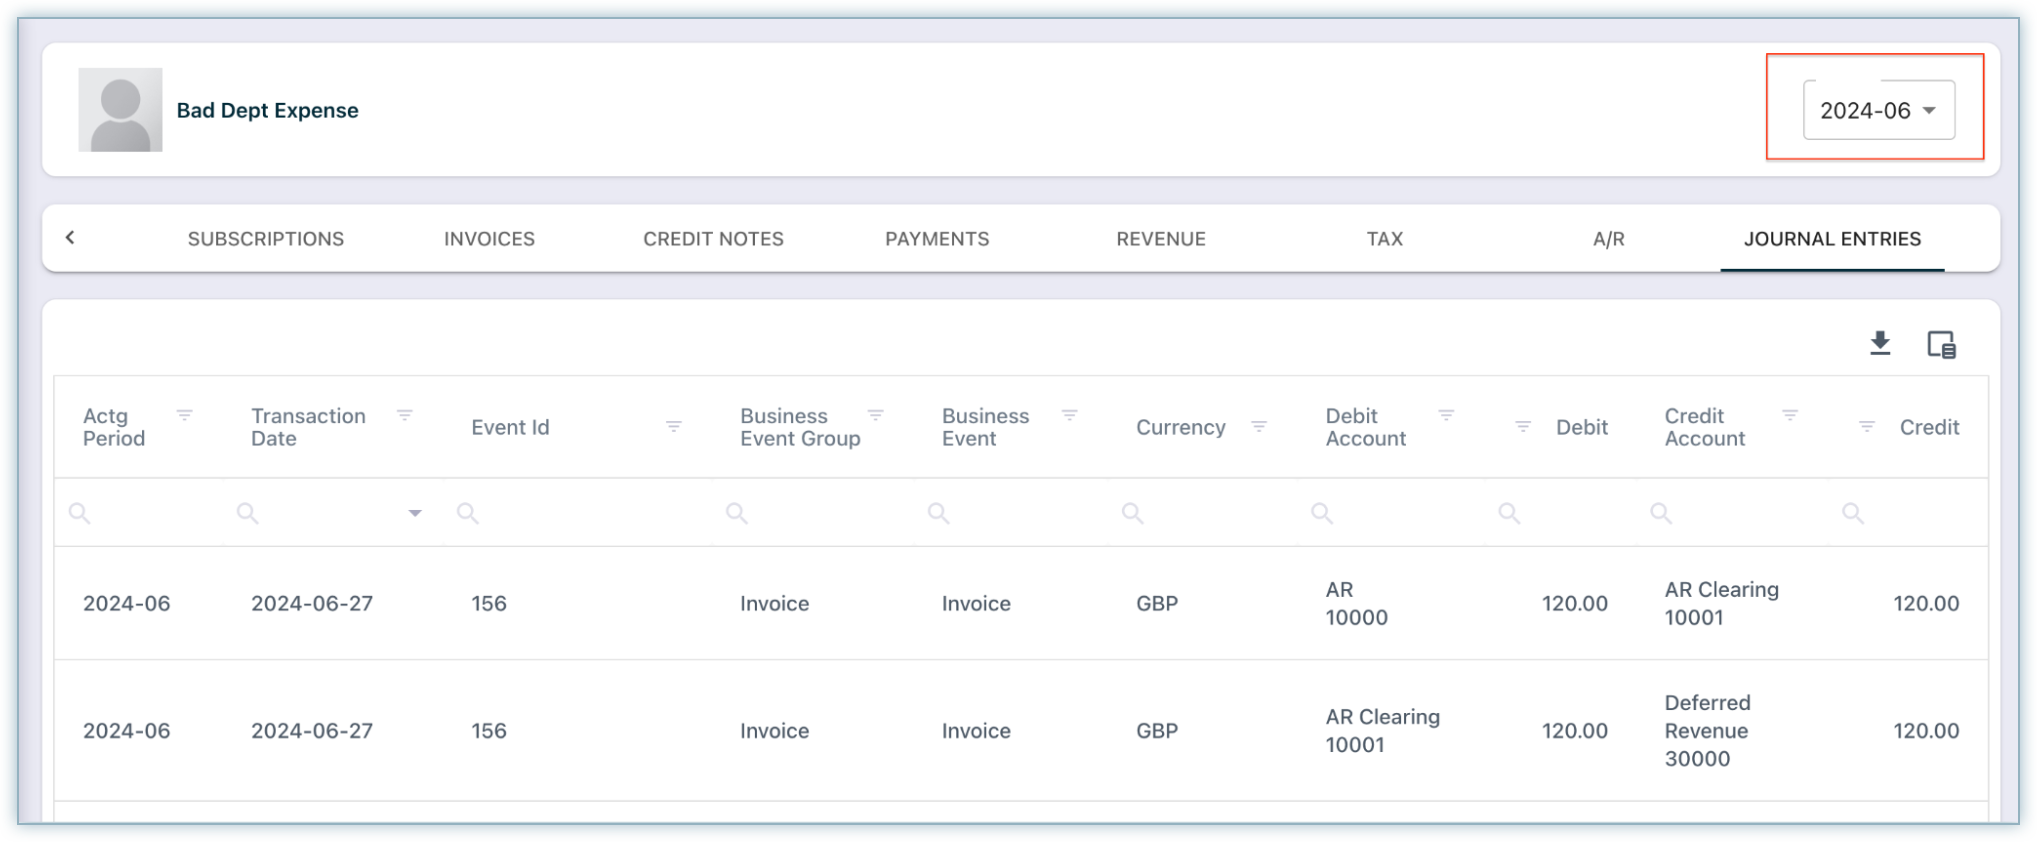
All the records displayed in the AR and Journal Entries can be filtered using the actg period selector located at the top left corner of the screen.
Columns
Each journal entry includes the following details:
-
Actg Period: Period in YYYY-MM.
-
Transaction Date: Instrument date (invoice, credit note, or payment).
-
Event ID: Unique identifier.
-
Business Event Group: Event type (Invoice, Credit Note, Payment, Revenue).
-
Business Event: Event component (e.g., base amount, discount, tax).
-
Currency: Transaction currency.
-
Debit Account / Debit: Account and amount debited.
-
Credit Account / Credit: Account and amount credited.
Account Receivable (A/R) Dashboard
This dashboard provides an overview of AR activity, helping users track outstanding receivables and overdue invoices. Period selector at the top left corner of the page allows you to see the AR movements over the period (1M, 3M, 6M, 1Y).
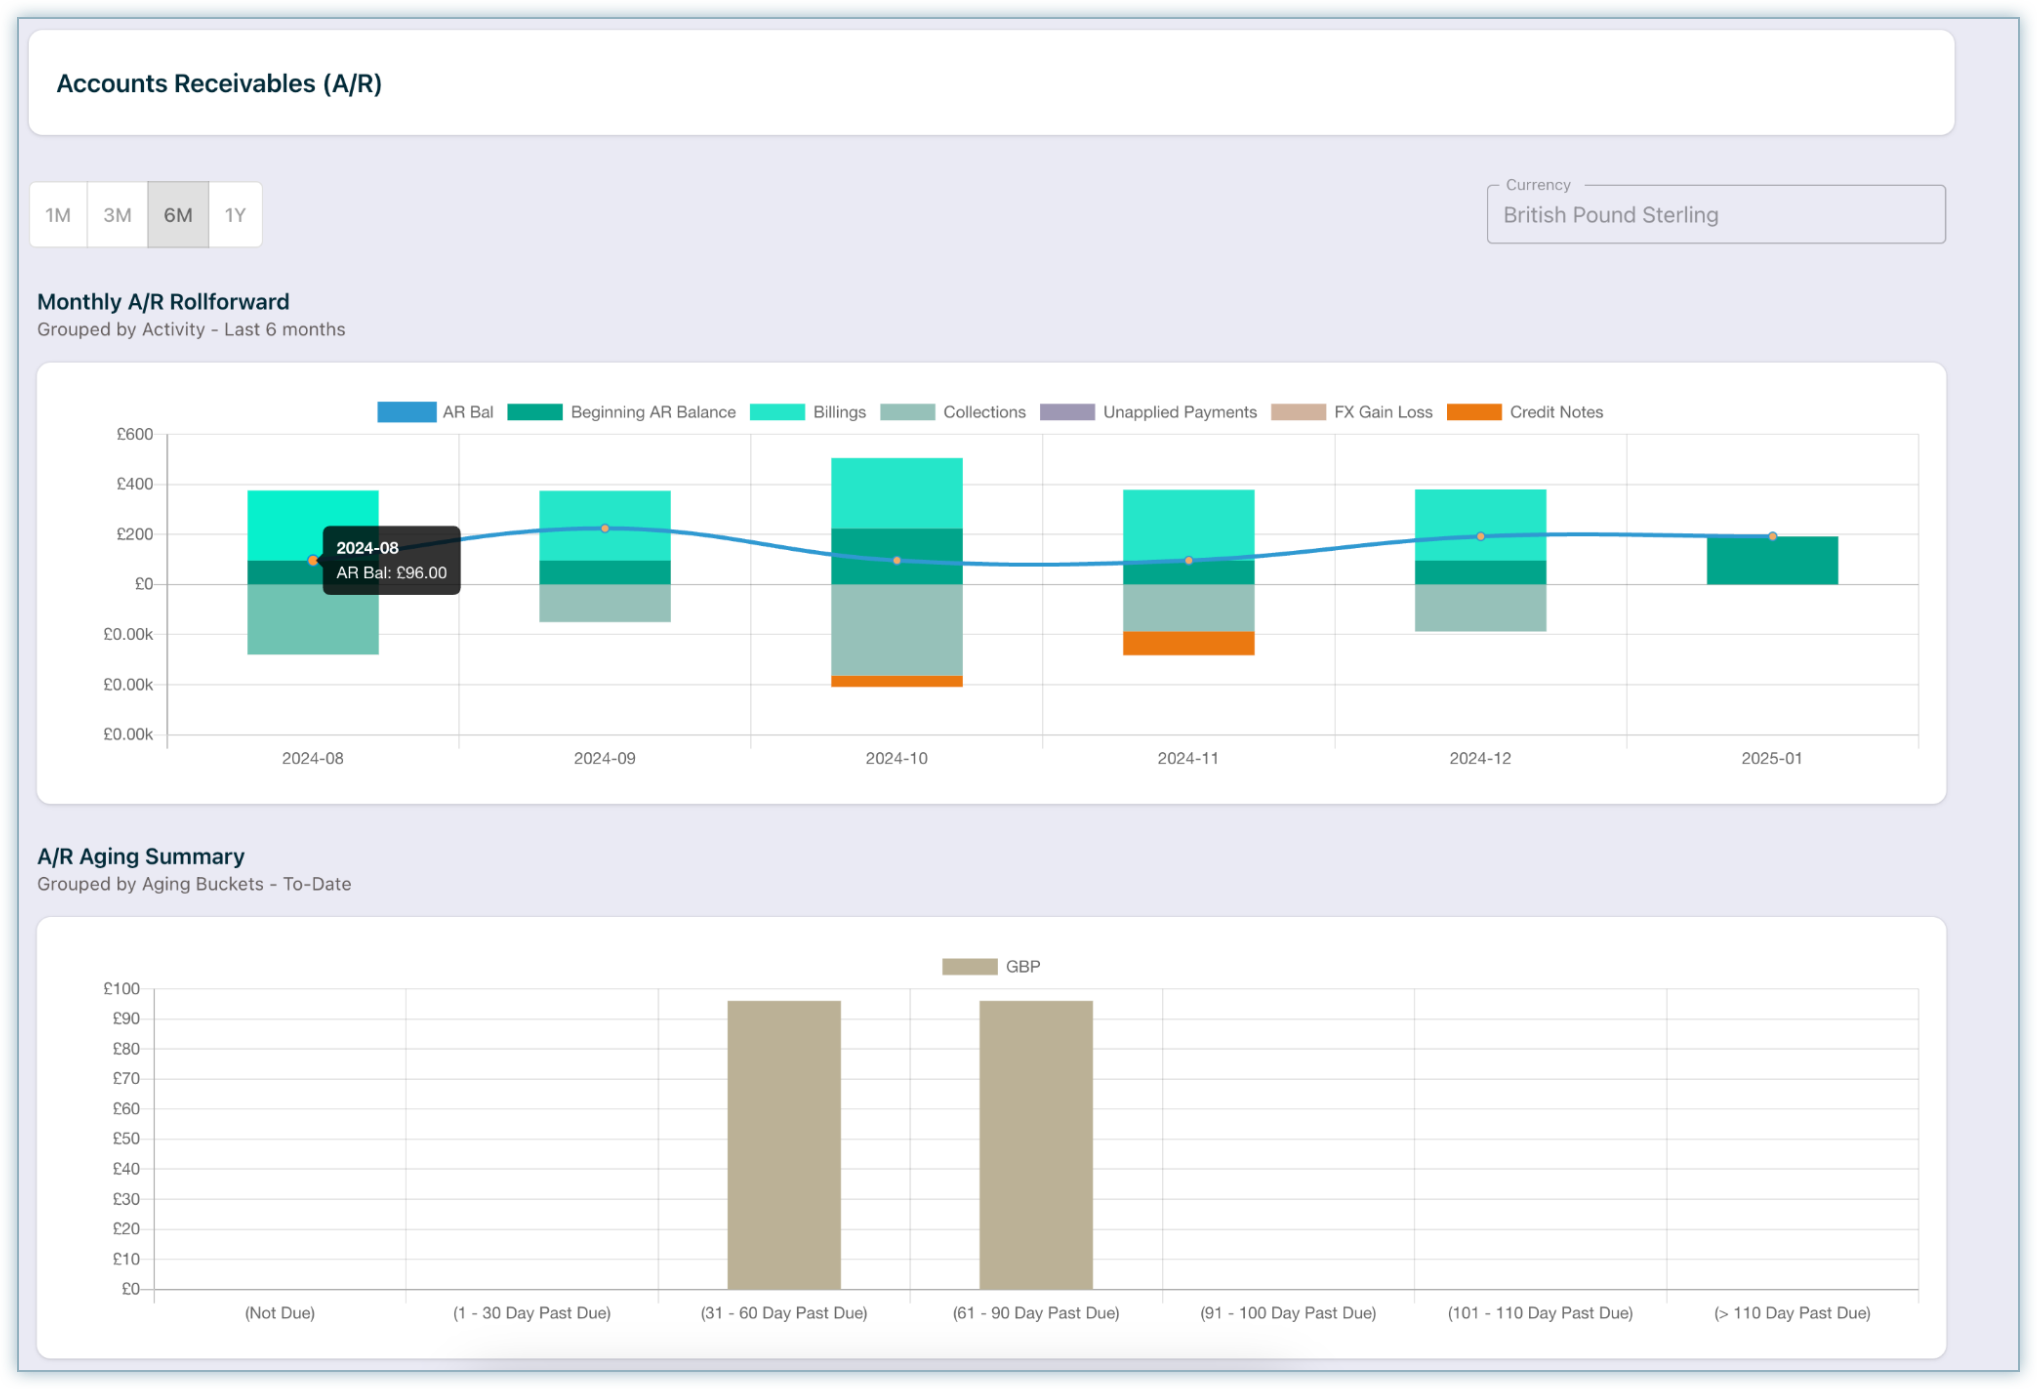
Monthly A/R Rollforward
The Monthly Accounts Receivable (A/R) Rollforward Report provides a clear view of how receivables change from one accounting period to the next. It highlights the movement of balances, allowing you to see how invoices, payments, adjustments, and other activities impact A/R over time.
From the bar chart, you can drill into the grid view of the report for a detailed breakdown. You can also drill down further to the customer level, making it easy to trace receivable movements and identify trends or variances across your customer base.
Columns
Beginning AR Balance: Carryover from the previous period.
-
Billings: New invoices issued.
-
Collections: Payments received.
-
Unapplied Payments: Payments not yet allocated to invoices.
-
FX Gain/Loss: Currency fluctuation adjustments.
-
Credit Notes: Adjustments reducing AR.
-
The blue line represents the overall AR balance trend.
A/R Aging Summary
The Accounts Receivable (A/R) Aging Summary Report organizes outstanding receivables into aging buckets, grouping unpaid customer invoices based on how long they have been outstanding. This helps finance teams quickly see which balances are current and which may pose potential collection risks.
Typical aging buckets include:
-
0–30 days
-
31–60 days
-
61–90 days
-
90+ days
From the bar chart view, users can drill down into the grid version of the report for detailed balances.
This report provides a snapshot of receivables, showing both historical and current data for the accounting period selected in the prompt. Results are grouped by Accounting Period and Transaction Currency, while balances in the Total Outstanding and aging columns are converted into the home currency to ensure consistency in financial reporting.
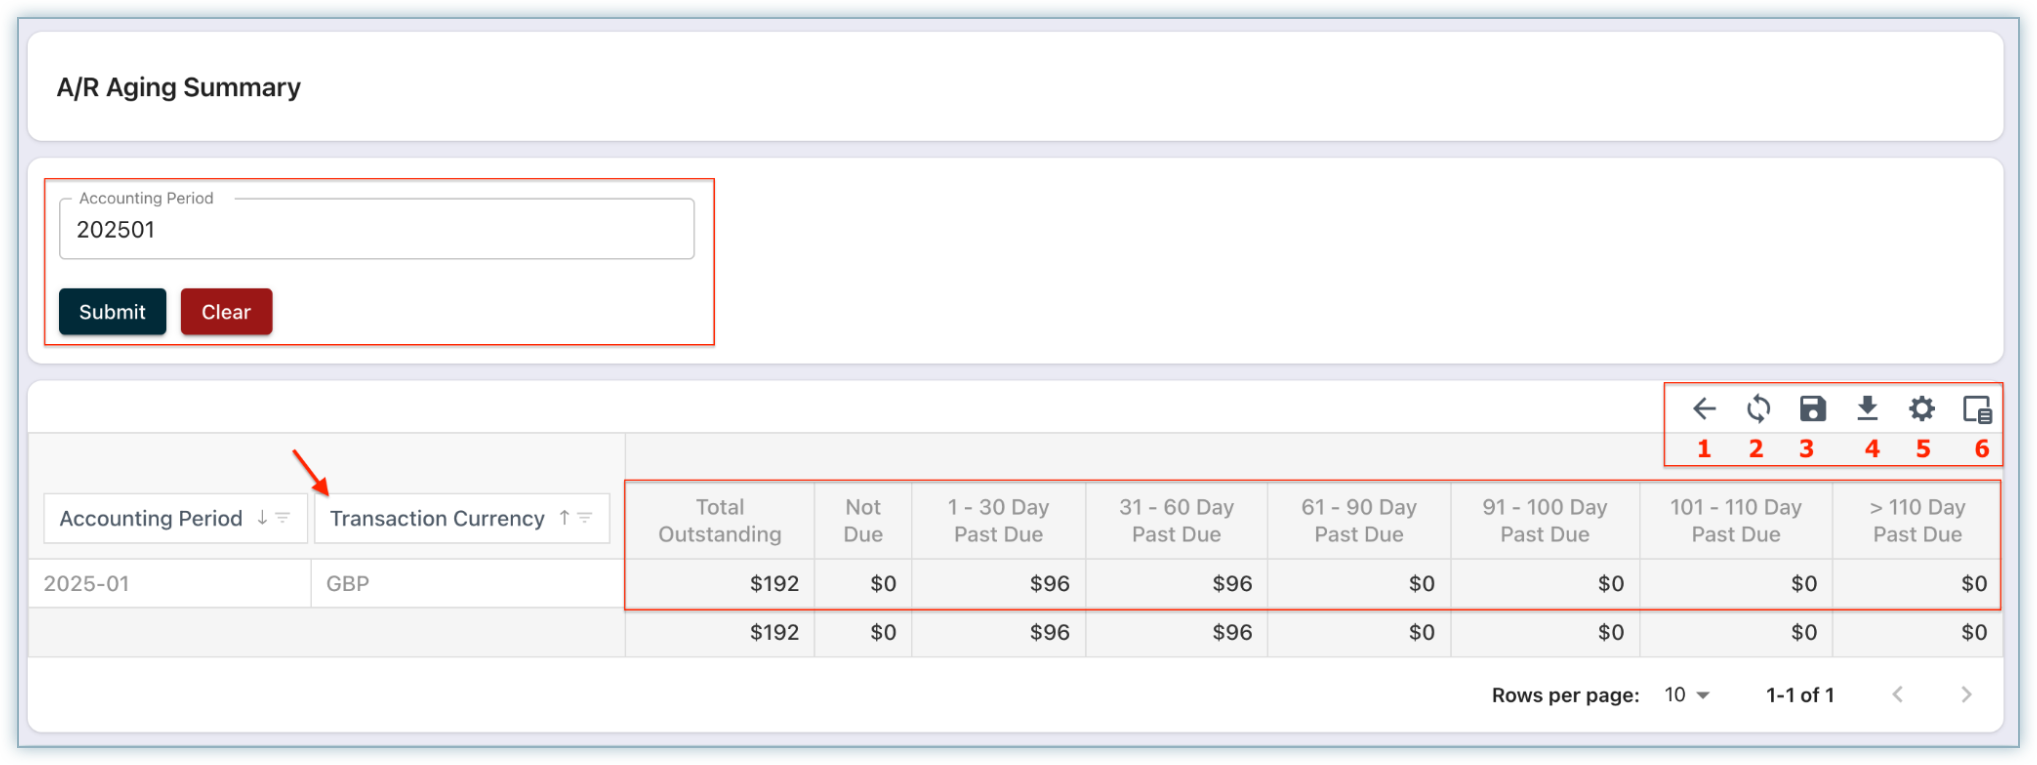
Available Actions
-
Return to Dashboard: Use this button to go back to the main A/R dashboard.
-
Refresh: Reload the grid to ensure you are viewing the latest data.
-
Save View: After making changes to filters, columns, or layout, save your personalized report view for future use.
-
Export: Export the report results into an Excel file for offline analysis or sharing.
-
Configure Aging Buckets: Define custom aging buckets by specifying end days as comma-separated values (e.g., 30, 60, 90).
-
Column Chooser: Add or remove fields from the grid to tailor the report layout.
-
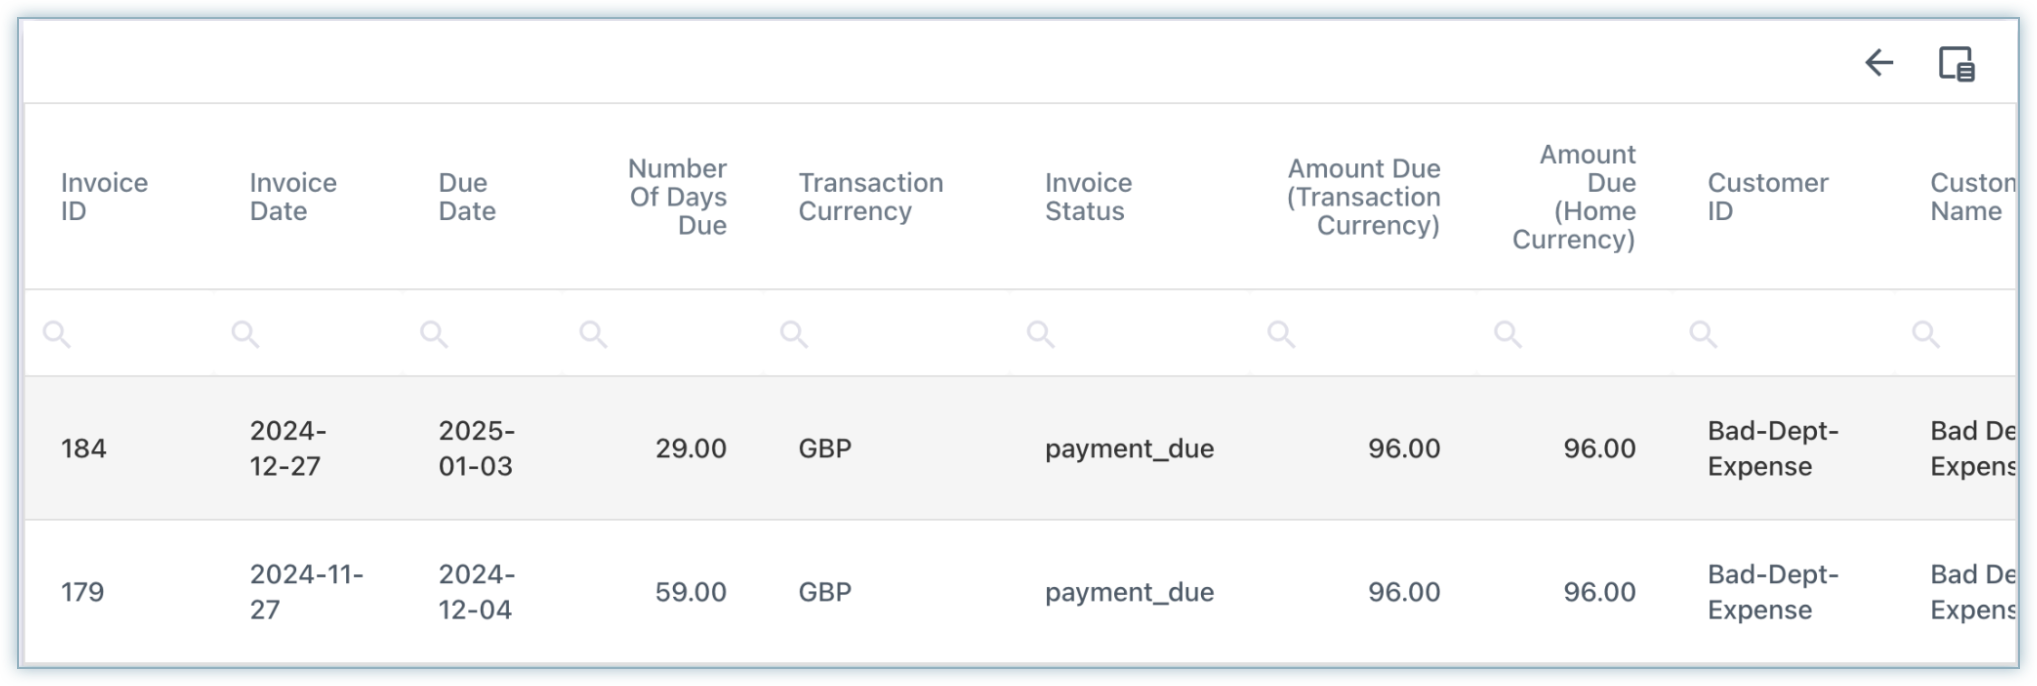
Drill-Down to Detailed View: From the summary report, users can drill down to see a detailed view of individual invoices. This breakdown includes key invoice-level data such as:
- Invoice ID
- Invoice Date
- Due Date
- Amount Due
- Customer ID
- Other relevant invoice attributes
This detailed view allows you to analyze outstanding balances at a more granular level, making it easier to identify overdue items and prioritize collections.
Payments
The Payments page provides an overview of financial transactions, including net payments, refunds, and unapplied payments. This page helps users track and analyze payment trends over time, grouped by various categories such as activity and payment gateway.
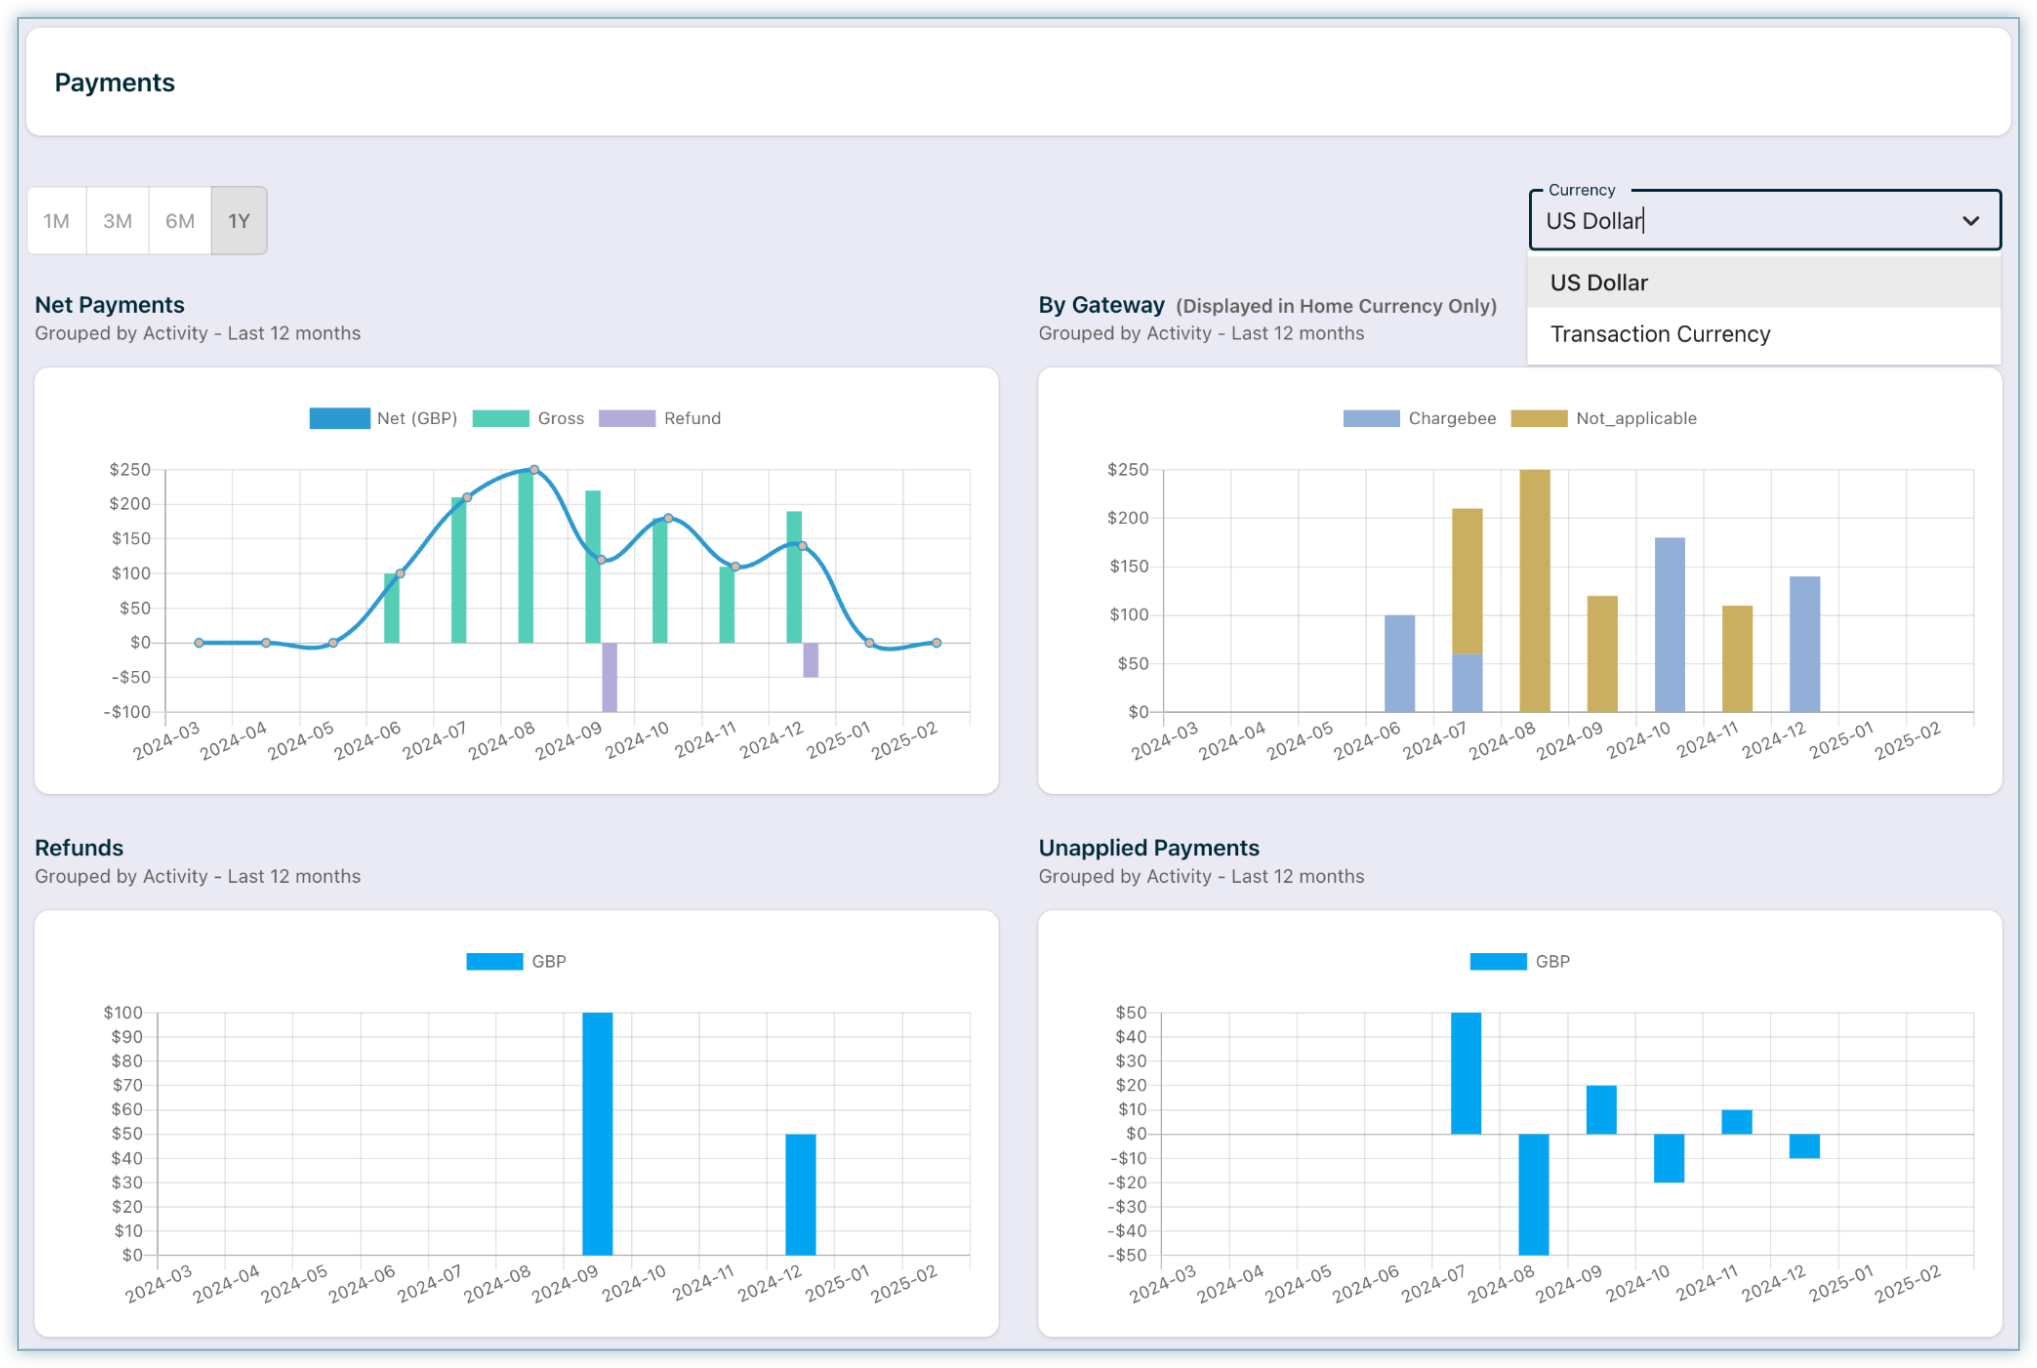
Key Features
You can use the following features on the Payments page:
-
Time Range Selector: Filter data for 1M, 3M, 6M, or 1Y.
-
Currency Options: View in Home Currency(converts all amounts to your site’s base currency), or Transaction Currency(displays amounts in the original transaction currency).
-
Net Payments (Grouped by Activity): Visuals for gross vs. net payments that help track revenue trends and assess income over the selected period.
-
Payments by Gateway: Breakdown by payment channels.
-
Refunds (Grouped by Activity): Graphical view of refund transactions across the selected period that helps monitor refund patterns and identify unusual trends.
-
Unapplied Payments: Identify payments that are not yet allocated to invoices.
Was this article helpful?