Overview of RevRec Premium Reporting
Introduction
RevRec Premium provides a comprehensive reporting system that makes it easy to manage accounts receivable, cash, tax, revenue, and expense recognition. It includes a standard set of accounting and control reports such as:
-
Accounts Receivable: Track customer balances.
-
Cash: Monitor collections and cash movement.
-
Tax: Review tax-related amounts and reconciliations.
-
General Ledger: Access a consolidated financial view.
These reports work together to provide a comprehensive, reliable view of your financials.
Reports in RevRec Premium are highly flexible. You can:
-
Drill down to see detailed transaction-level data.
-
Roll up to view totals at a summary level.
-
Customize the layout to suit your reporting needs.
-
Download or export reports for further analysis or sharing.
This flexibility allows you to move seamlessly between high-level insights and granular data across revenue, expenses, receivables, cash, and tax, all within the same reporting environment.
Using RevRec Premium Reports
Accessing Reports
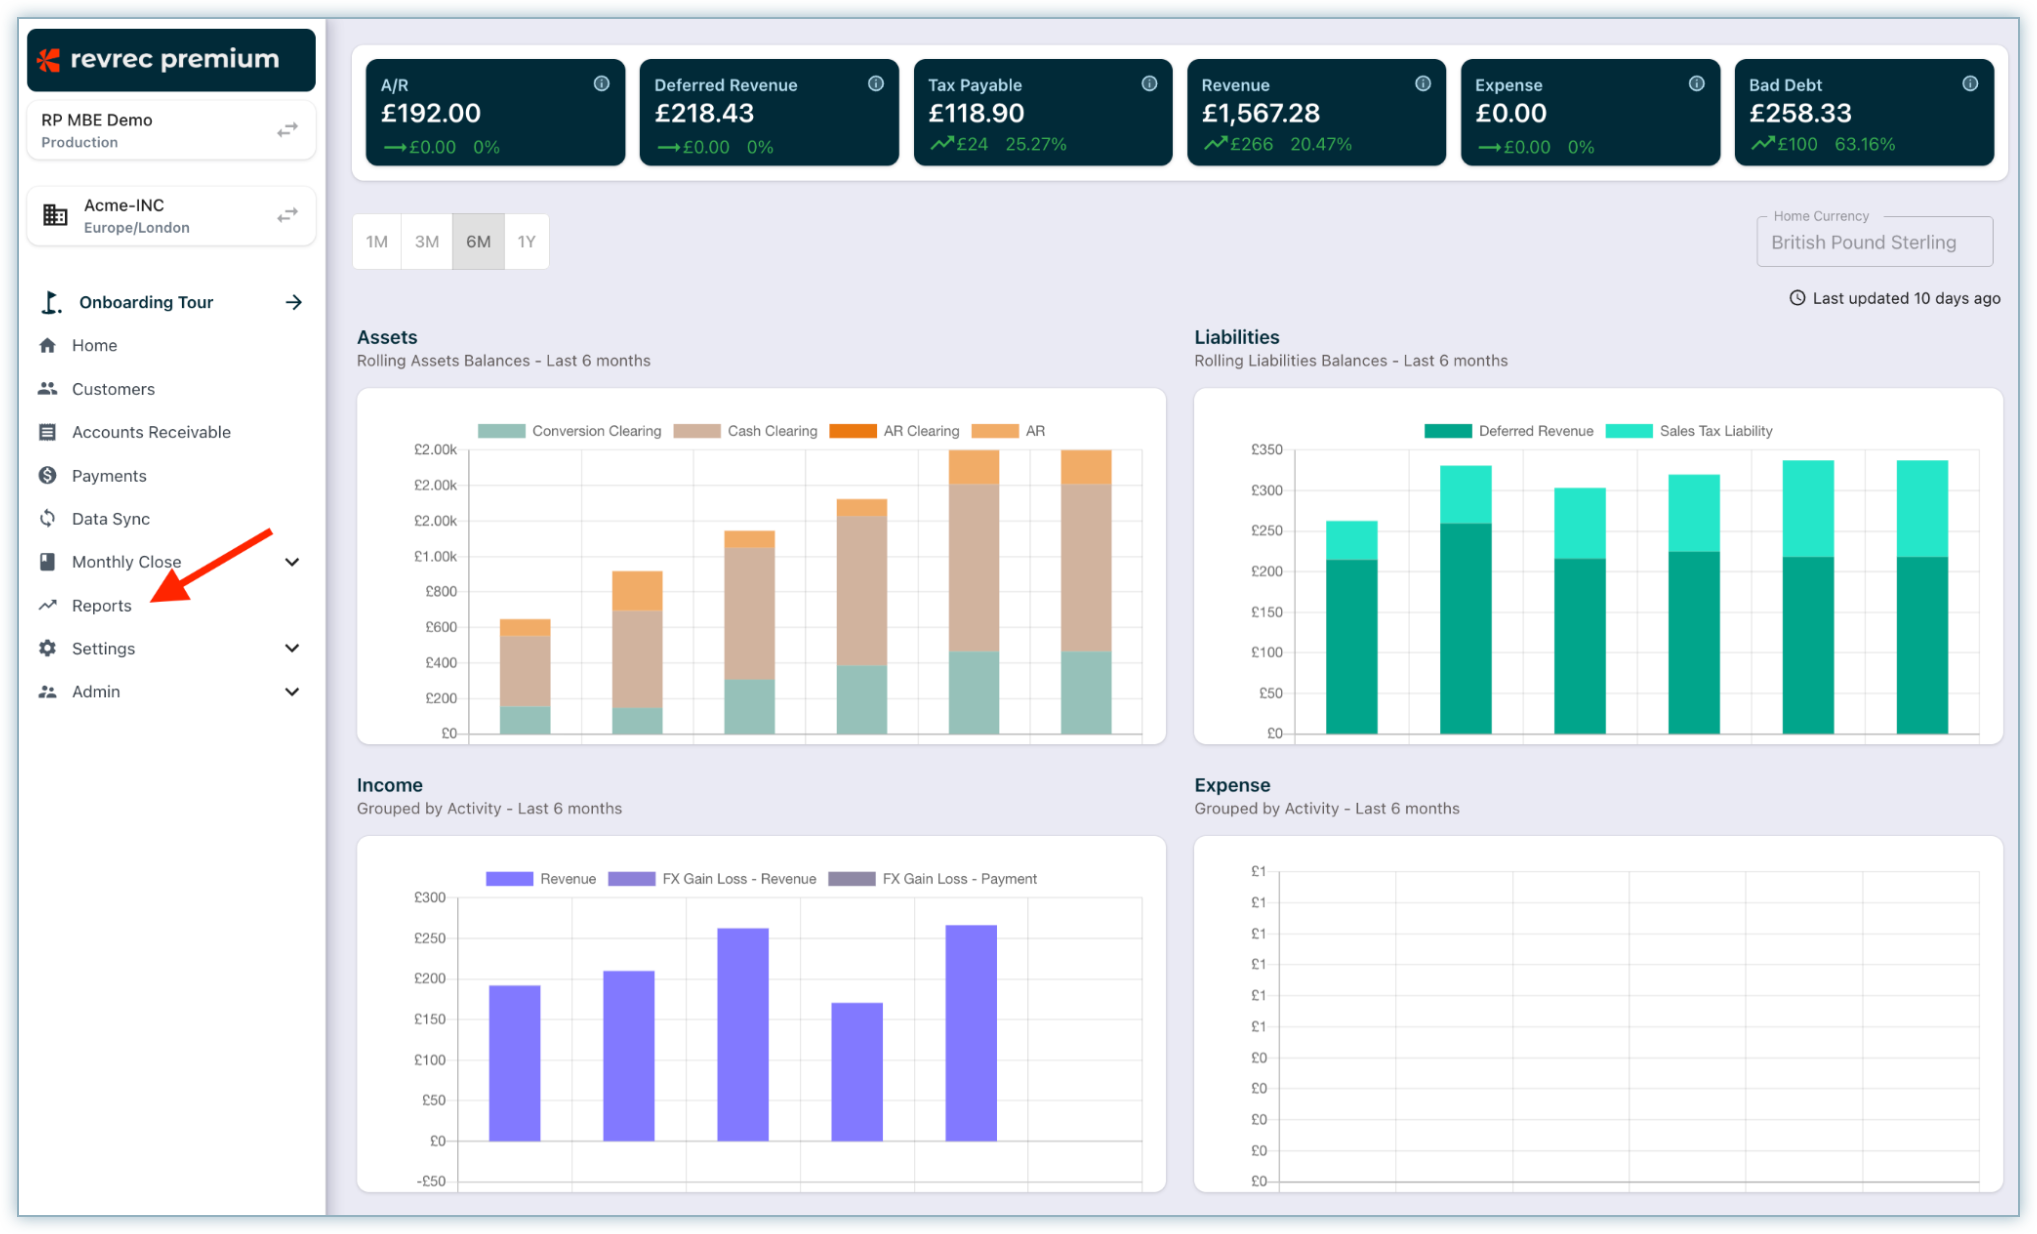
To access reports in RevRec Premium:
- Click Reports in the main menu.
- The Reports page opens with multiple tabs, one for each report category.
- Click a tab to see the available reports in that category.
- Select a report from the left navigation panel to view it.
Note
A dedicated Closing Reports section is available under the Monthly Close menu. It highlights key reports recommended for period-end review. These reports are also accessible from the Report Explorer.
Report Toolbar and Controls
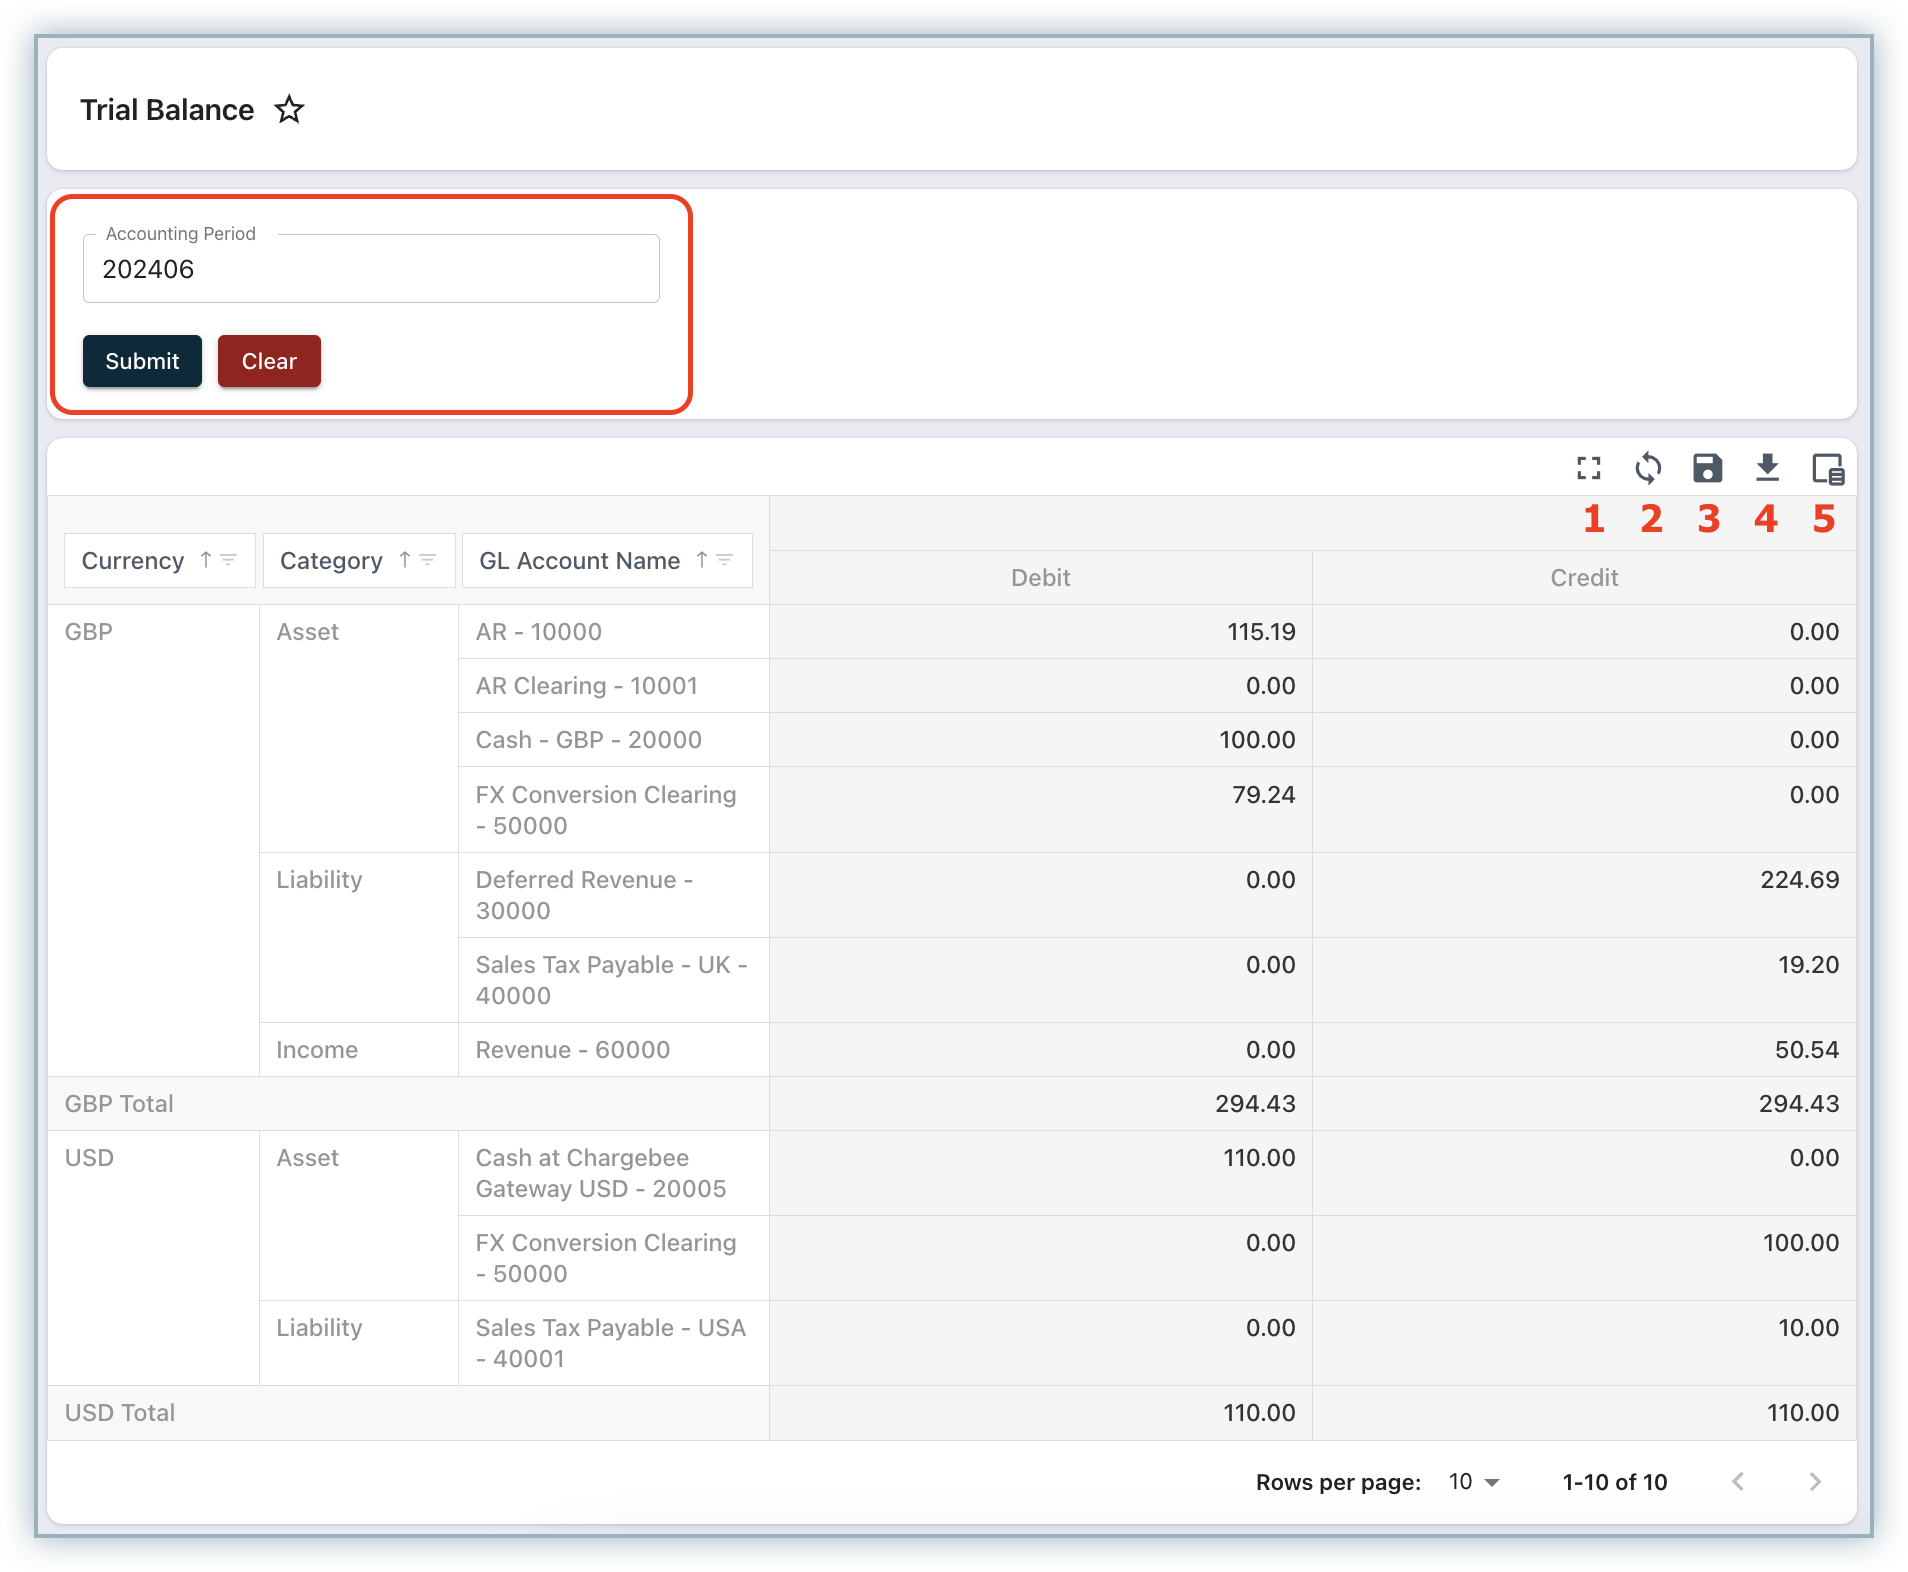
Each report comes with a toolbar and controls to help you customize and manage your view:
-
Maximize: Expand the view to see more of the report.
-
Refresh: Reload the report and reset any filters applied.
-
Save Layout: Save your customized report layout after adding or removing columns.
Note
Saved layouts are user-specific. They cannot be shared with other users.
-
Export: Download report data in two formats:
-
Standard Export: Export the current layout as displayed.
-
VUD Export(Very Detailed): Export a detailed, transaction-level dataset.
-
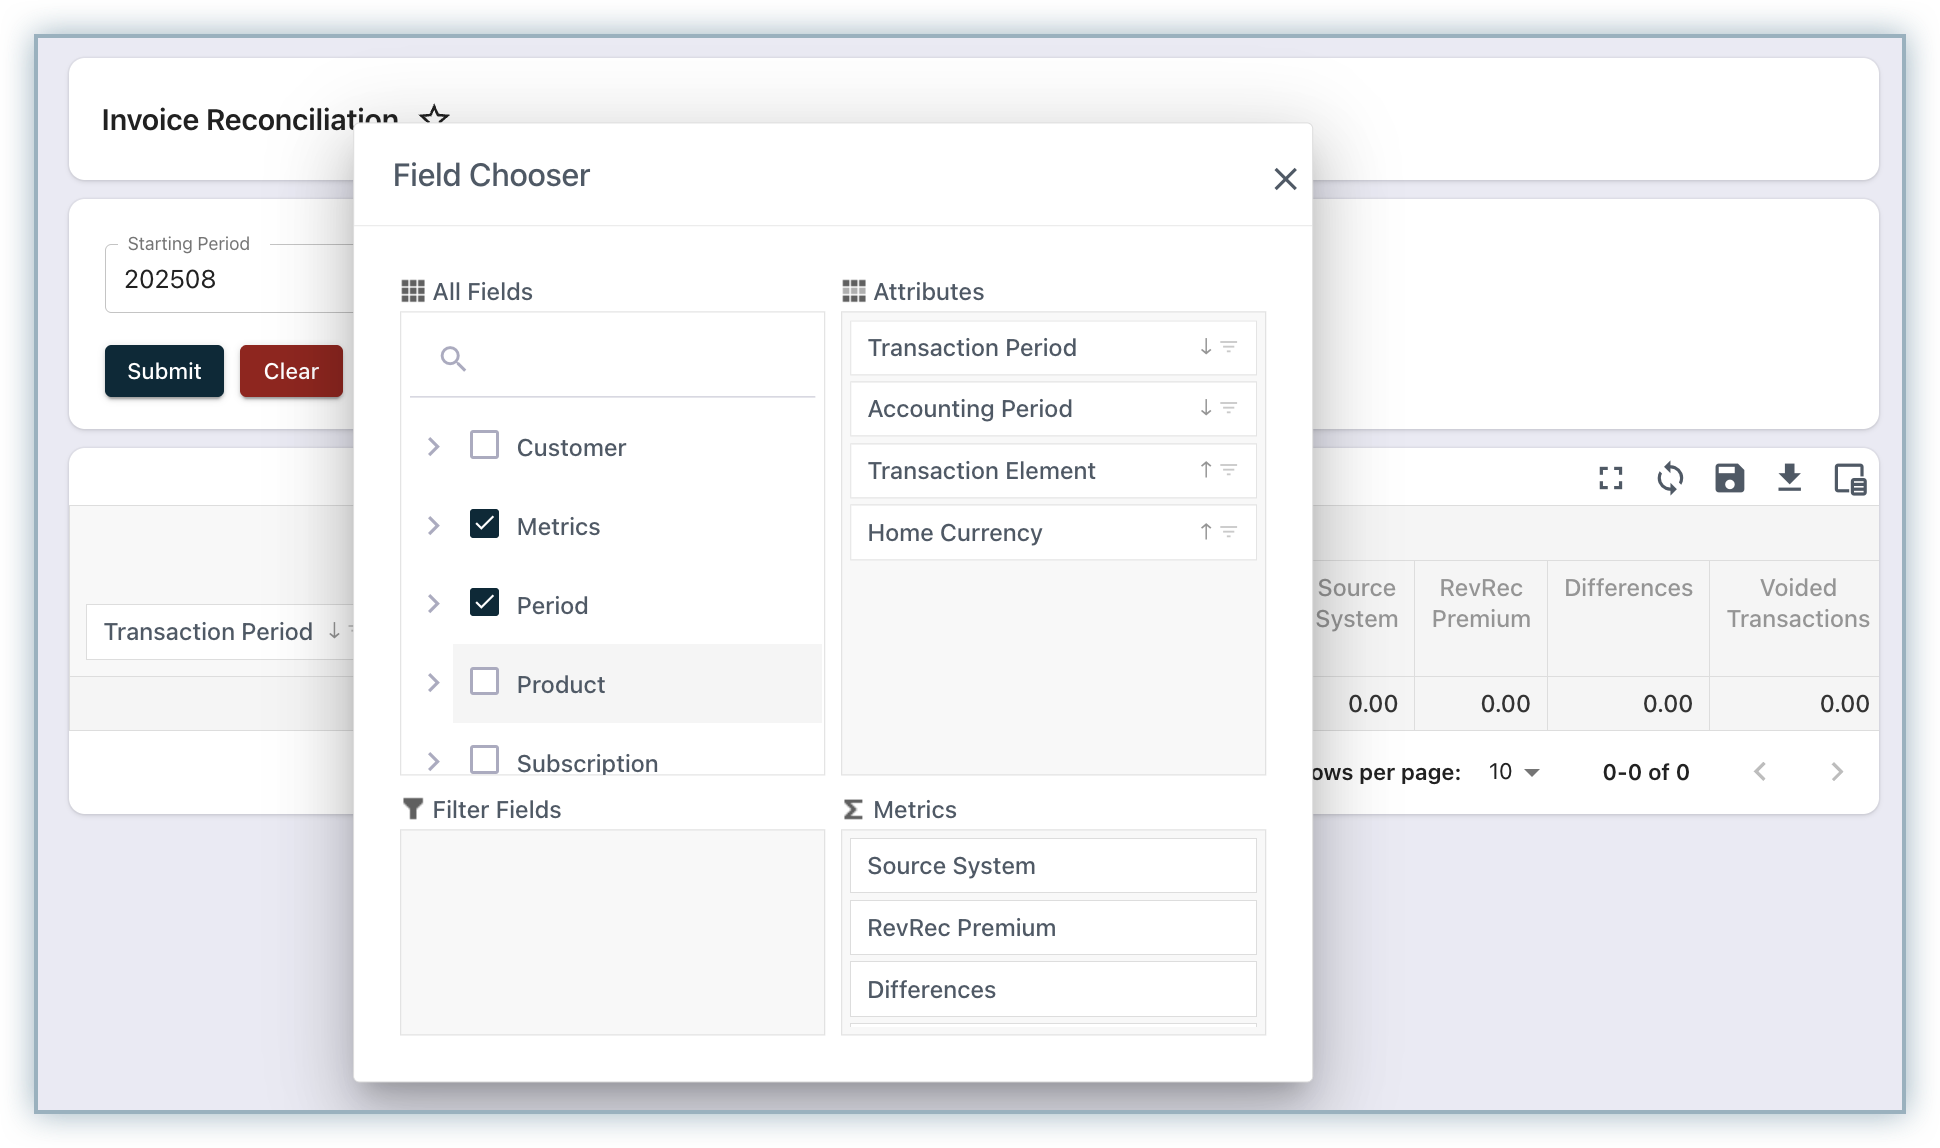
Field Chooser: Add or remove columns to tailor the report to your needs.
Filtering, Pagination & Navigation
-
Filters: Reports include built-in prompts to filter data, allowing you to narrow down to specific time periods, customers, transactions, and more.
-
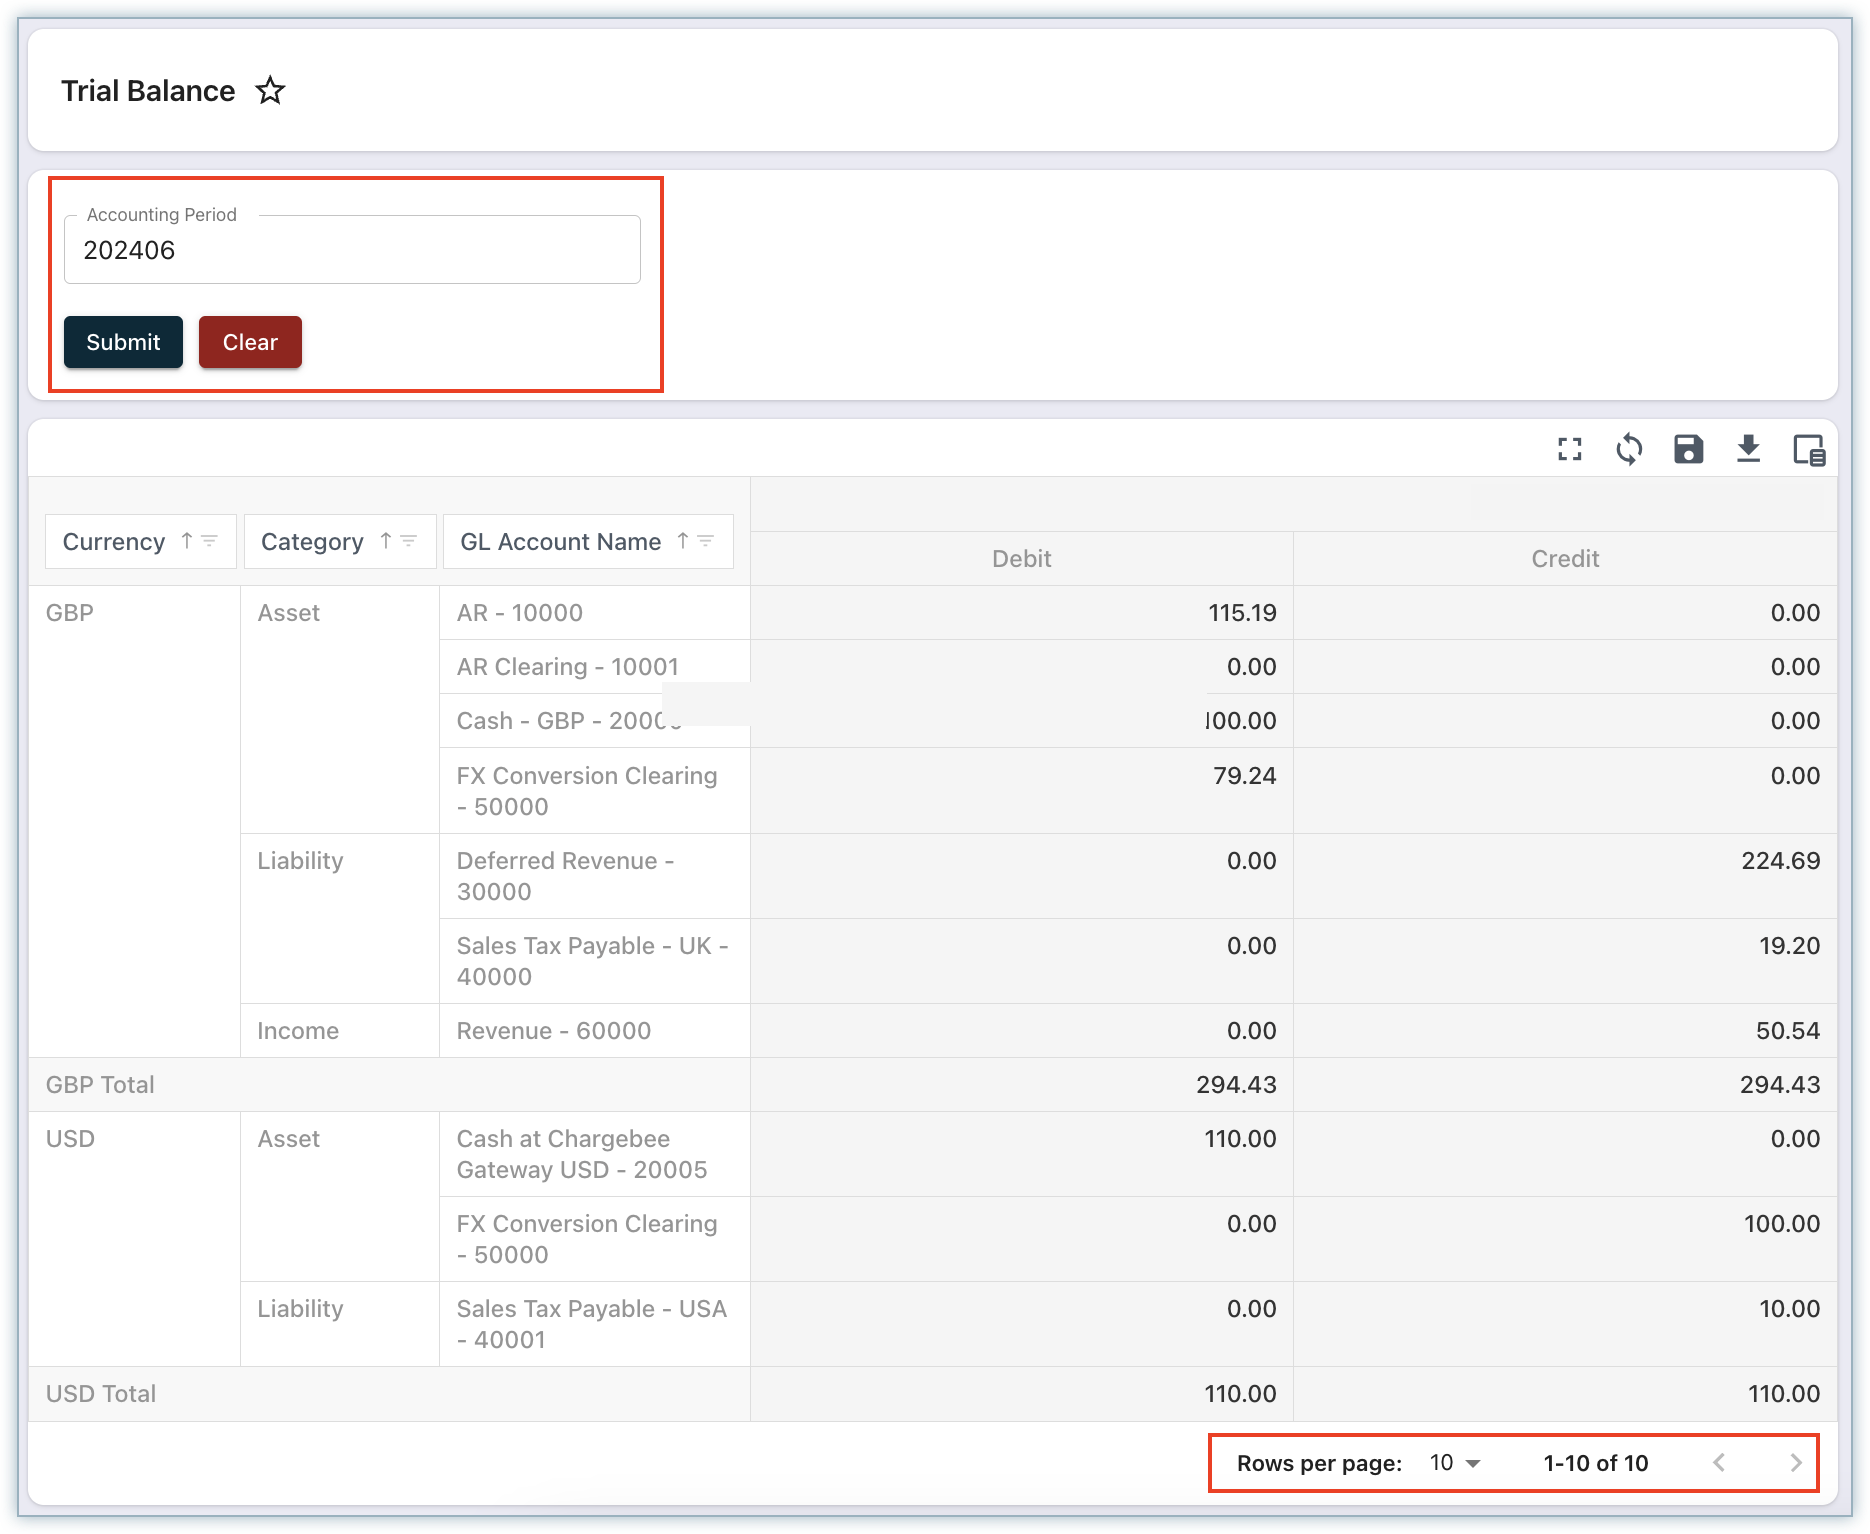
Pagination: By default, reports display 10 records per page.
-
Use the Rows per page dropdown at the bottom of the report to increase the limit to Up to 100 per page.
-
Use the navigation buttons to move between pages.
Report Explorer
The Report Explorer provides tools to search, browse, and organize your reports efficiently.
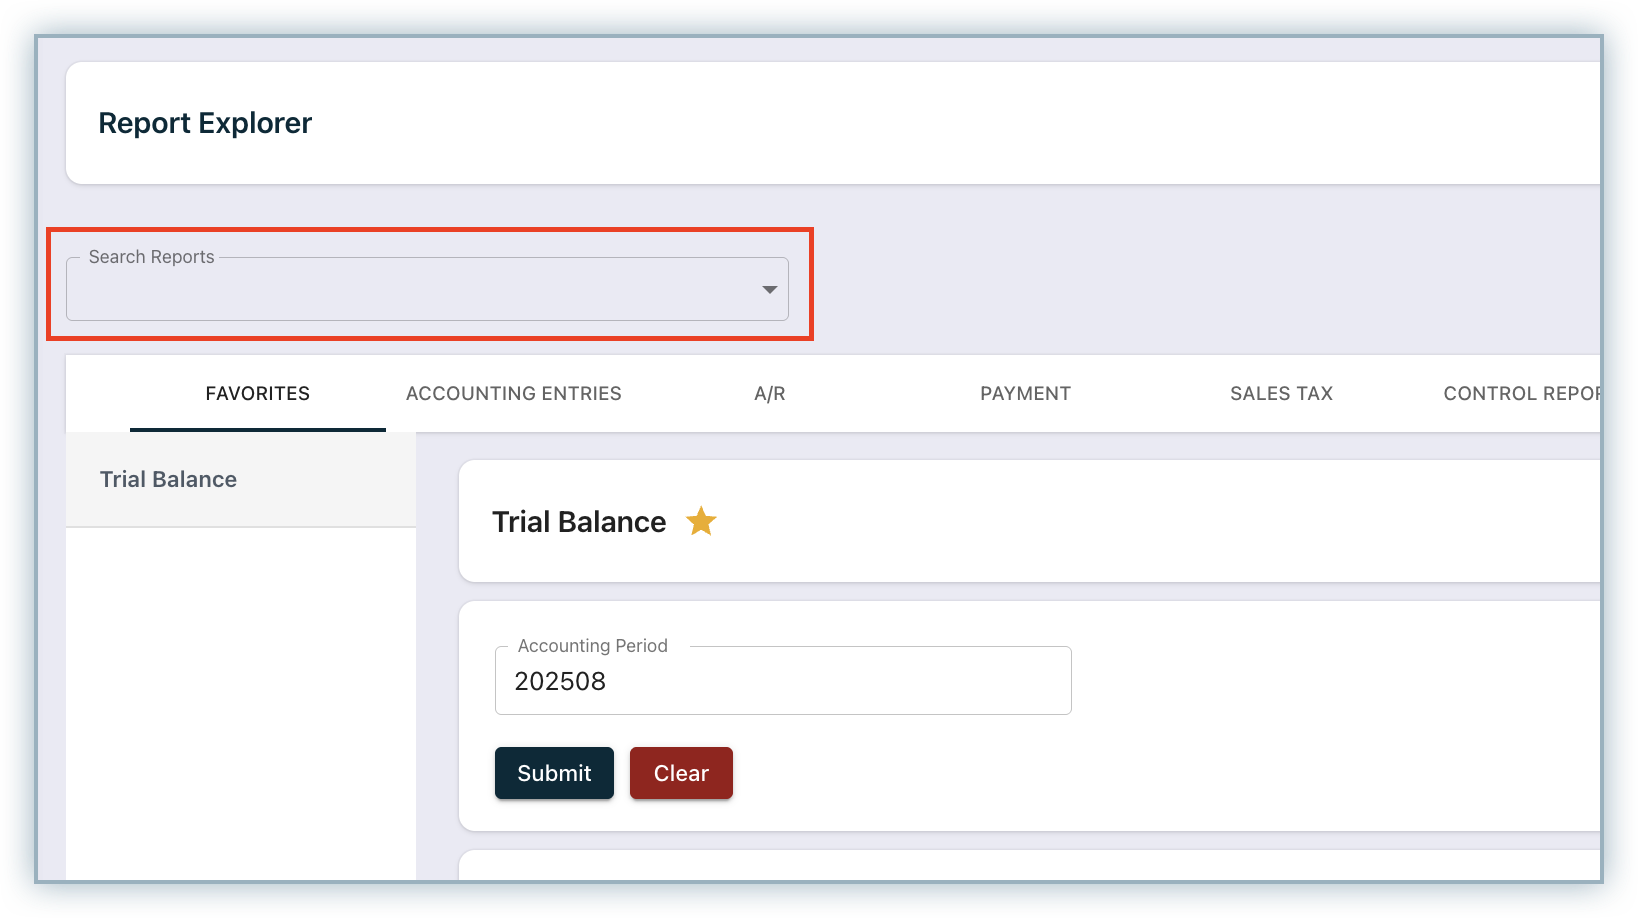
Search Reports
Use the Search Reports field at the top of the Report Explorer.
-
Start typing the report name to filter results instantly.
-
For example, typing “Trial Balance” will display the Trial Balance report directly.
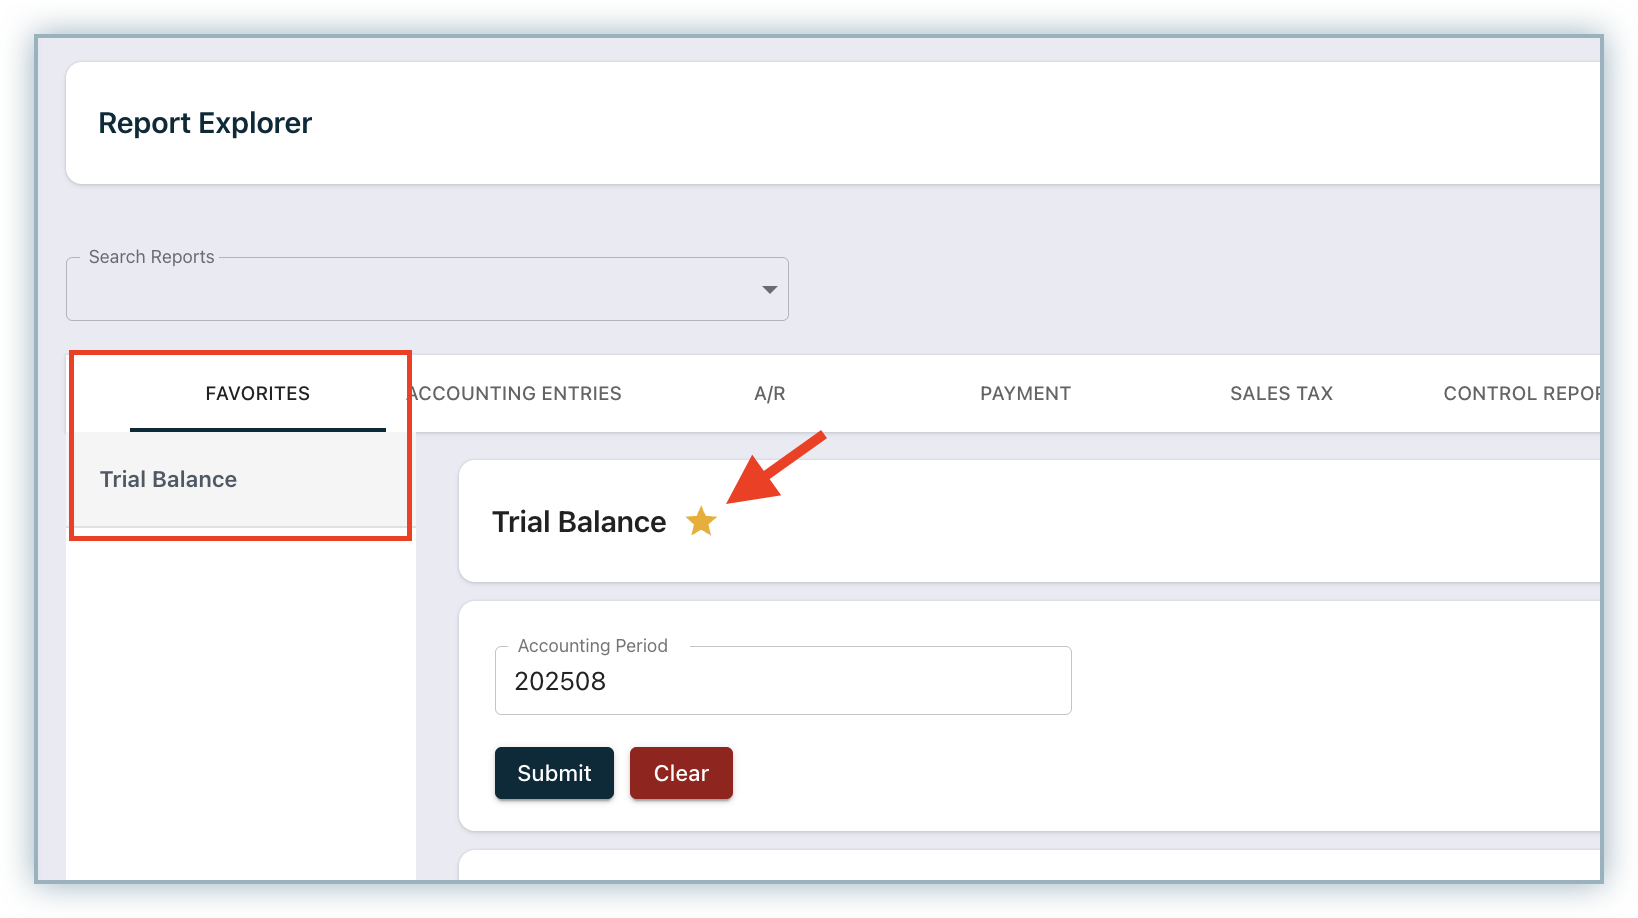
Favorites
To quickly access the reports you use most often:
-
Click the Add to Favorites icon next to a report.
-
Favorited reports will appear under the Favorites tab in the Report Explorer.
-
The Favorites tab always appears first, making it easy to find frequently used reports.
Note
Favorites are user-specific. They are not shared with other users.
Tips & Best Practices
-
Use VUD Export for detailed transaction-level data. It is ideal for audits, reconciliations, or external analysis.
-
Use Standard Export when you need a quick snapshot or layout for sharing or reference.
-
Maintain a clean Favorites list by pinning only frequently used reports.
-
Save custom layouts tailored to specific workflows. For example, include tax columns for audit reviews, hide them for executive summaries.
-
If filters aren’t working as expected, refresh the report to reload the base dataset.
Was this article helpful?