Navigating the Dashboard
The Chargebee Retention Dashboard contains five out-of-the-box reports that display a high-level overview of your Cancel Page performance: Save Performance, Deflection Funnel, Saves, Cancels, and Active Watch List.
Save Performance
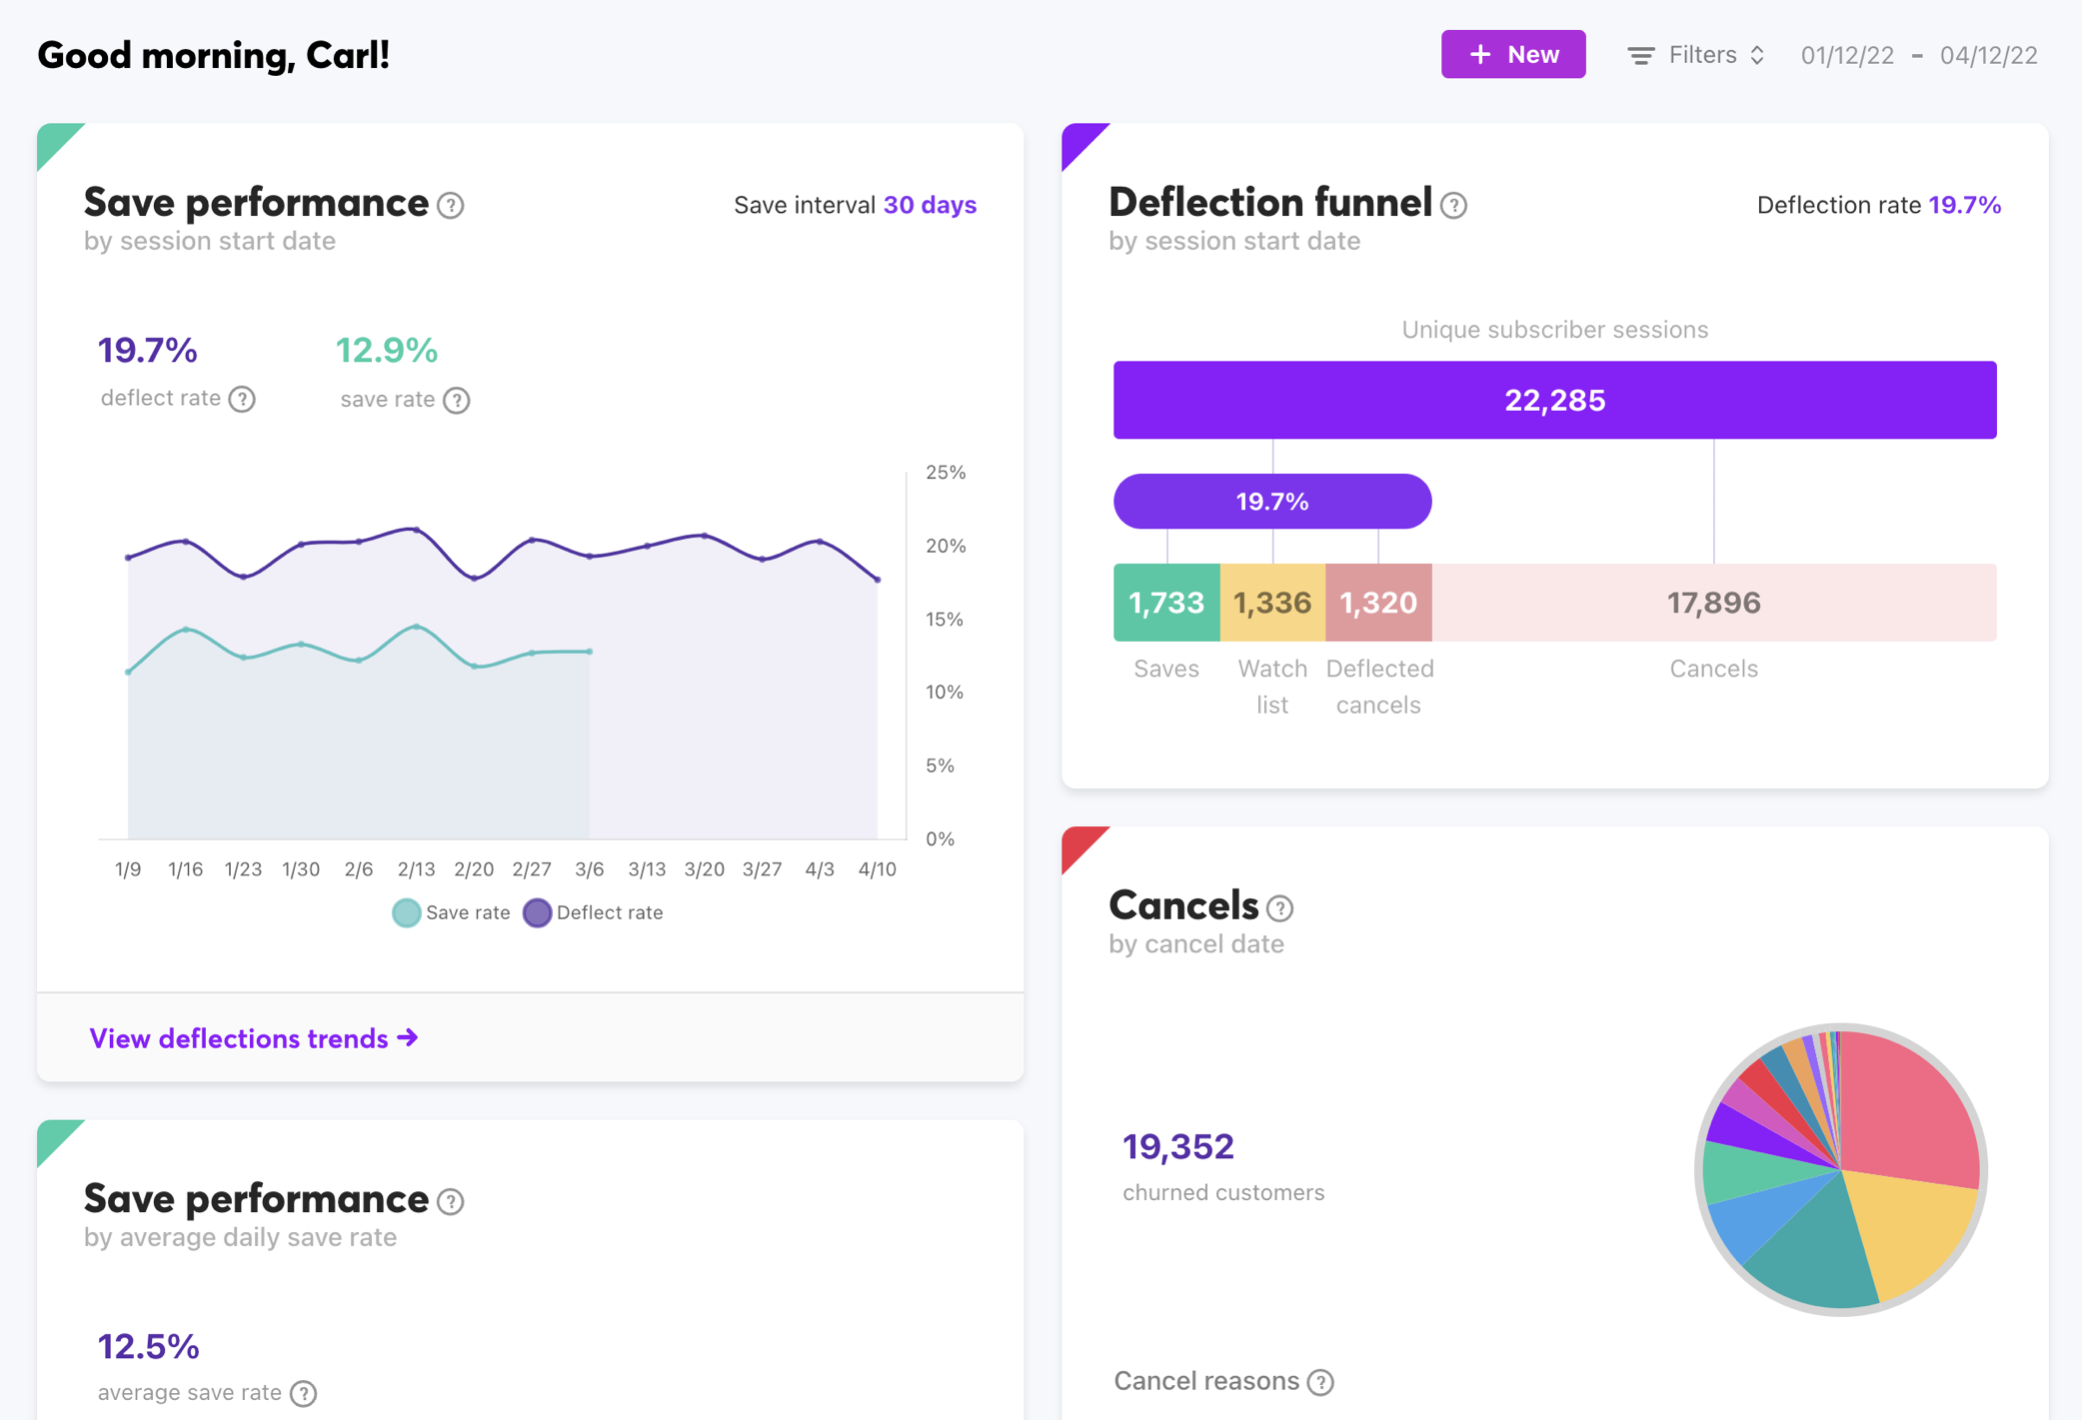
The Save Performance Report helps you to monitor changes in your Save and Deflect Rates over time. Compare Save Performance before and after making changes in your Cancel Flow to assess the impact of changes and analyze the results.
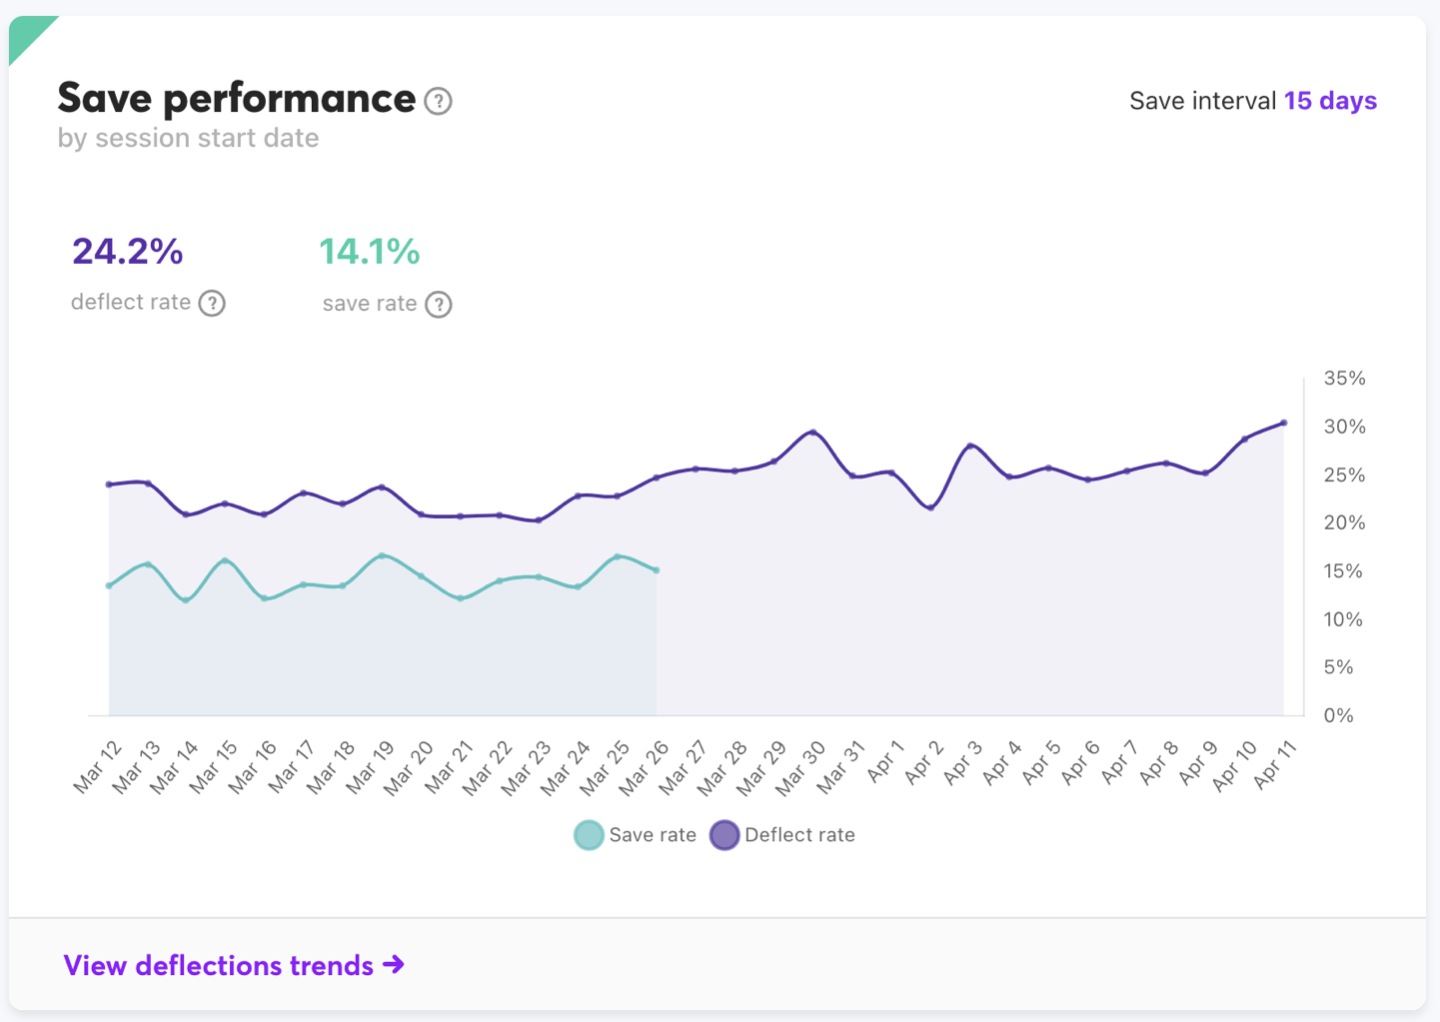
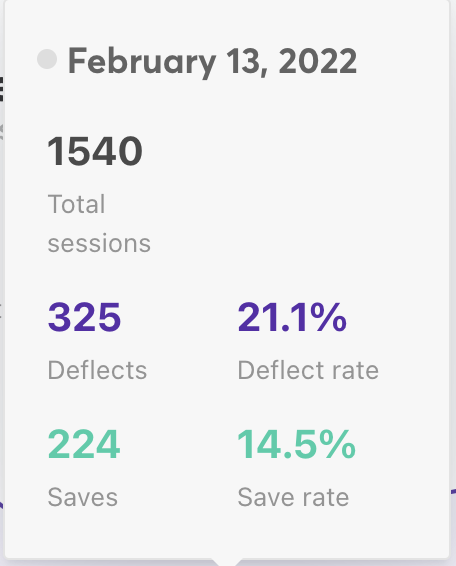
The Save Performance Report plots the save rate and deflect rate for each day/week/month depending upon the time period selected. This report will match your Save Performance Trends report, and the Deflect Rate here will be consistent with your Deflection Funnel and Experience Performance reports. View any period individual Save Rate by hovering over the plot point.
Deflection Funnel
The Deflection Performance Report presents a breakdown of your Cancel Page performance by outcome, showing how many unique accounts visited your Cancel Page during a given time, and what happened to them.
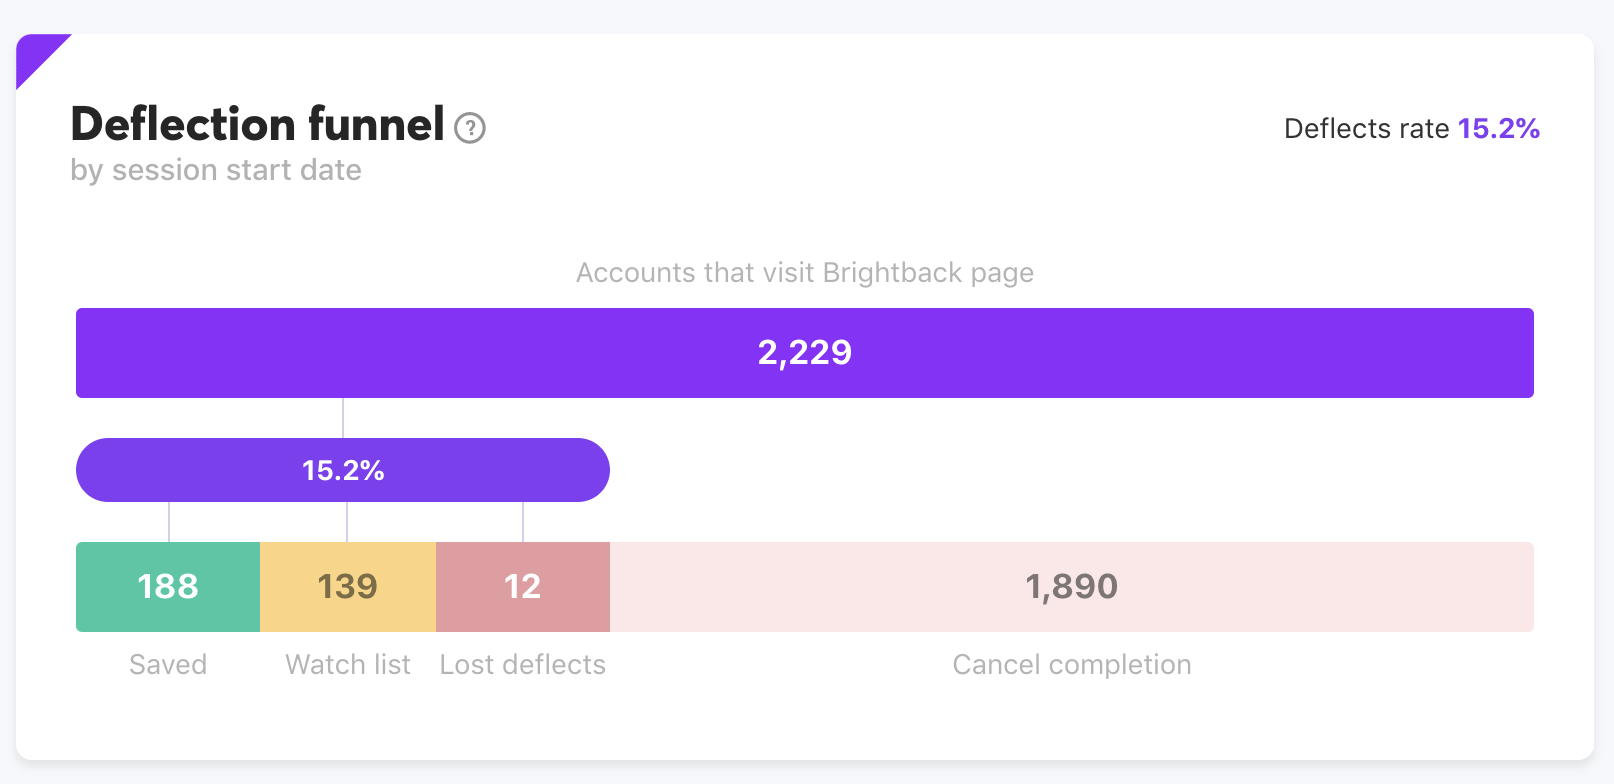
The 15.2% shown in the middle bar here represents the Deflect Rate, and will align with your Deflection Trends Report Deflect Rate. You can see the breakdown of the total deflects by hovering over the bar.
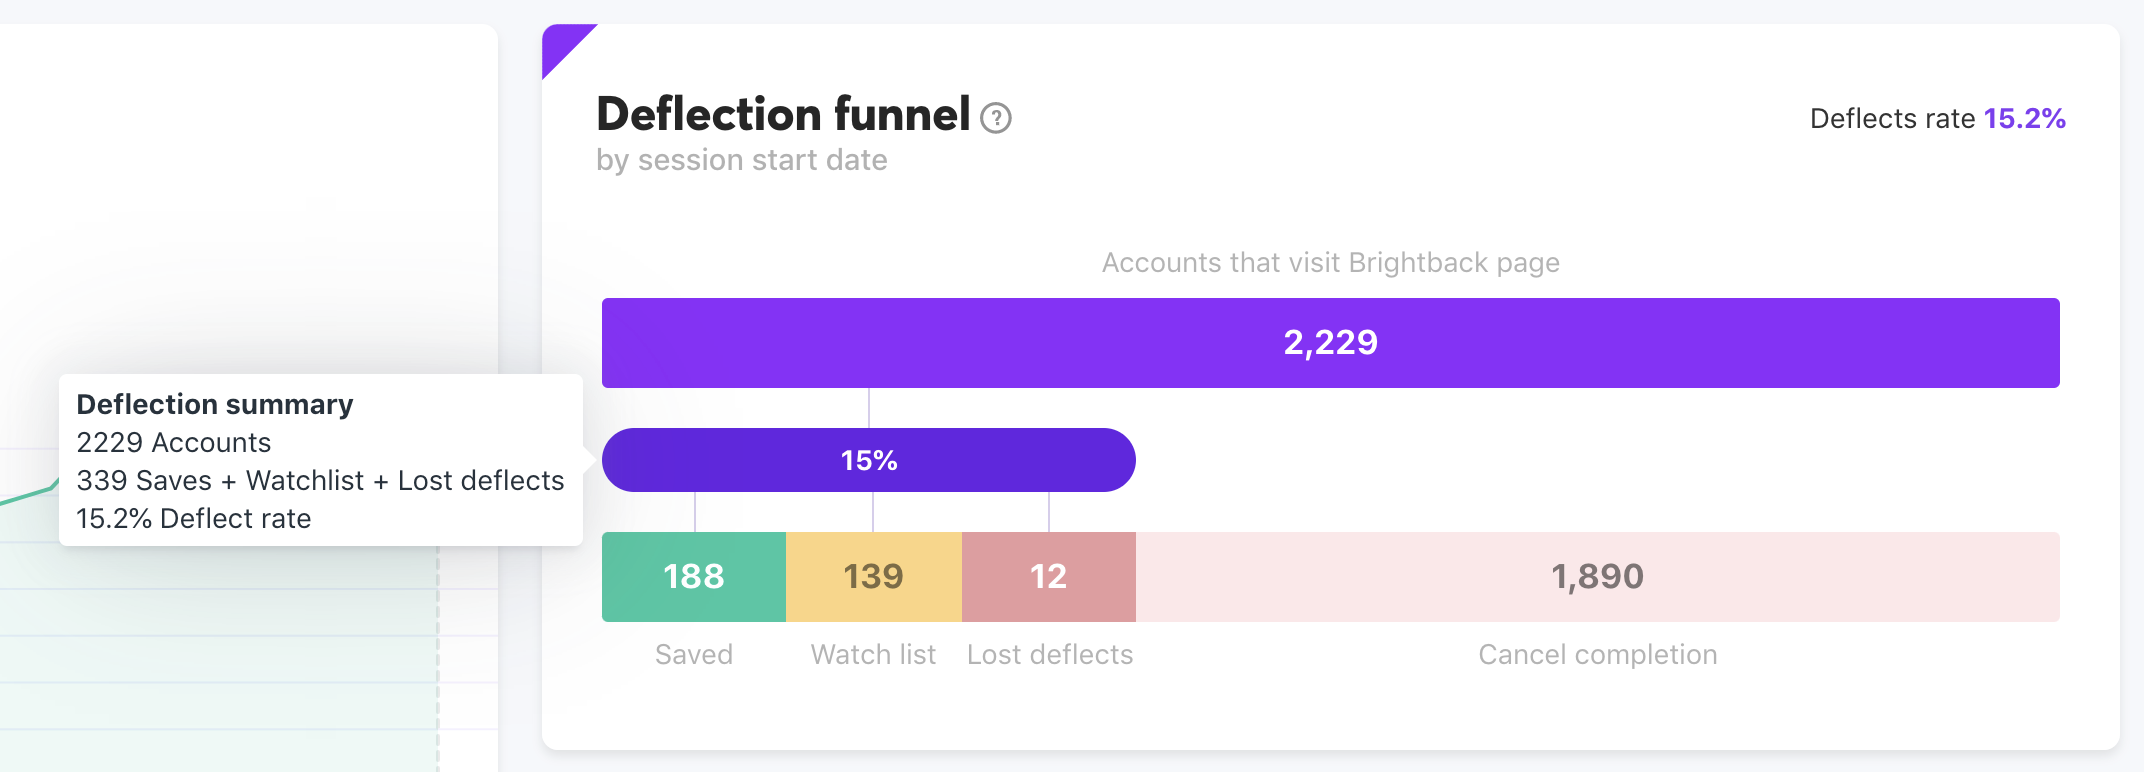
This report also shows the Lost deflects, these users are the ones who canceled after originally deflecting, in other words, users on the Watch List who canceled. This number represents the key difference in your Deflect and Save Rates in Chargebee Retention, as users who canceled off the watch list are not saved. Thus your Save Rate will always be slightly lower than your Deflect Rate.
Cancels
The Cancels report showcases the overall makeup of high level Cancel Reasons over time by percentage. The total number of Canceled Accounts for that timeframe sits at the top of the chart.
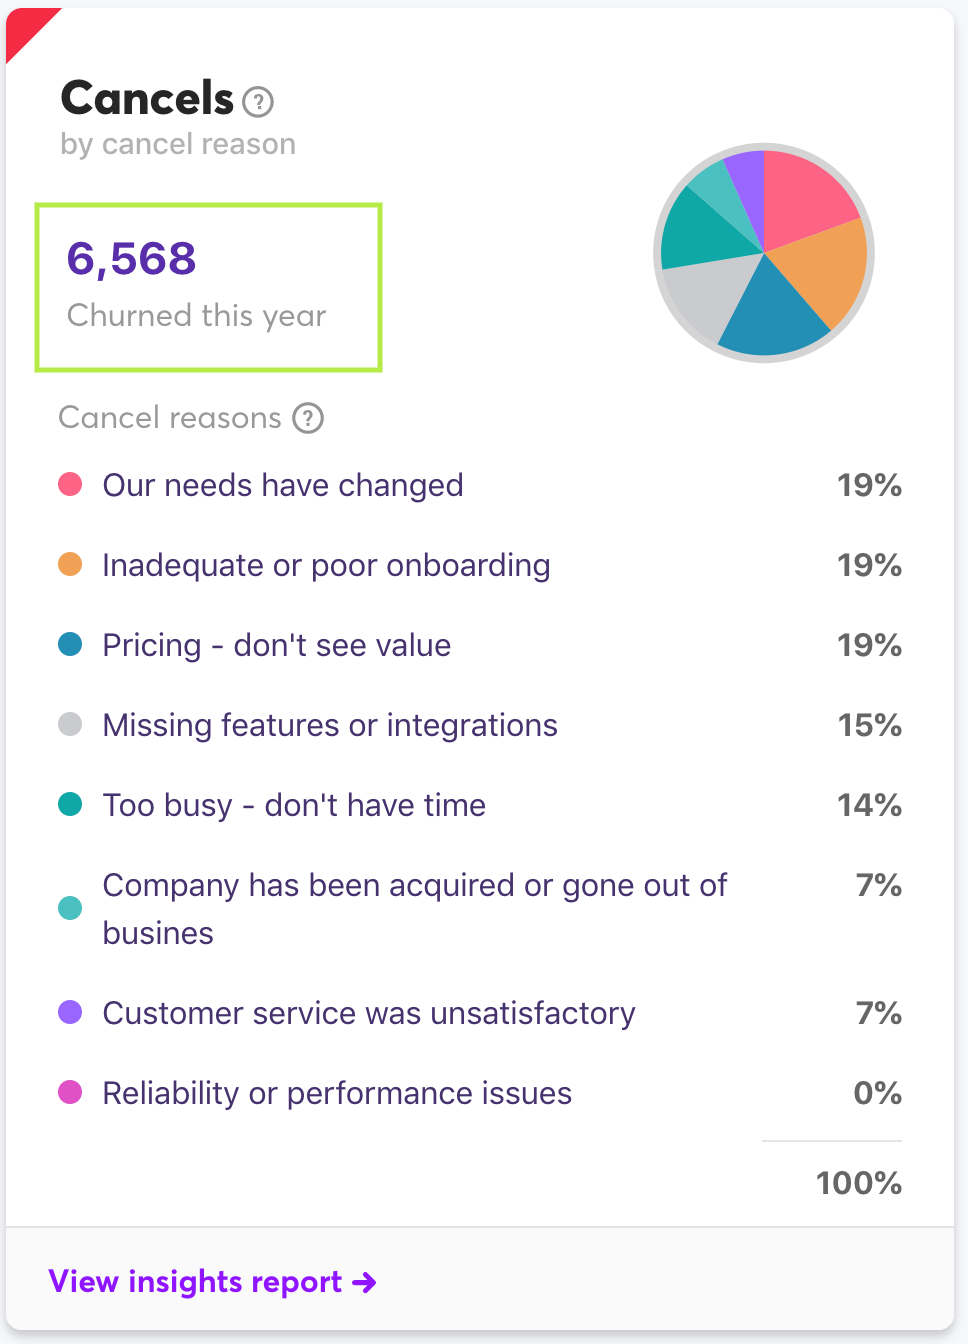
Hover over a slice in the pie chart to highlight the Cancel Reason it represents, or hover over any Cancel Reason to pull out the pie chart slice.
Clicking on a Cancel Reason brings you to the Insights Report for more in depth reporting on Cancel Reasons.
Click View Insights Report to head directly to the Customers Report Canceled list to drill into Cancel Reason specifics and export the list.
Saves
The Saves report shows you trends in Saves over time. Chargebee Retention considers a customer Saved if they still have an active account 30 days after visiting your Chargebee Retention Cancel Page. View the total number of Saves for the selected time period in the top left corner of the dashboard card.
Mouse over any bar on the chart to see the number of Saves by a select time frame. The time period presented in the bar chart regroups based on the length of time period selected.
If a full year is selected in the date picker, each bar represents Saves for one month, periods less than 6 months group Saves by weeks.
Click View Trends Report to head to the Saved Customers Trends Report to break down your Saves by the Category of Reason offered, the specific Reason they accepted an Offer for to deflect, or the Last Action they took.
Active Watch list
The Active Watch list report shows you the five most recent customers that hit your Cancel Page but did not proceed to cancel as well as the total count of customers on the watch list at any given time. Note that the Watch list total count will not filter by date, as it is a static total of what is currently on the watch list.
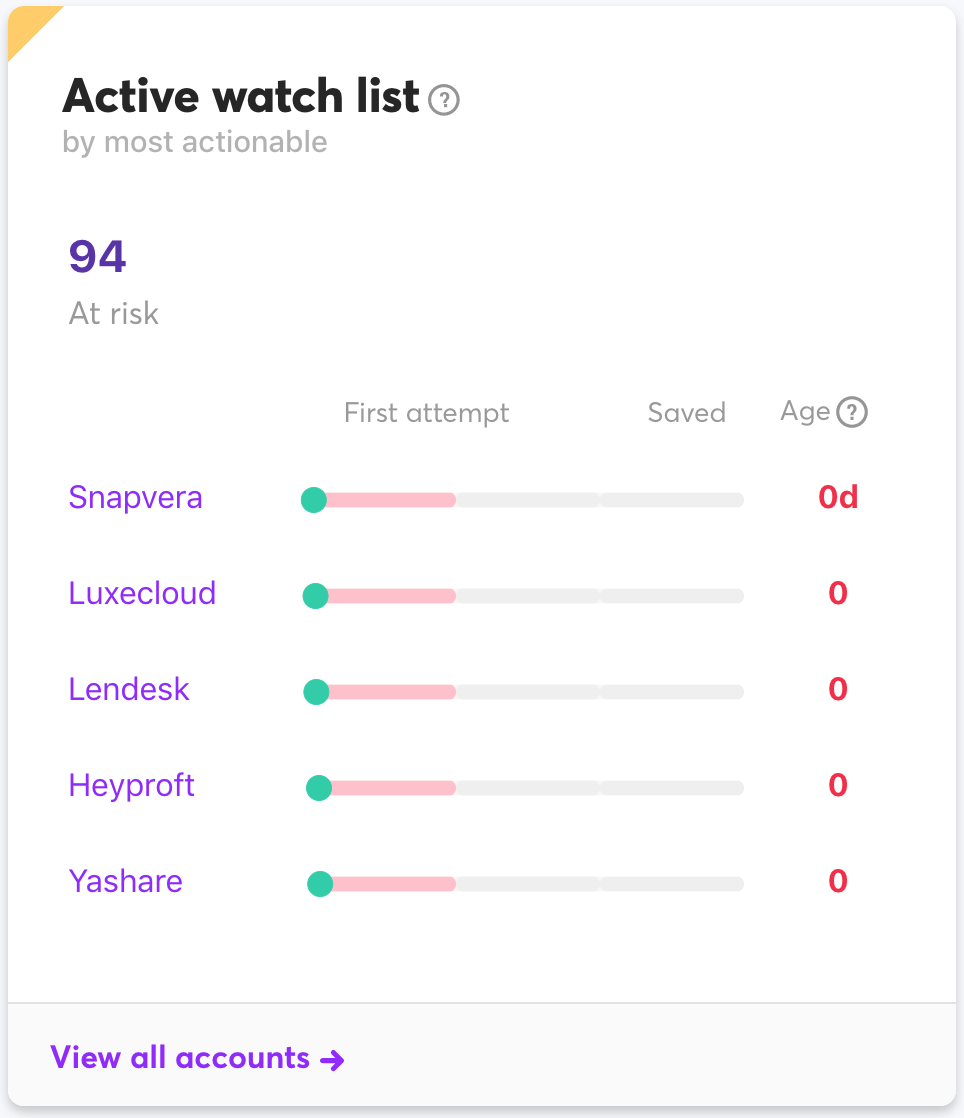
- First attempt shows how many times the customer has visited the Cancel Page
- Saved shows if the customer has been Saved since visiting the Cancel Page
- Age calculates the time from when the customer landed on the Cancel Page
Clicking View all Accounts brings you to the Customers Watchlist Report to export the list.
Was this article helpful?