Cancel Insights
Overview
The Cancel Insights Report in Chargebee Growth helps you understand why customers choose to cancel or downgrade by aggregating feedback collected during the cancellation journey. It transforms raw responses from your Cancel Page into structured, actionable insights that can be analyzed across different dimensions.
This report is designed for product, growth, and customer success teams who want to identify the root causes of churn and prioritize improvements. By combining customer-stated reasons with high-level performance metrics, the report enables you to connect what users are doing (canceling or staying) with why they are doing it.
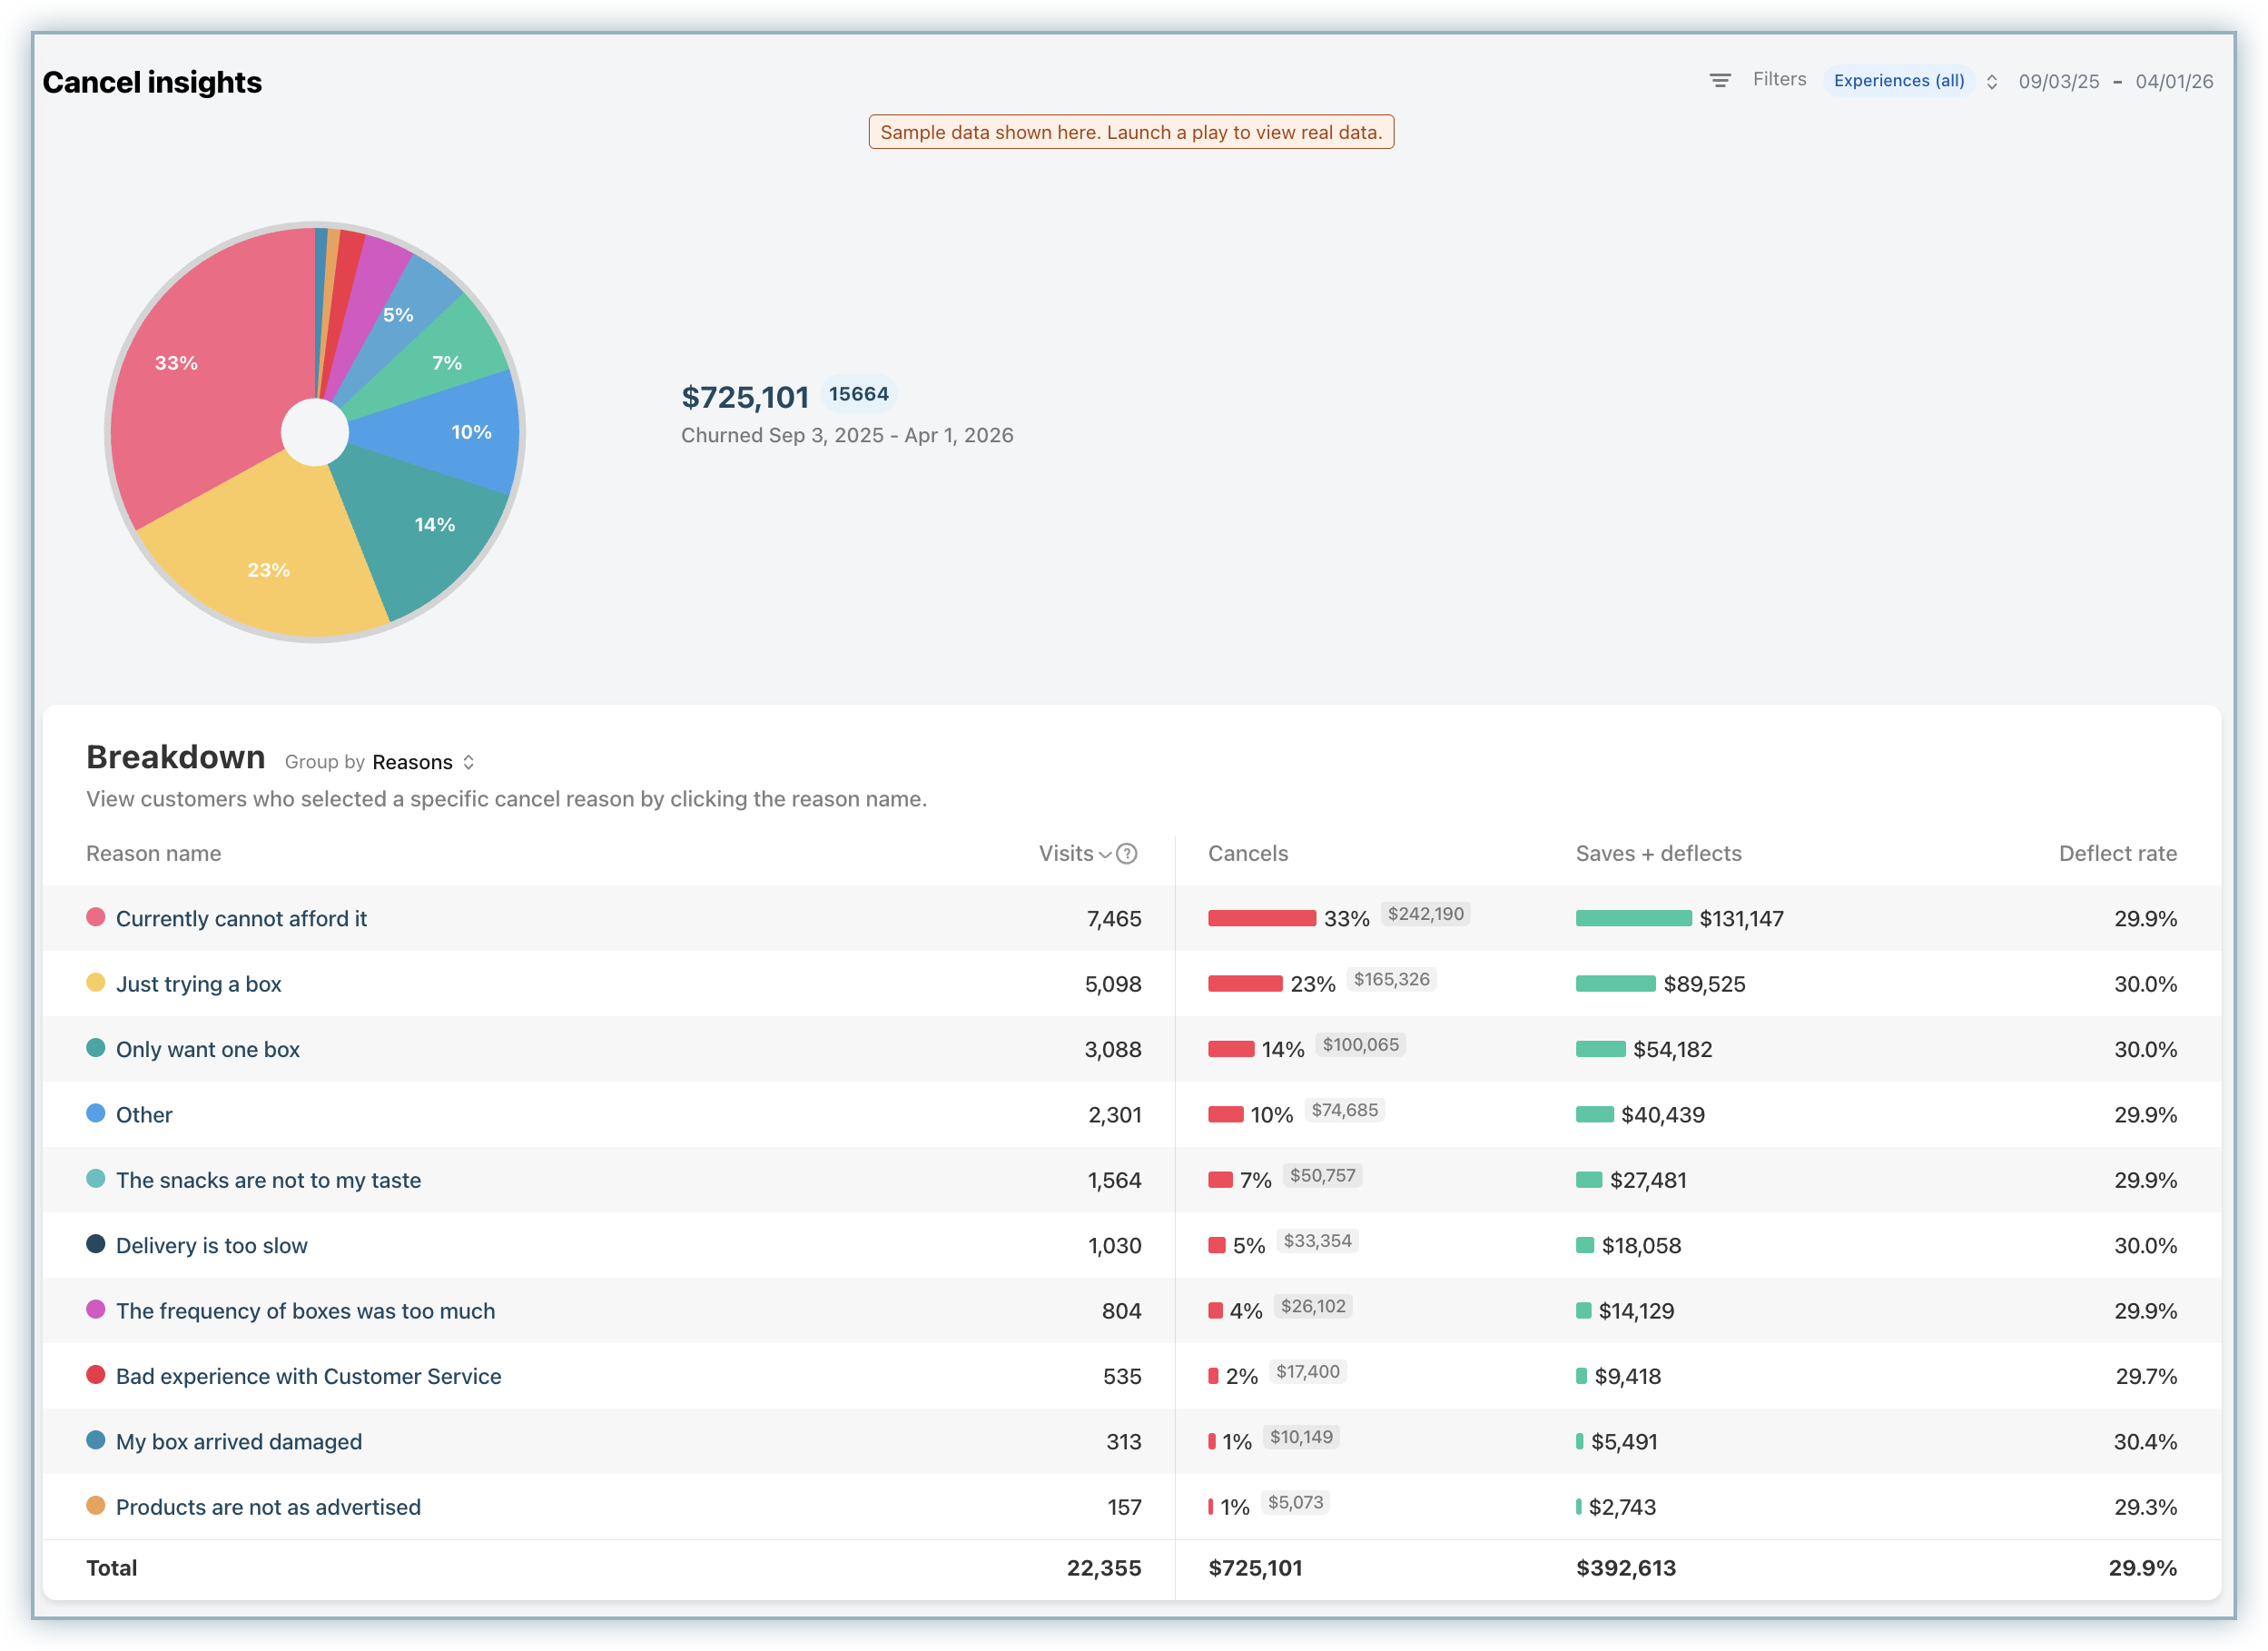
At a glance, the report provides a summary of key metrics such as the number of Cancel Page visits, total cancels, saves, and deflect rate. From there, you can explore trends in customer feedback and break down cancellation reasons to uncover patterns and opportunities for improvement.
Understanding the Cancel Insights Report
The Cancel Insights report collects and organizes the reasons customers provide when they cancel through the Chargebee Growth Cancel Page. These responses are presented in a structured format that allows you to quickly interpret customer sentiment and identify recurring issues.
Note
To access the Cancel Insights report, navigate to Reports > Insight > Cancels from the left pane.
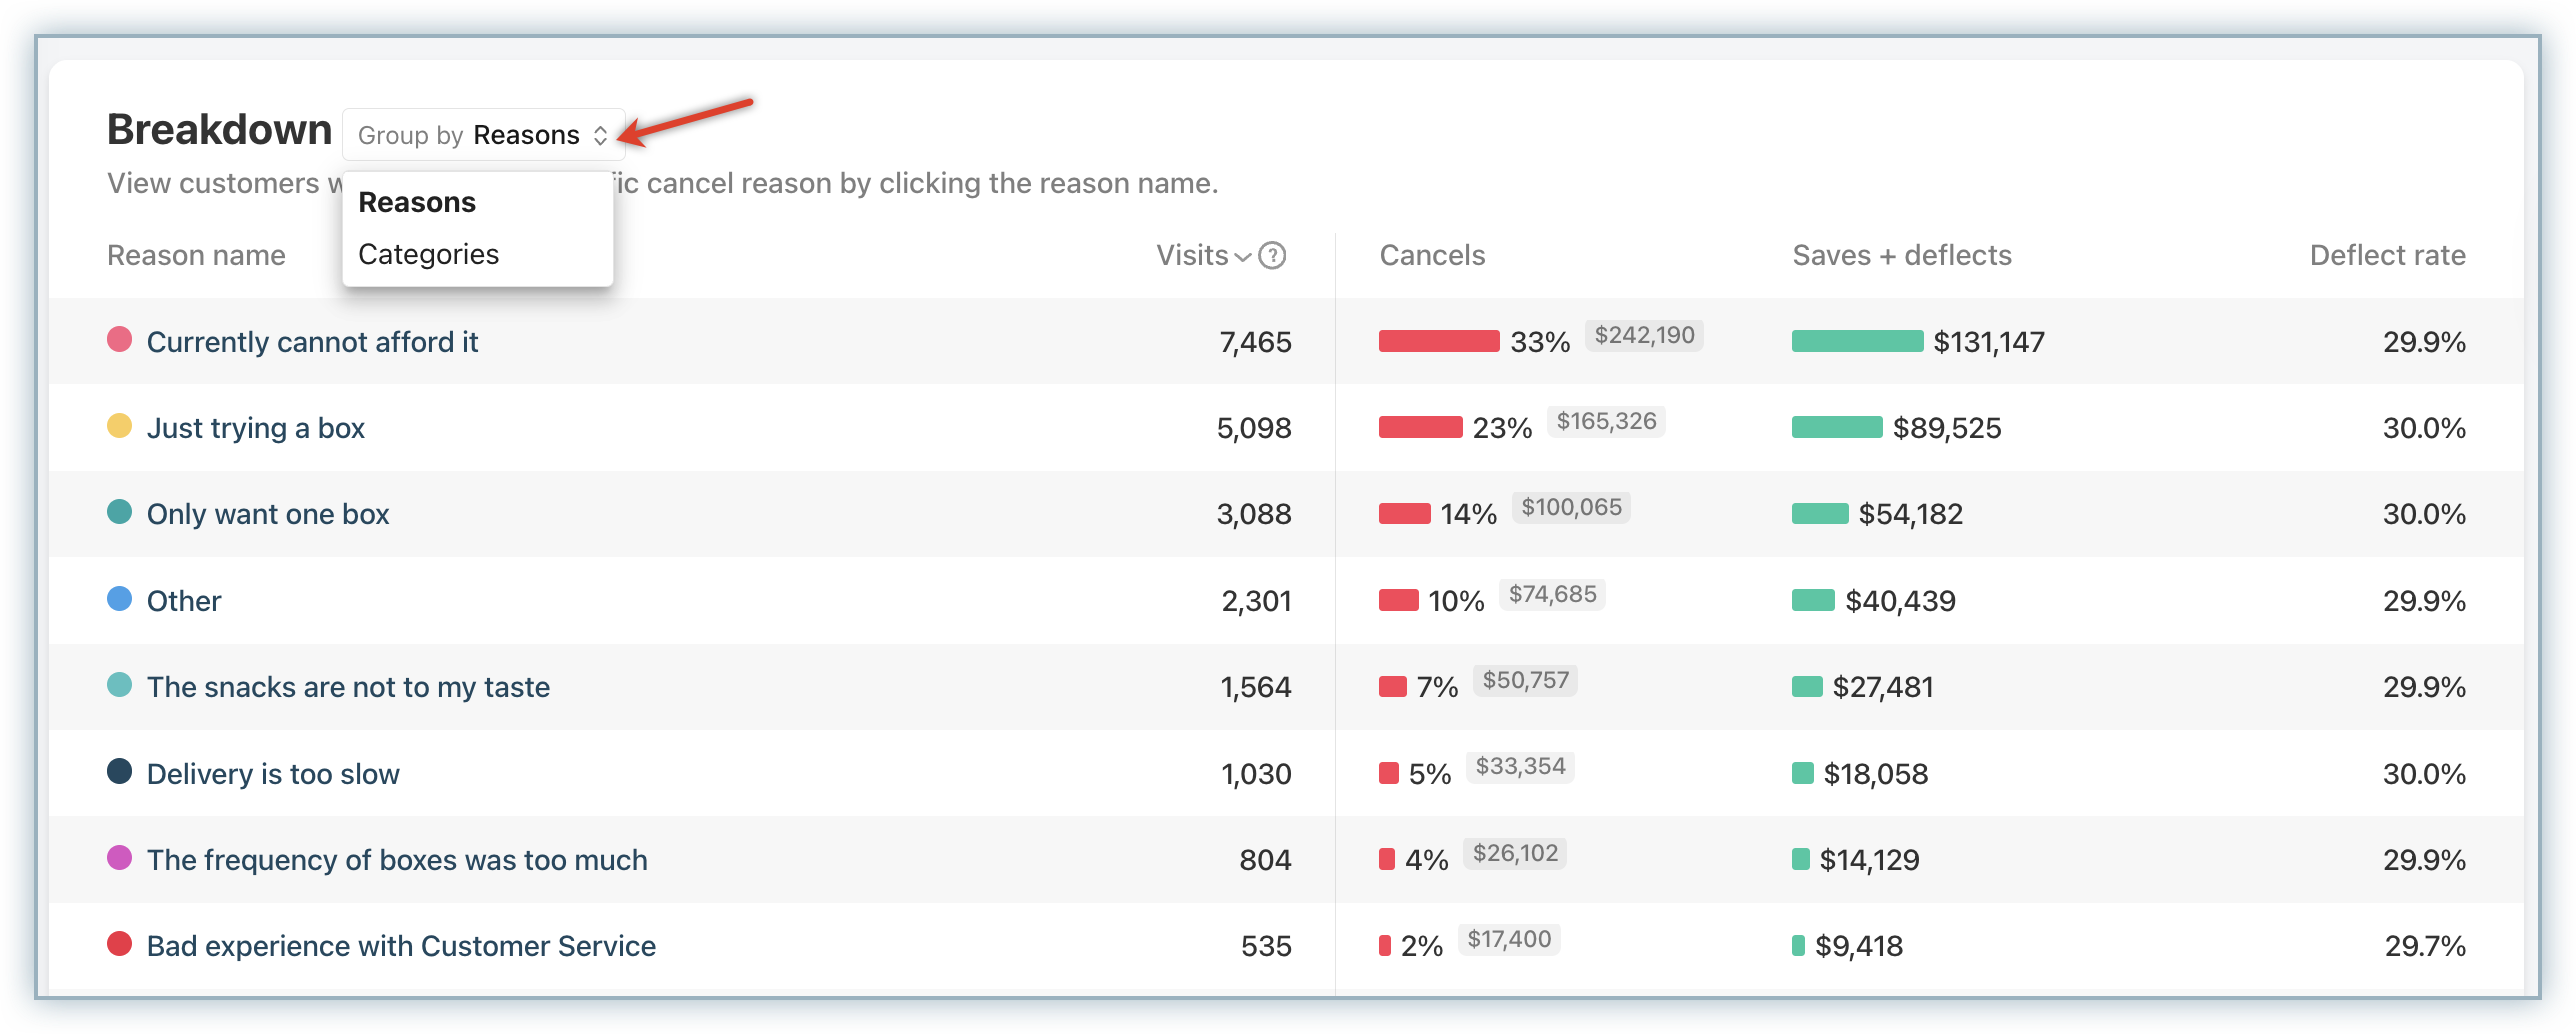
A key concept in this report is the distinction between Reasons and Categories.
A Reason represents the specific, customer-facing option selected during the cancellation survey. These are tailored to your business and reflect the exact feedback provided by users. For example, a customer might select a reason such as “Never got setup” or “Customer service was unsatisfactory.”
A Category, on the other hand, is a broader grouping that organizes related reasons into themes such as Pricing, Product, Customer Experience, Company, Execution, Needs, or Shipping and Handling. Categories help you analyze trends at a higher level and identify which areas of your business are contributing most to churn.
For instance, both “Never got setup” and “Customer service was unsatisfactory” may fall under the Customer Experience category. While these reasons point to different underlying problems, such as onboarding gaps versus support quality, they can still be grouped together to highlight which team or function may need attention.
By combining detailed reasons with broader categories, the report allows you to analyze churn both at a granular level and from a strategic perspective.
Drilling into your Insights
The report also supports drill-down functionality, allowing you to move from aggregated data to specific customer records. When you click on a particular reason, the report displays a list of customers associated with that selection.
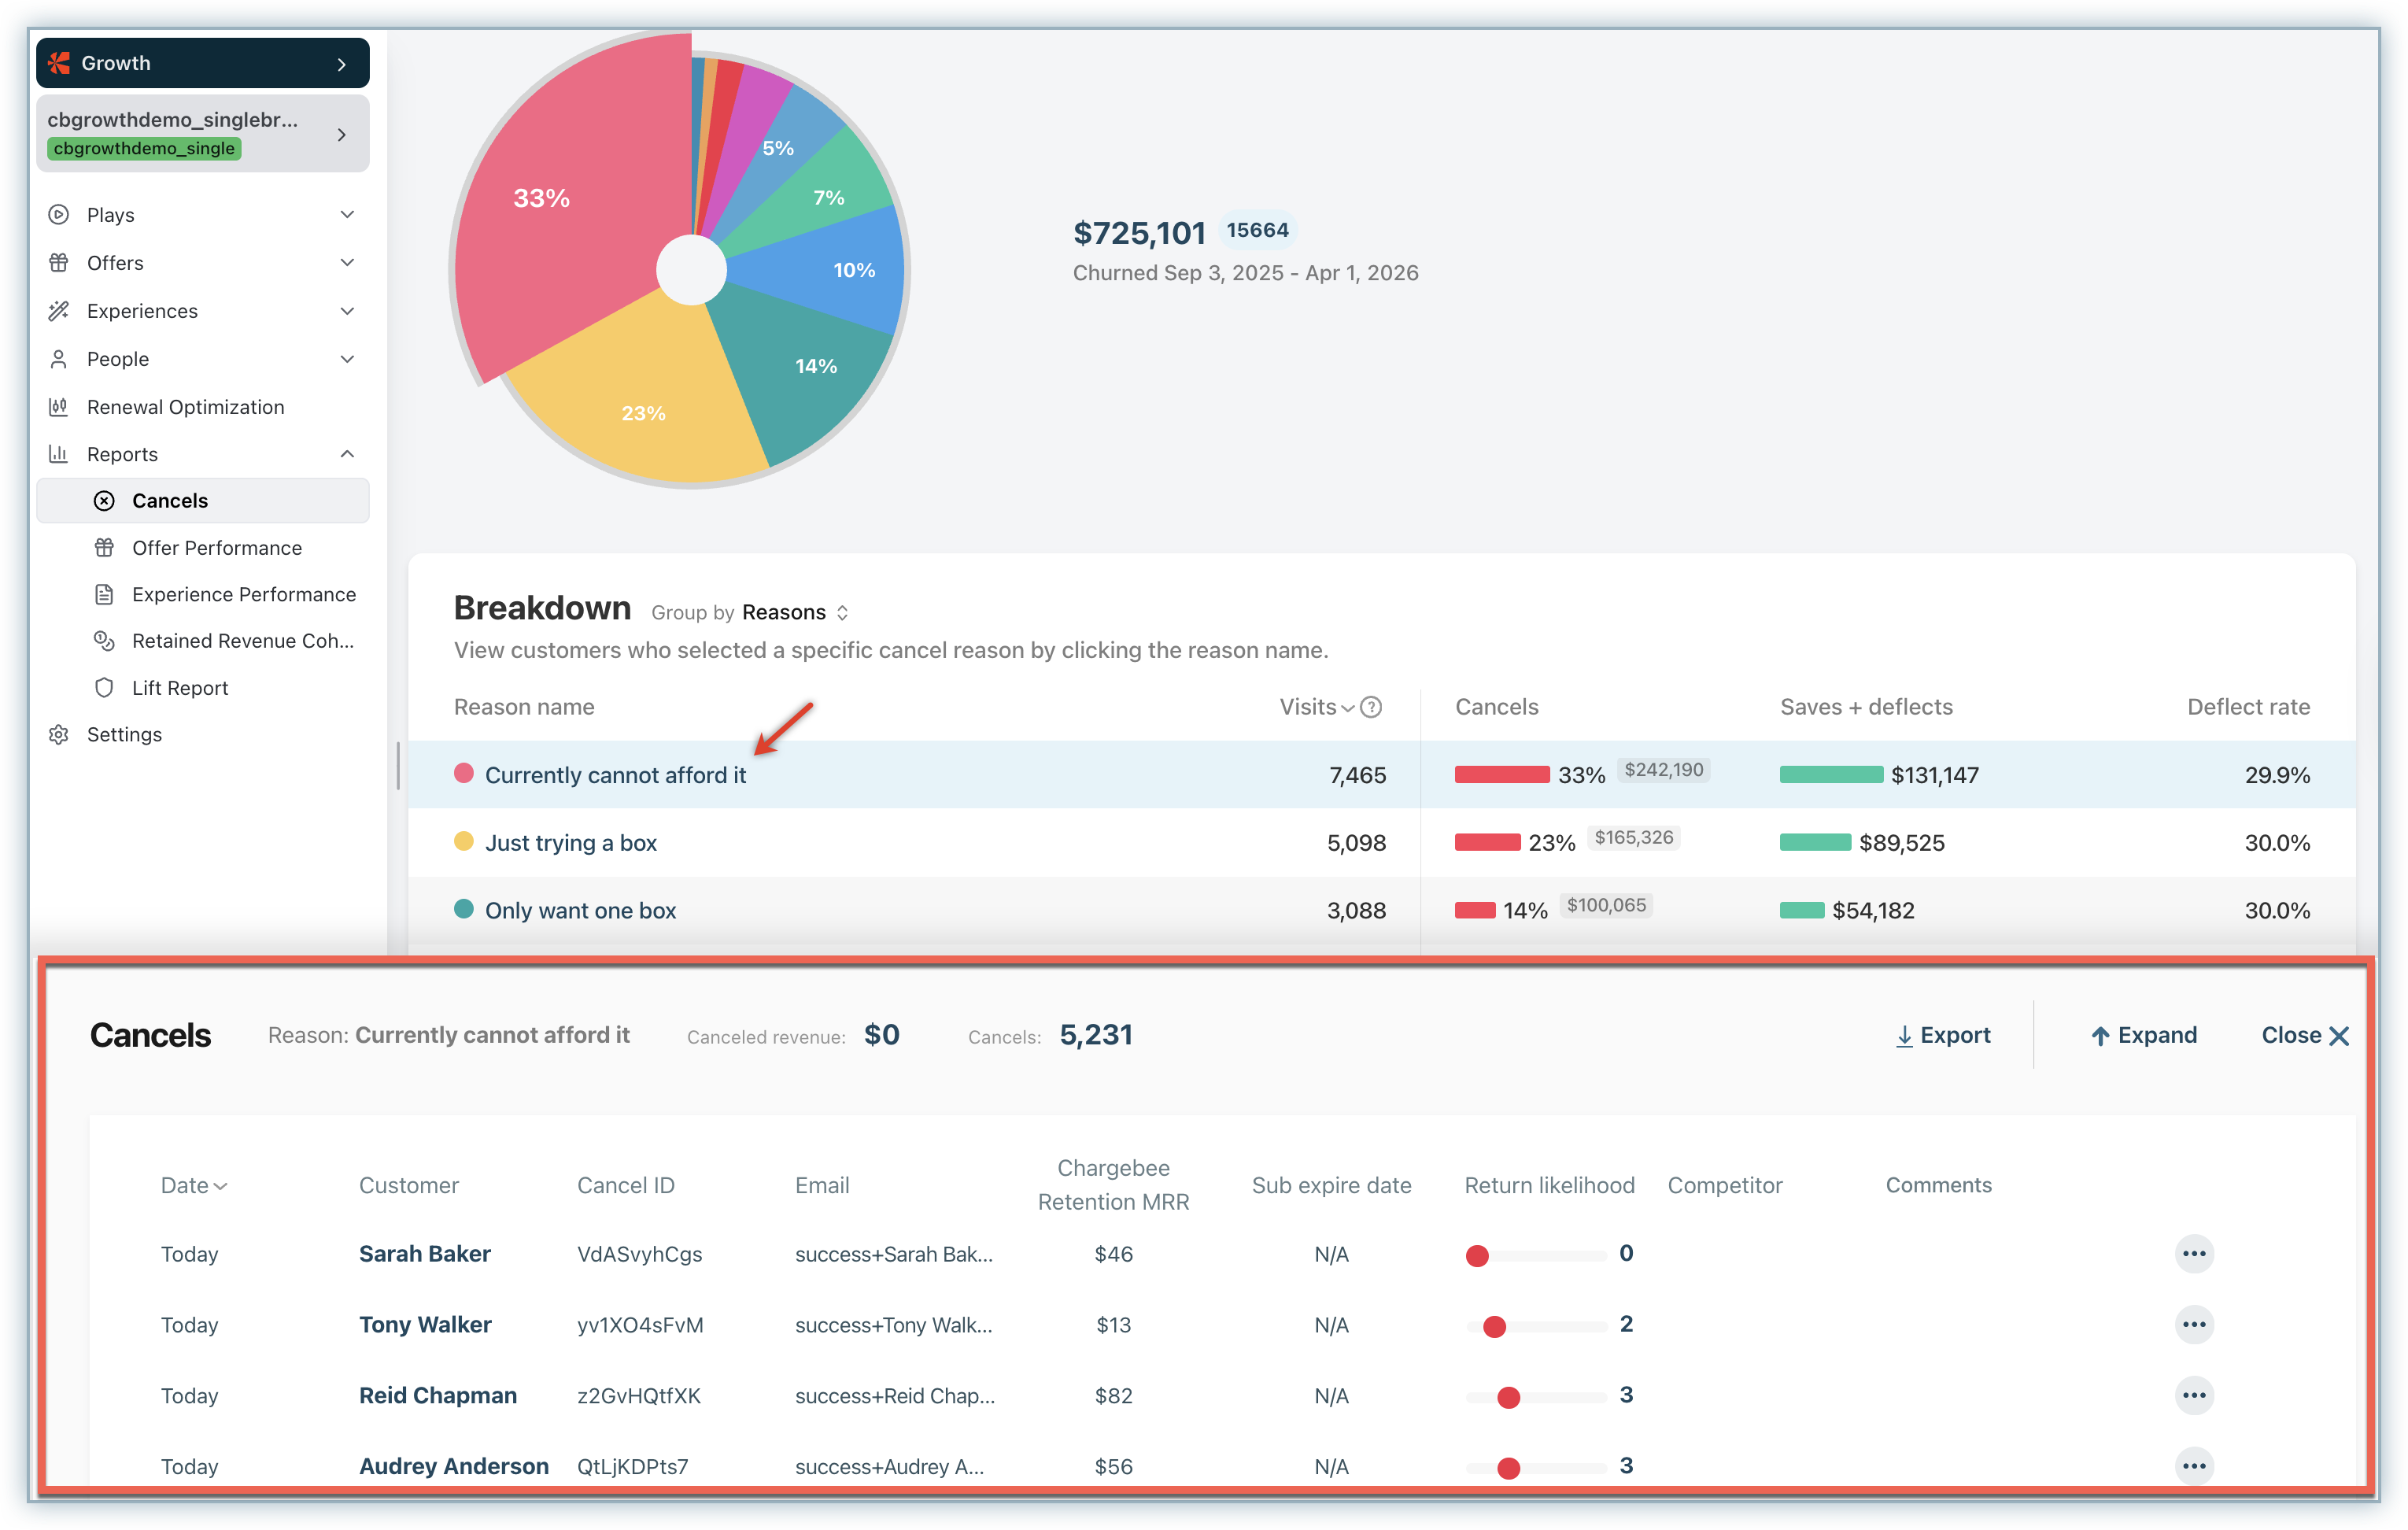
This capability is especially useful when you want to investigate a specific problem in more detail. For example, you can isolate customers who selected a reason like “Currently cannot afford it” and export that list for further analysis or targeted outreach with discounts, without including customers who left for unrelated reasons.
By drilling into individual reasons, you can validate trends, gather qualitative insights, and take more focused action to address the underlying causes of churn.
Note
Currently, export is only supported at the individual reason level and is not yet available at the overall insight report level.
Was this article helpful?