Experience Performance Report
Overview
The Experience Performance Report in Chargebee Growth provides a detailed view of how your cancellation experiences (pages) are performing across the customer journey. It enables you to evaluate the effectiveness of different experiences in driving deflection, saves, and overall retention outcomes.
This report is designed for growth, product, and customer success teams who want to optimize their cancel flows by understanding how different experiences, audiences, and strategies perform. By combining funnel metrics with flexible segmentation, the report helps you identify what is working, what is not, and where to focus your optimization efforts.
With this report, you can analyze traffic distribution across experiences, compare deflection performance, evaluate offer effectiveness, and measure the impact of experiments such as A/B tests or randomized offer strategies.
What You Can Analyze
The Experience Performance Report enables you to answer a wide range of performance-related questions about your cancel flows. For example, you can:
- Understand how much traffic each experience receives over a selected time period.
- Evaluate how effectively each experience drives deflection and retention.
- Identify which experiences perform best for offers, loss aversion, and passive deflection strategies.
- Compare how different audiences respond to various experiences.
- Analyze how saves, cancels, and watchlist entries break down by experience, reason, or audience.
- Determine which cancel reasons have the highest offer accept rates.
- Identify which audiences have the highest deflect rates.
- Evaluate the performance of specific elements such as loss aversion cards.
- Measure the effectiveness of A/B tests and randomized offer experiments.
Understanding the Report Structure
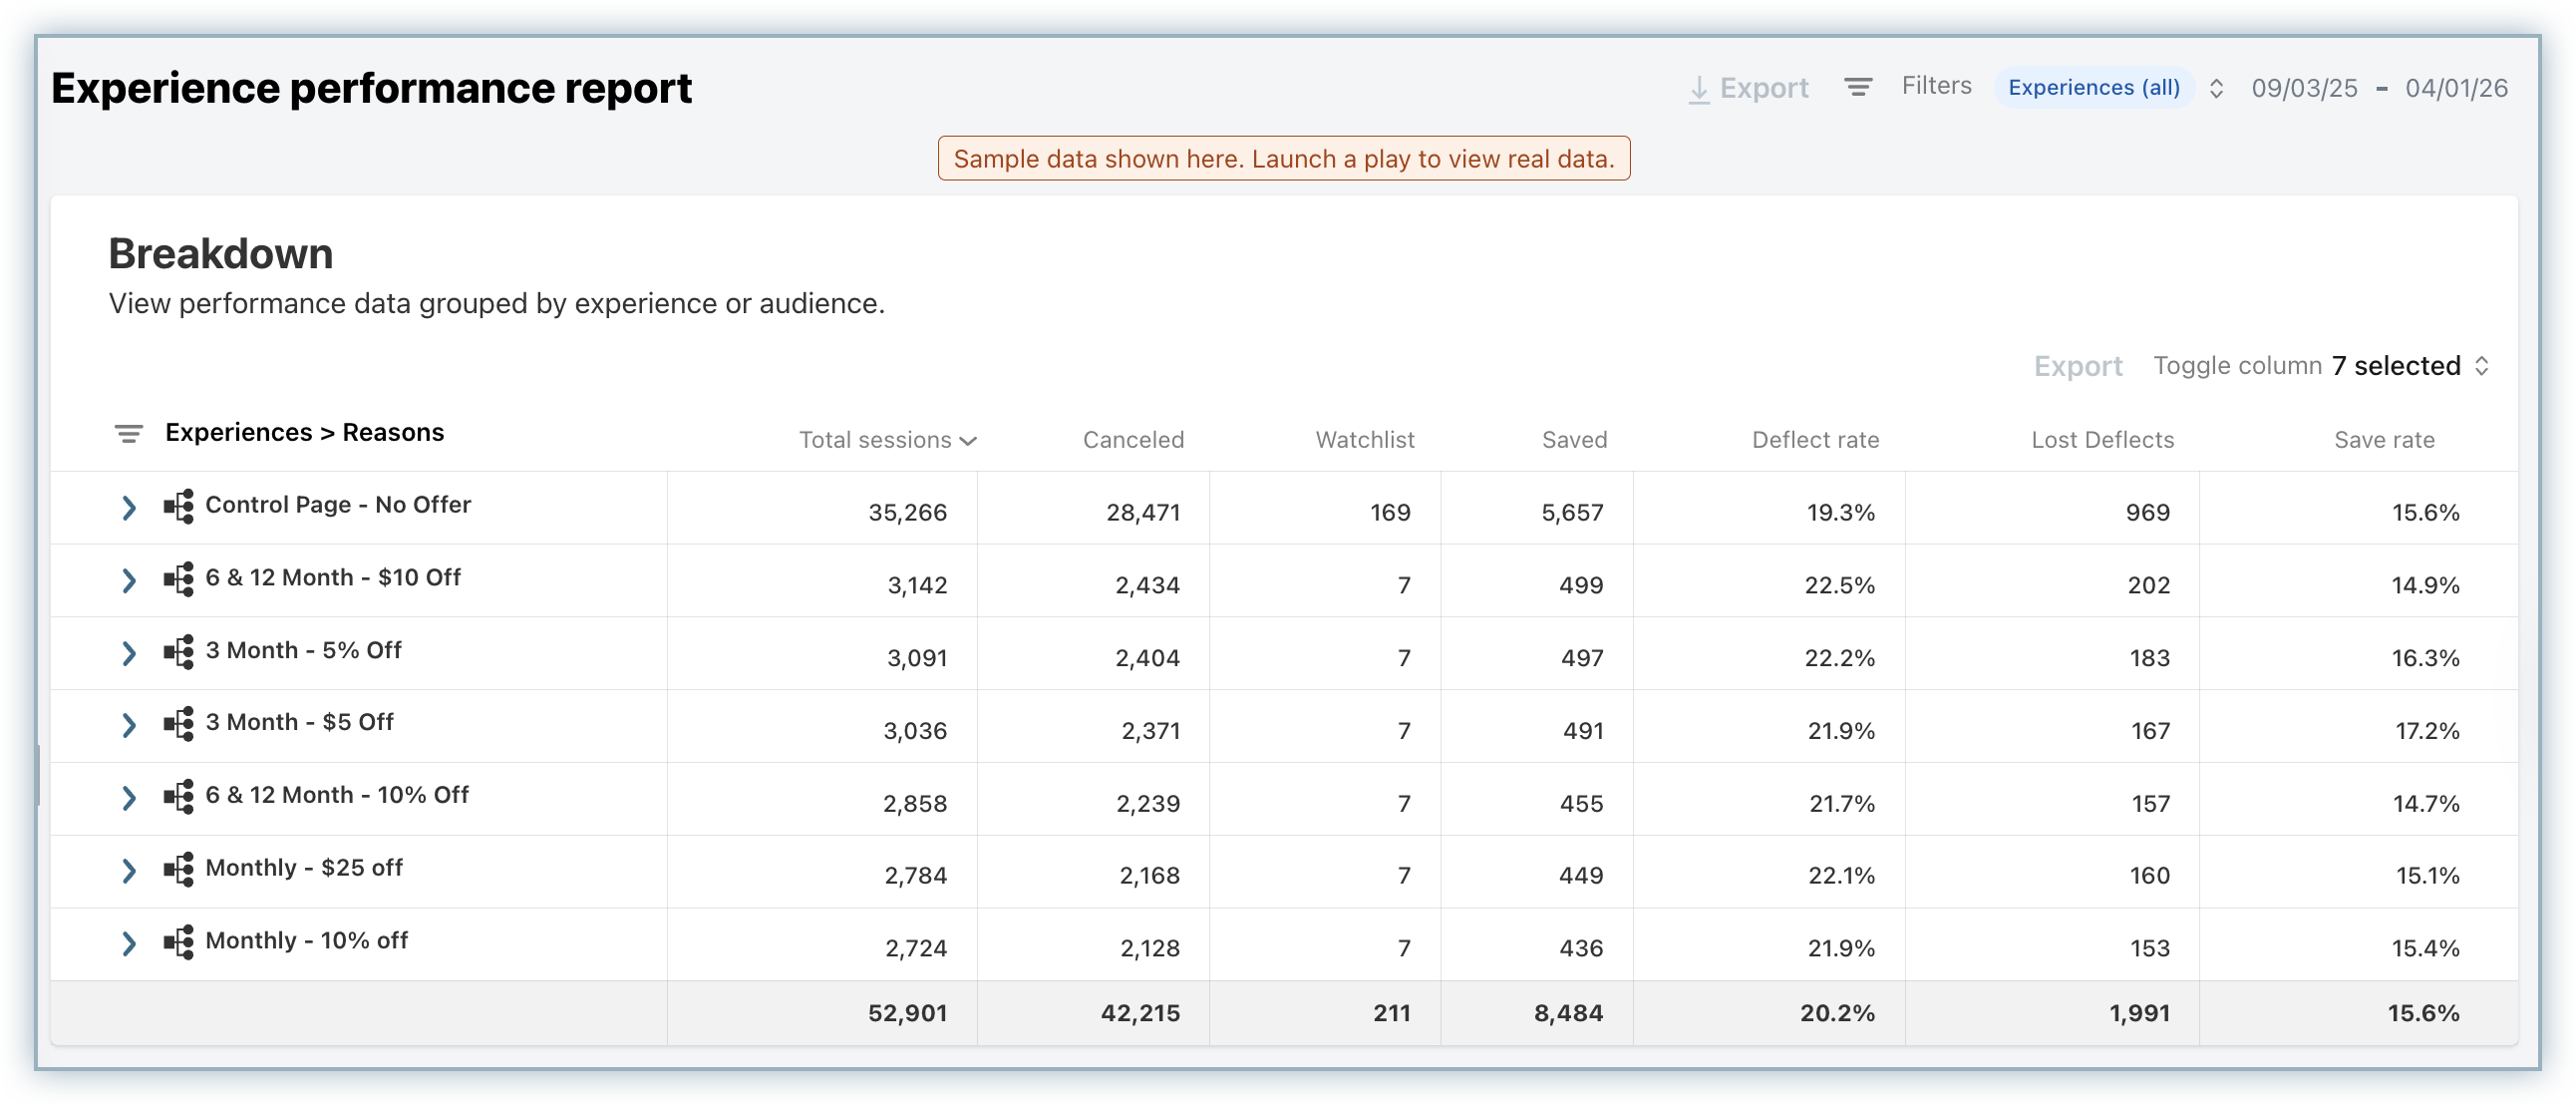
By default, the Experience Performance Report is grouped by Experiences and Reasons, giving you a view of how different cancel pages perform across various cancellation reasons.
This structure allows you to quickly identify which experiences are most effective for specific customer intents. For example, you can see how users selecting a particular cancel reason behave across different experiences, helping you tailor your retention strategies accordingly.
The report presents key deflection funnel metrics for each grouping, allowing you to evaluate performance at both a high level and in more granular detail.
Grouping and Breakdown Options
One of the most powerful aspects of the Experience Performance Report is its flexible grouping capability. You can customize how the data is displayed by selecting the grouping option in the report.
The report supports up to three levels of grouping, allowing you to analyze performance across combinations of dimensions such as Audience, Experience, and Reason. For example, a common configuration is to view data grouped by Audience and then by Experience, which helps you understand how different customer segments respond to specific cancel flows.
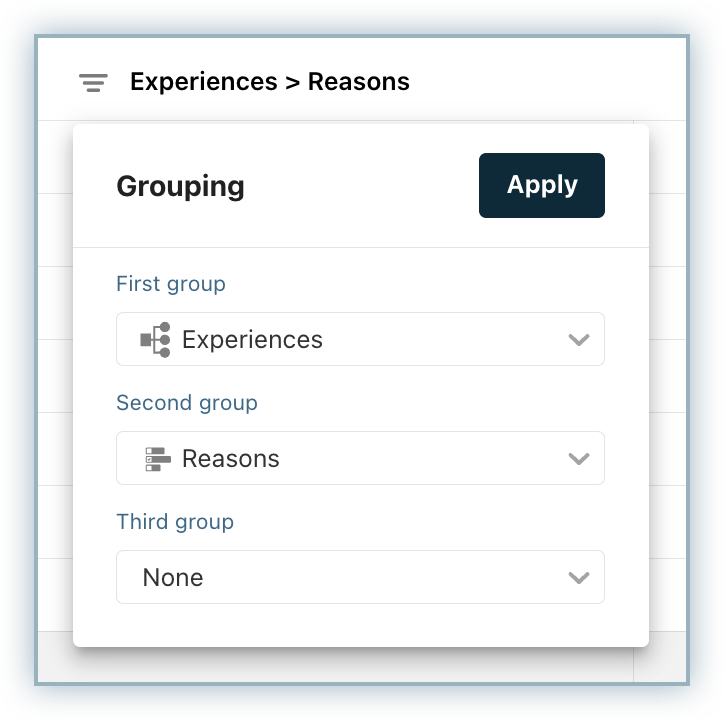
As you add groupings, the report dynamically updates and allows you to expand rows to view deeper breakdowns. This flexibility enables you to slice and dice the data in a way that aligns with your analysis goals.
Evaluating Performance Metrics
The report includes key deflection funnel metrics that help you measure how effectively your experiences are performing. These metrics allow you to track outcomes such as deflection, saves, cancels, and watchlist behavior across different groupings.
You can also customize the report by adding additional columns to analyze specific performance indicators, such as Offer Accept Rate and Passive Deflect Rate. This allows you to evaluate how different elements within your experiences, such as offers or messaging strategies, contribute to overall performance.
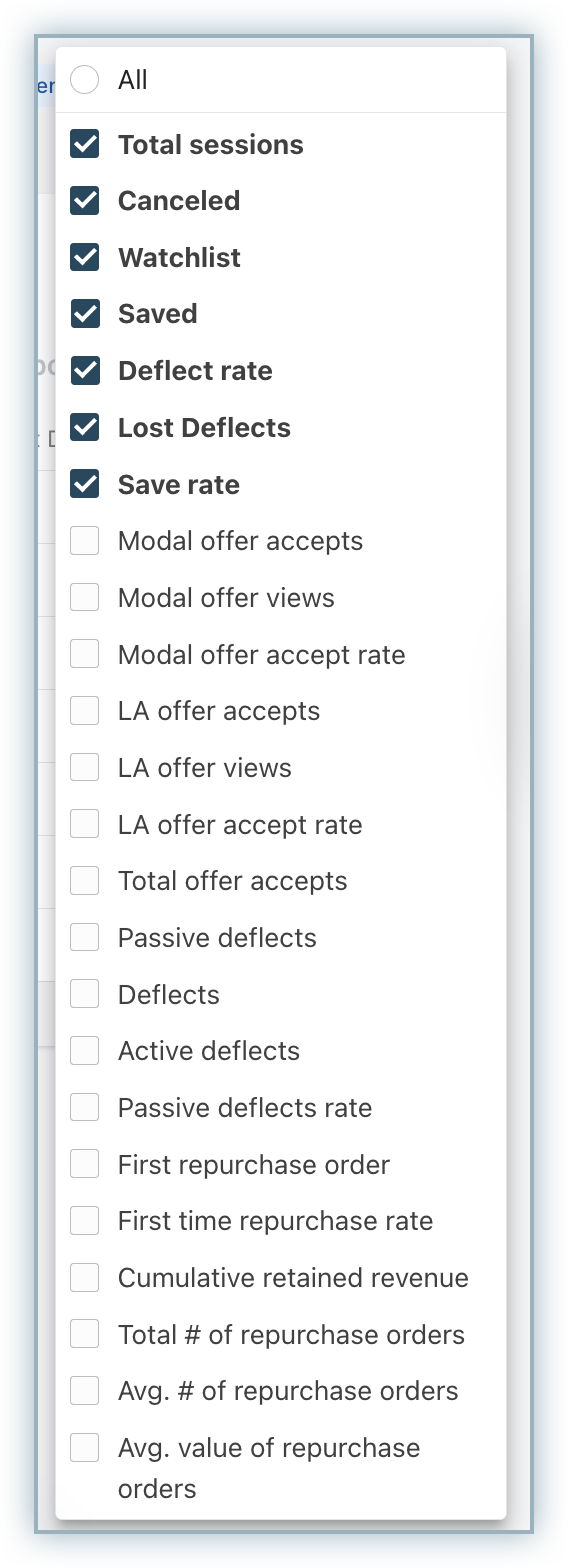
By combining flexible grouping with customizable metrics, the Experience Performance Report gives you a comprehensive view of how your cancel flows perform and where optimization opportunities exist.
Was this article helpful?