Offer Performance Report
Overview
The Offer Performance Report in Chargebee Growth helps you evaluate how effectively your acquisition, expansion, and retention offers influence customer decisions at various touch points. It provides detailed insights into how customers interact with different offers presented in your Chargebee Growth experiences, enabling you to understand which strategies are driving sales, saves, and revenue.
This report is designed for growth, product, and customer success teams who want to optimize retention strategies by analyzing offer-level performance. By combining engagement metrics with outcomes such as accepts, saves, and revenue impact, the report allows you to identify which offers resonate most with customers and which need improvement.
You can access the Offer Performance Report from the Reports section in the left navigation. From there, you can explore performance at both a high level and in granular detail by grouping data across multiple dimensions such as audience, experience, and offer type.
Understanding Offer Performance Metrics
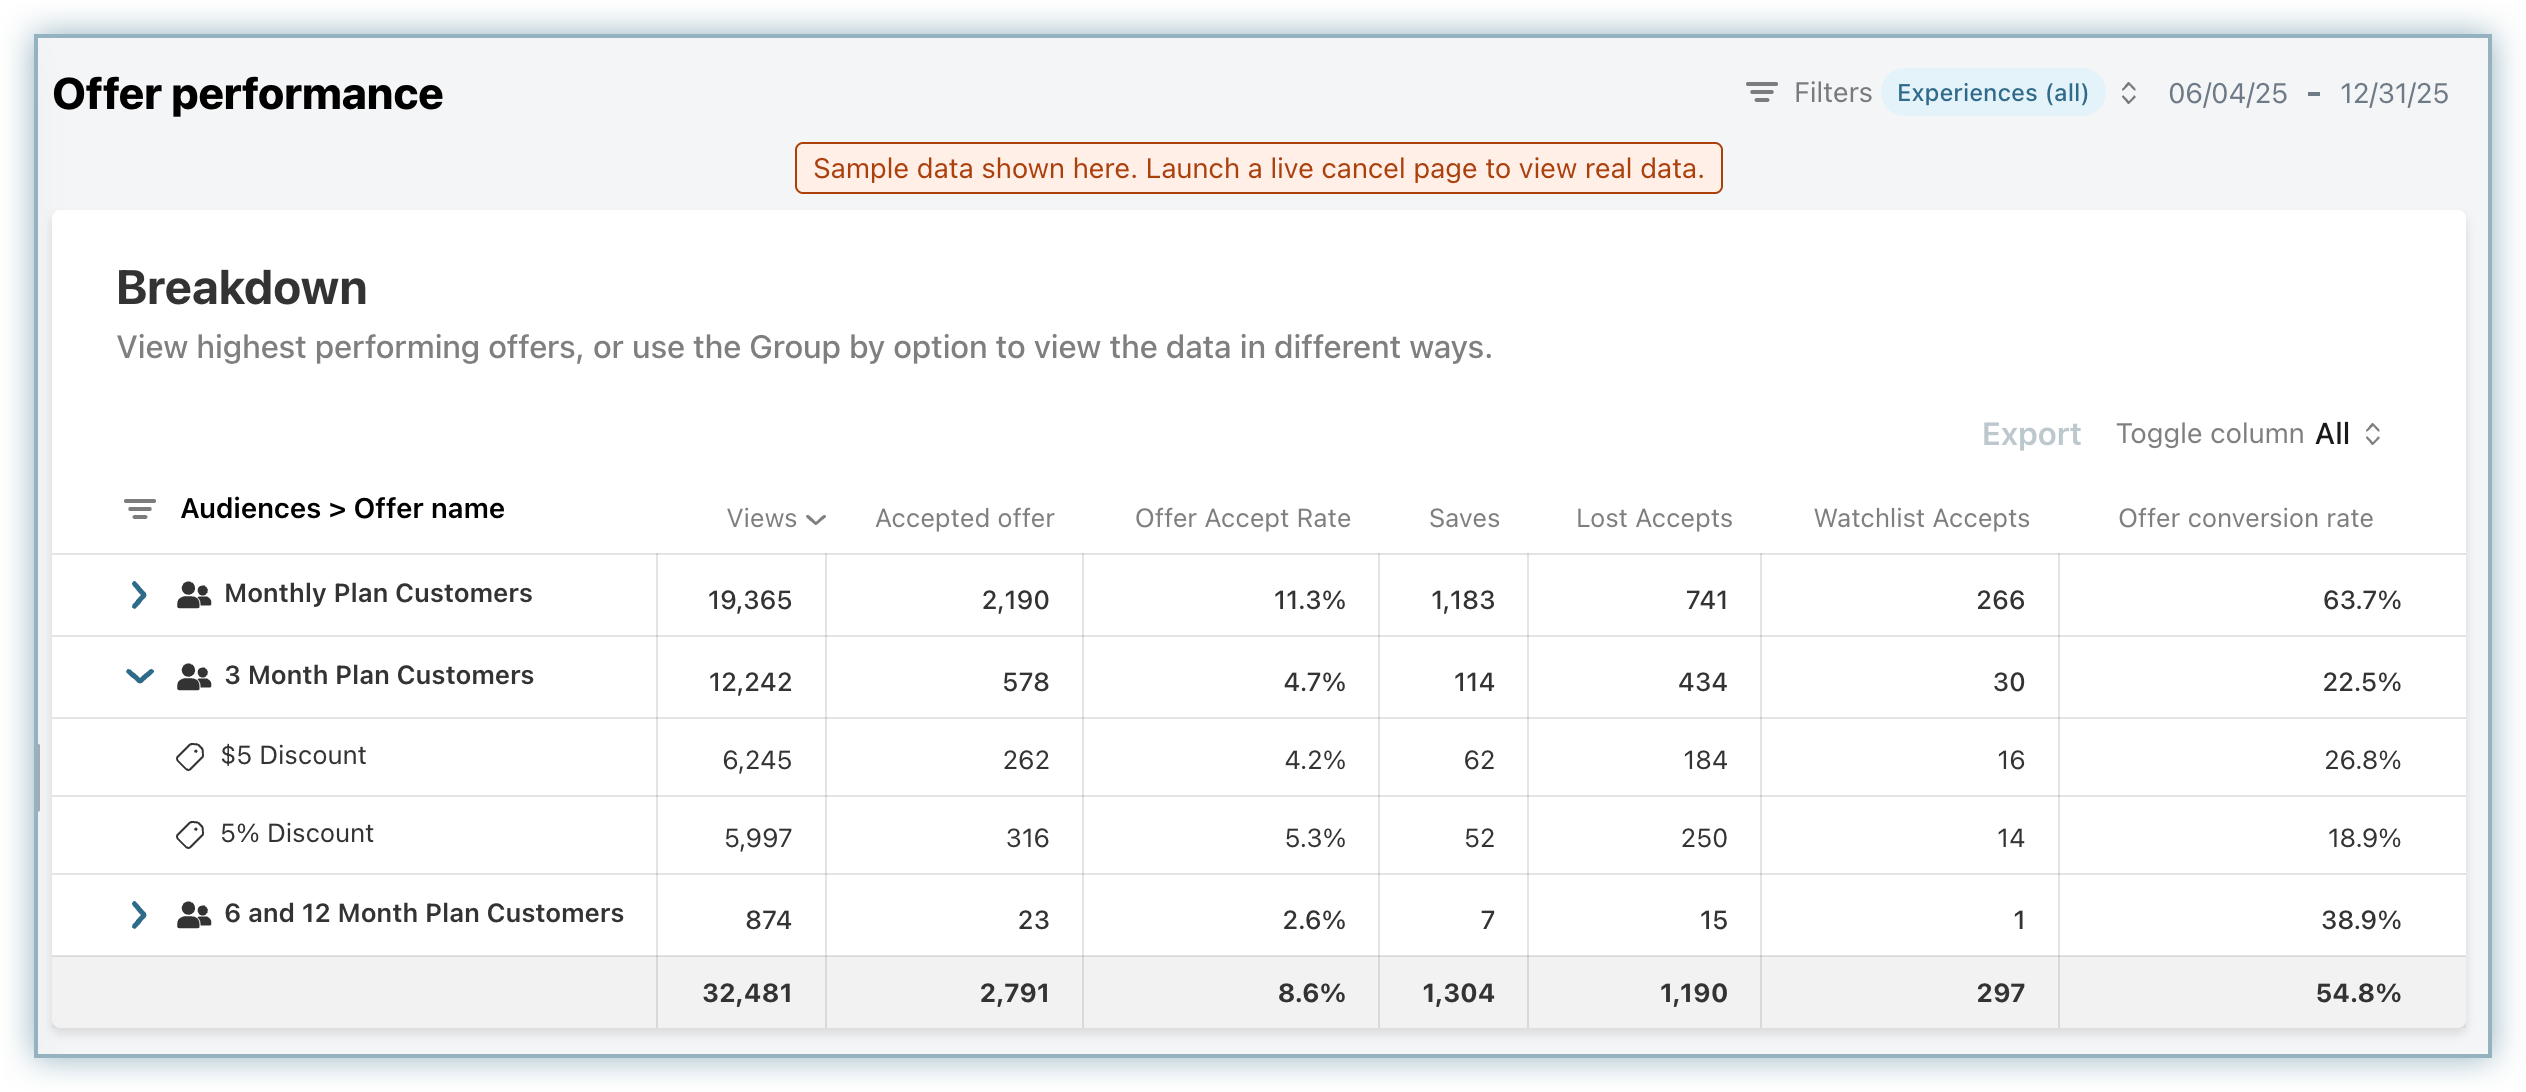
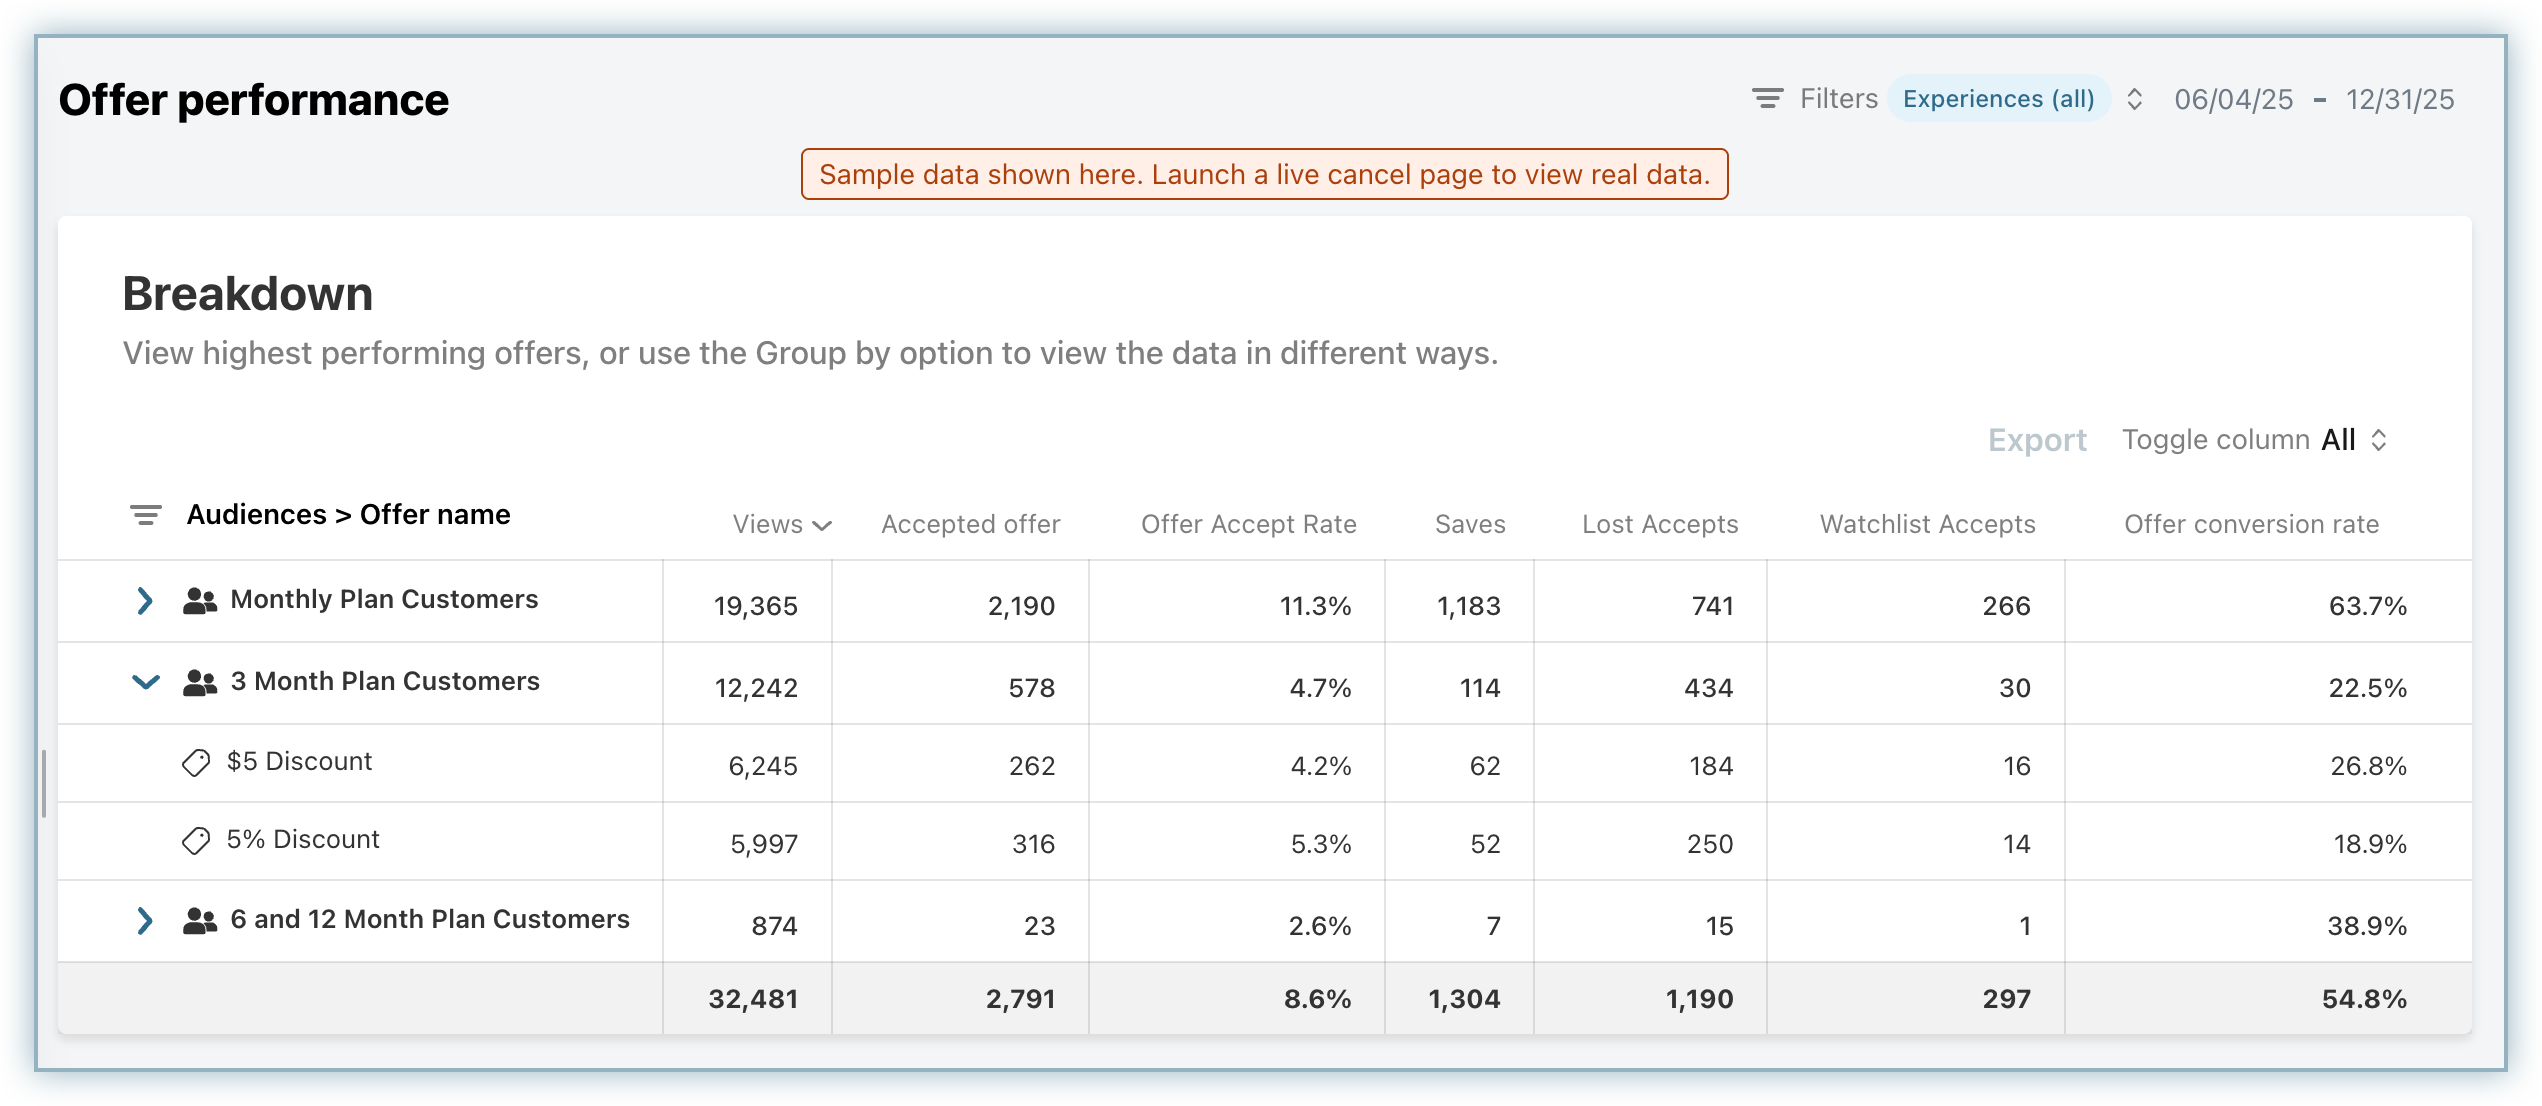
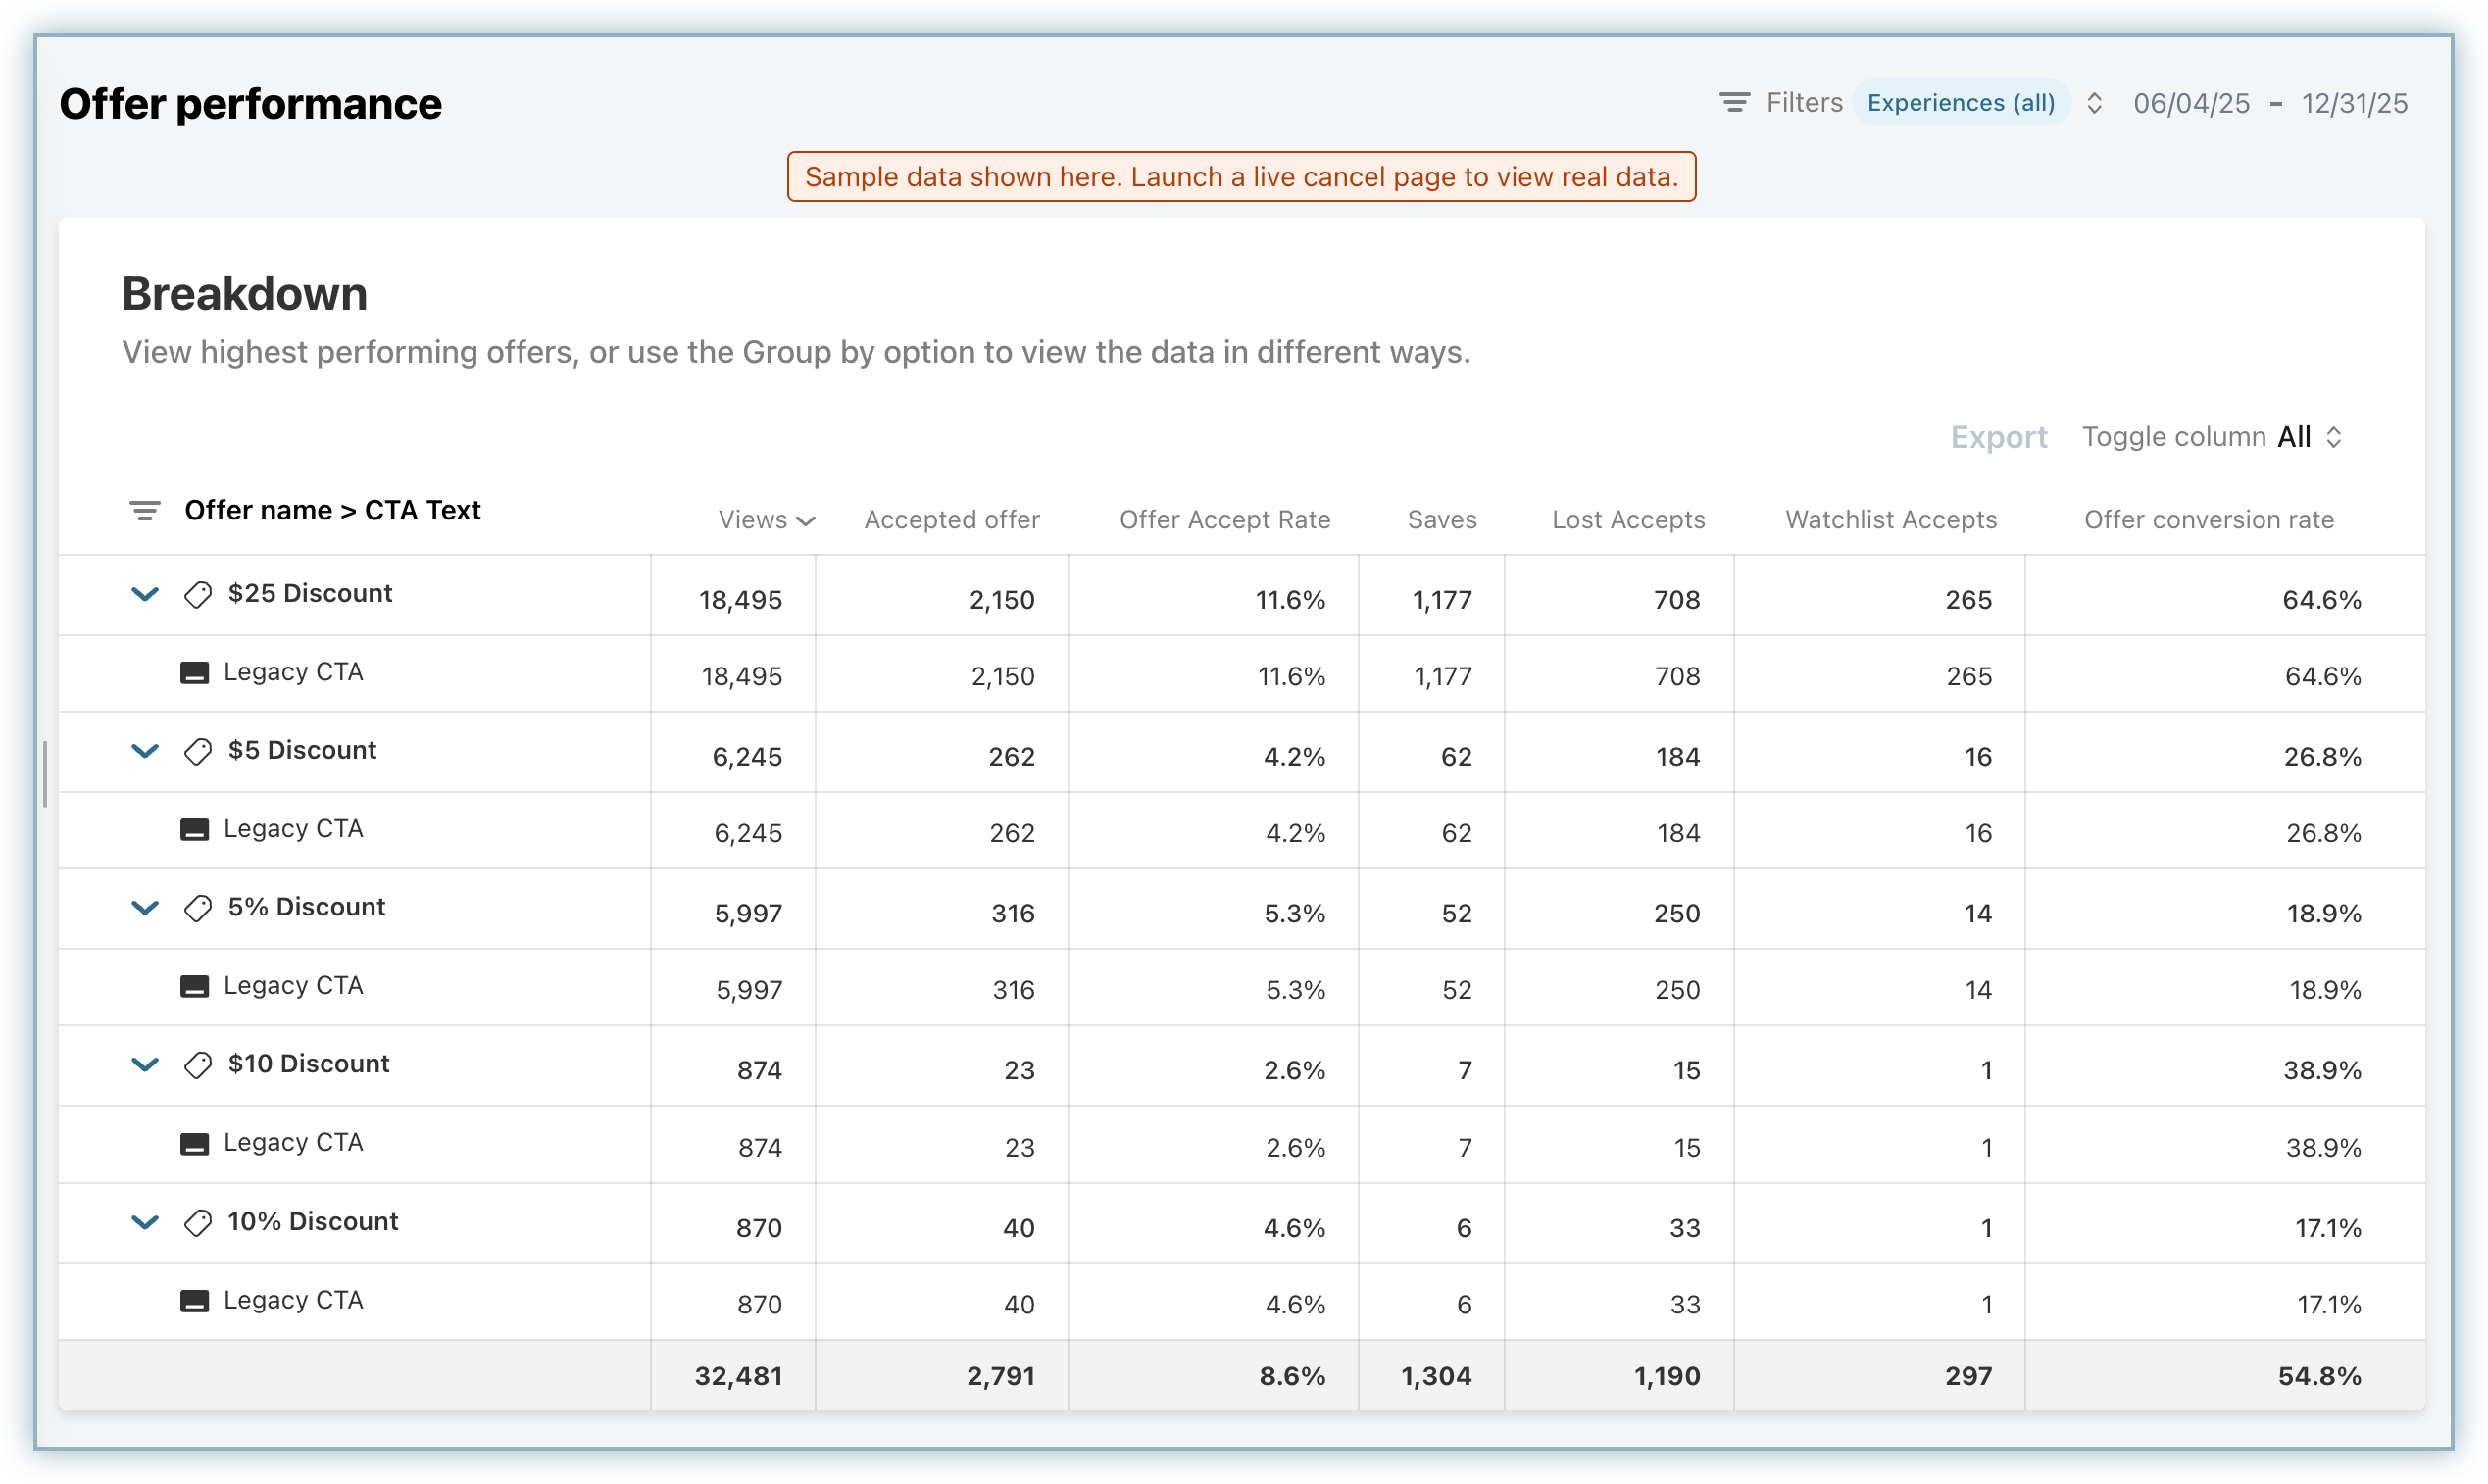
The Offer Performance Report provides a breakdown of how each offer performs across the customer journey.
- Views: Number of customers who viewed the offer.
- CTA Views: Number of customers who viewed the offer’s call-to-action.
- Accepted Offer: Number of customers who clicked the offer CTA.
- Accepted Offer Revenue: Total revenue from customers who accepted the offer.
- Accept Rate: Ratio of accepted offers to total views for the selected time period.
- Saved: Number of customers who accepted the offer and were retained after the save window.
- Saved Revenue: Total revenue from customers who were saved after accepting the offer.
- Loss Accepts: Customers who accepted the offer but later canceled before being considered saved.
- Watchlist Accepts: Customers who accepted the offer and are still within the save evaluation window.
- Offer Conversion Rate: Ratio of saved customers to accepted offers that are eligible to be evaluated (past the save window).
Grouping your Report
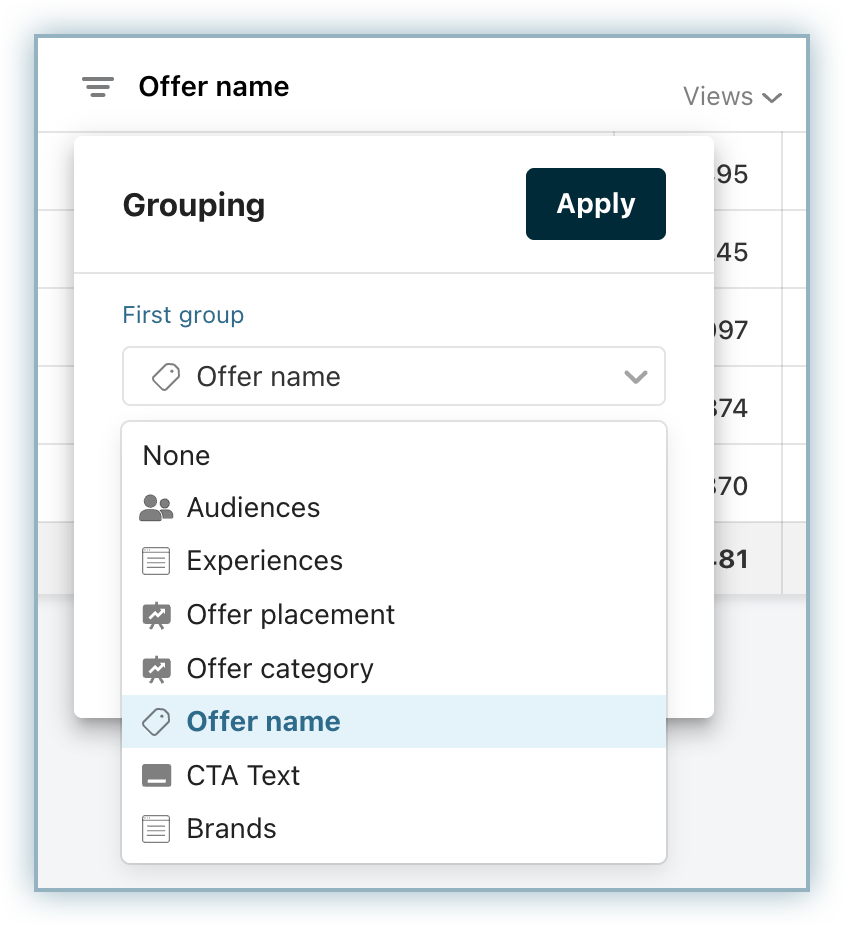
The Offer Performance Report supports flexible grouping, allowing you to analyze performance across different dimensions. By default, the report is grouped by Offer Name, which represents the specific offer shown to customers.
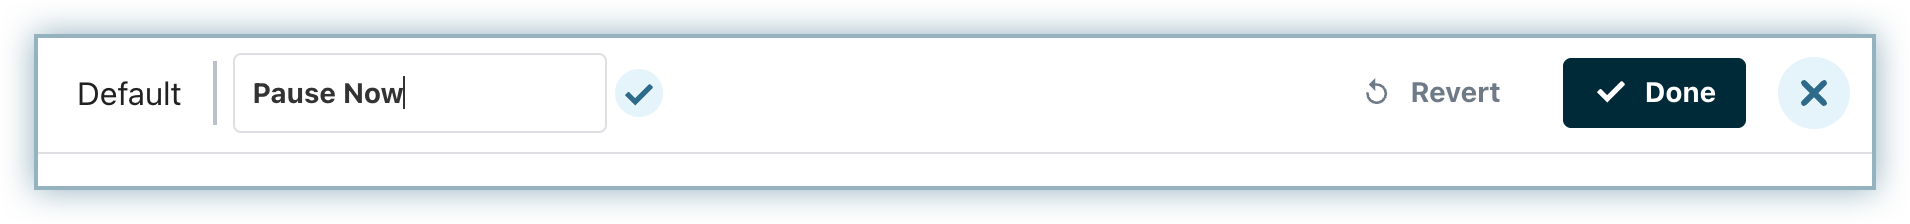
Clear and descriptive naming of offers is important, as it directly impacts how easily you can interpret report data. For example, if you offer different pause durations, naming them distinctly (such as “Pause for 1 Month” and “Pause for 2 Months”) will make comparisons more meaningful. Offer names can be updated in the Offer Library.
You can modify how data is grouped using the grouping selector. The report allows you to apply up to three levels of grouping, enabling deeper analysis. Available grouping dimensions include Audience, Experience, Offer Placement, Offer Category, Offer Name, and CTA Text.
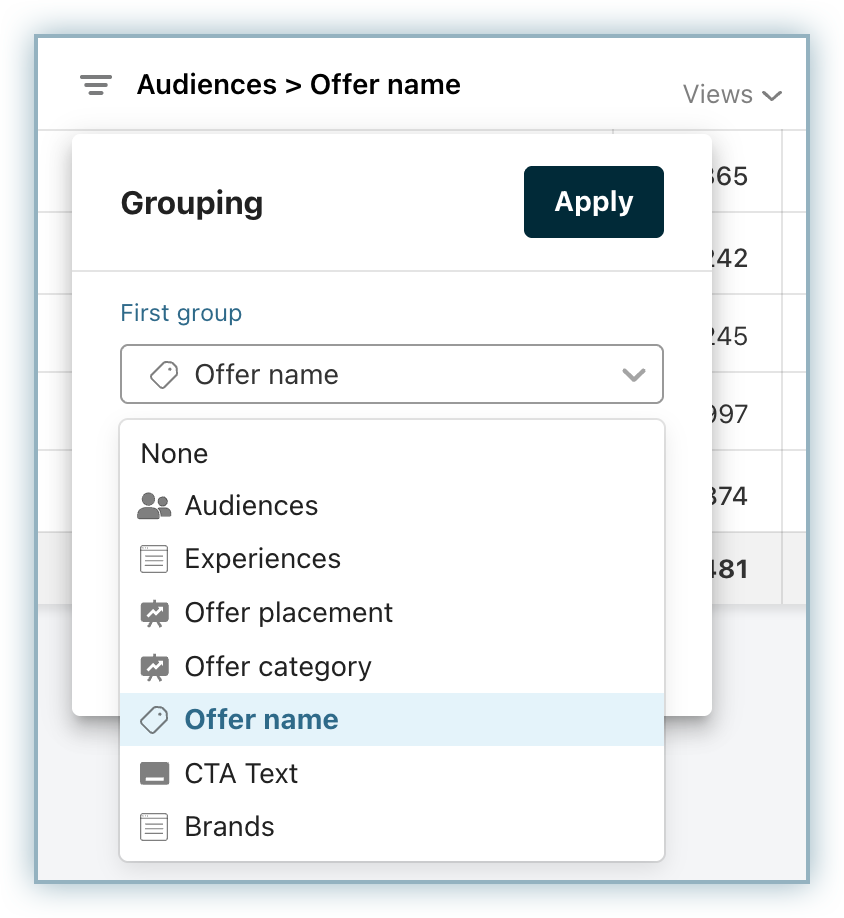
Adding multiple groupings allows you to expand rows and drill into sub-groups. For example, you can analyze how a specific offer performs within a particular audience segment, or compare how different offer categories perform across experiences. This flexibility makes it easier to uncover patterns and identify optimization opportunities.
For offers with multiple CTAs, you can evaluate the performance of individual buttons by grouping by CTA Text and including the CTA Views metric. This helps you understand which messaging or action drives the highest engagement.
Offer Categories
Offer Categories provide a high-level way to analyze performance across broader types of offers. Chargebee Growth supports the following categories:
- Discounts, which include percentage-based or fixed-amount reductions
- Plan Changes, such as downgrades to lower-priced plans
- Extensions, where service continues while payments are temporarily suspended
- Pauses, which temporarily stop both service and billing
- Support and Training, including coaching sessions, guides, or onboarding help
- Customer Feedback, such as prompts to contact support or provide feedback
Analyzing performance at the category level helps you identify which types of retention strategies are most effective across your customer base.
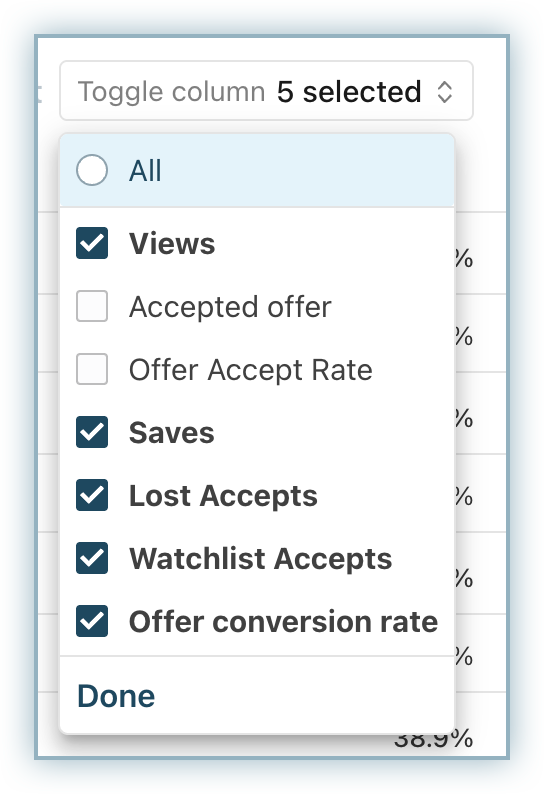
Selecting Metrics to Display
You can customize the metrics displayed in the Offer Performance Report by using the column toggle option. This allows you to focus on the data most relevant to your analysis, whether that is engagement, conversion, or revenue impact.
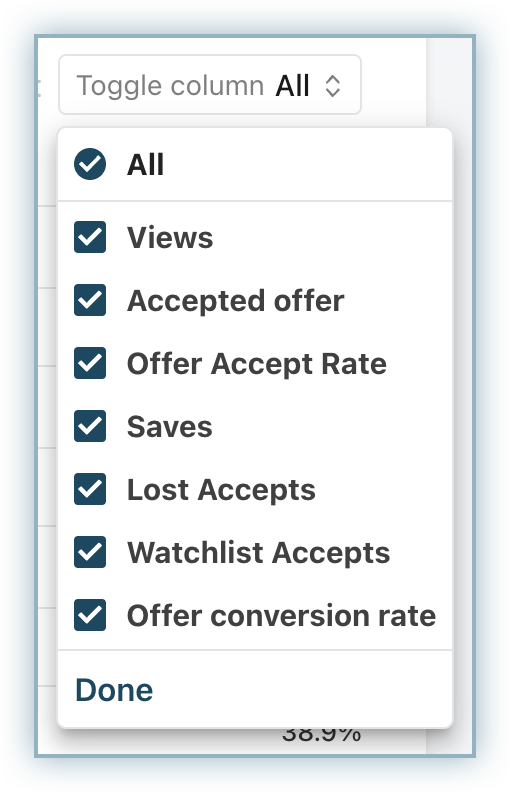
If Retained Revenue Impact Reporting is enabled, additional revenue-related metrics will be available, providing deeper insight into the financial impact of your retention efforts.
Exporting Offer Data for Analysis
The report allows you to drill down into customer-level data for each offer. By clicking on an offer name, you can open a detailed view that displays a list of customers who interacted with that offer.
Within this view, you can filter and sort customers based on specific criteria, such as whether they accepted the offer or when the interaction occurred. This enables more targeted analysis, such as identifying cohorts of customers who responded to a particular offer.
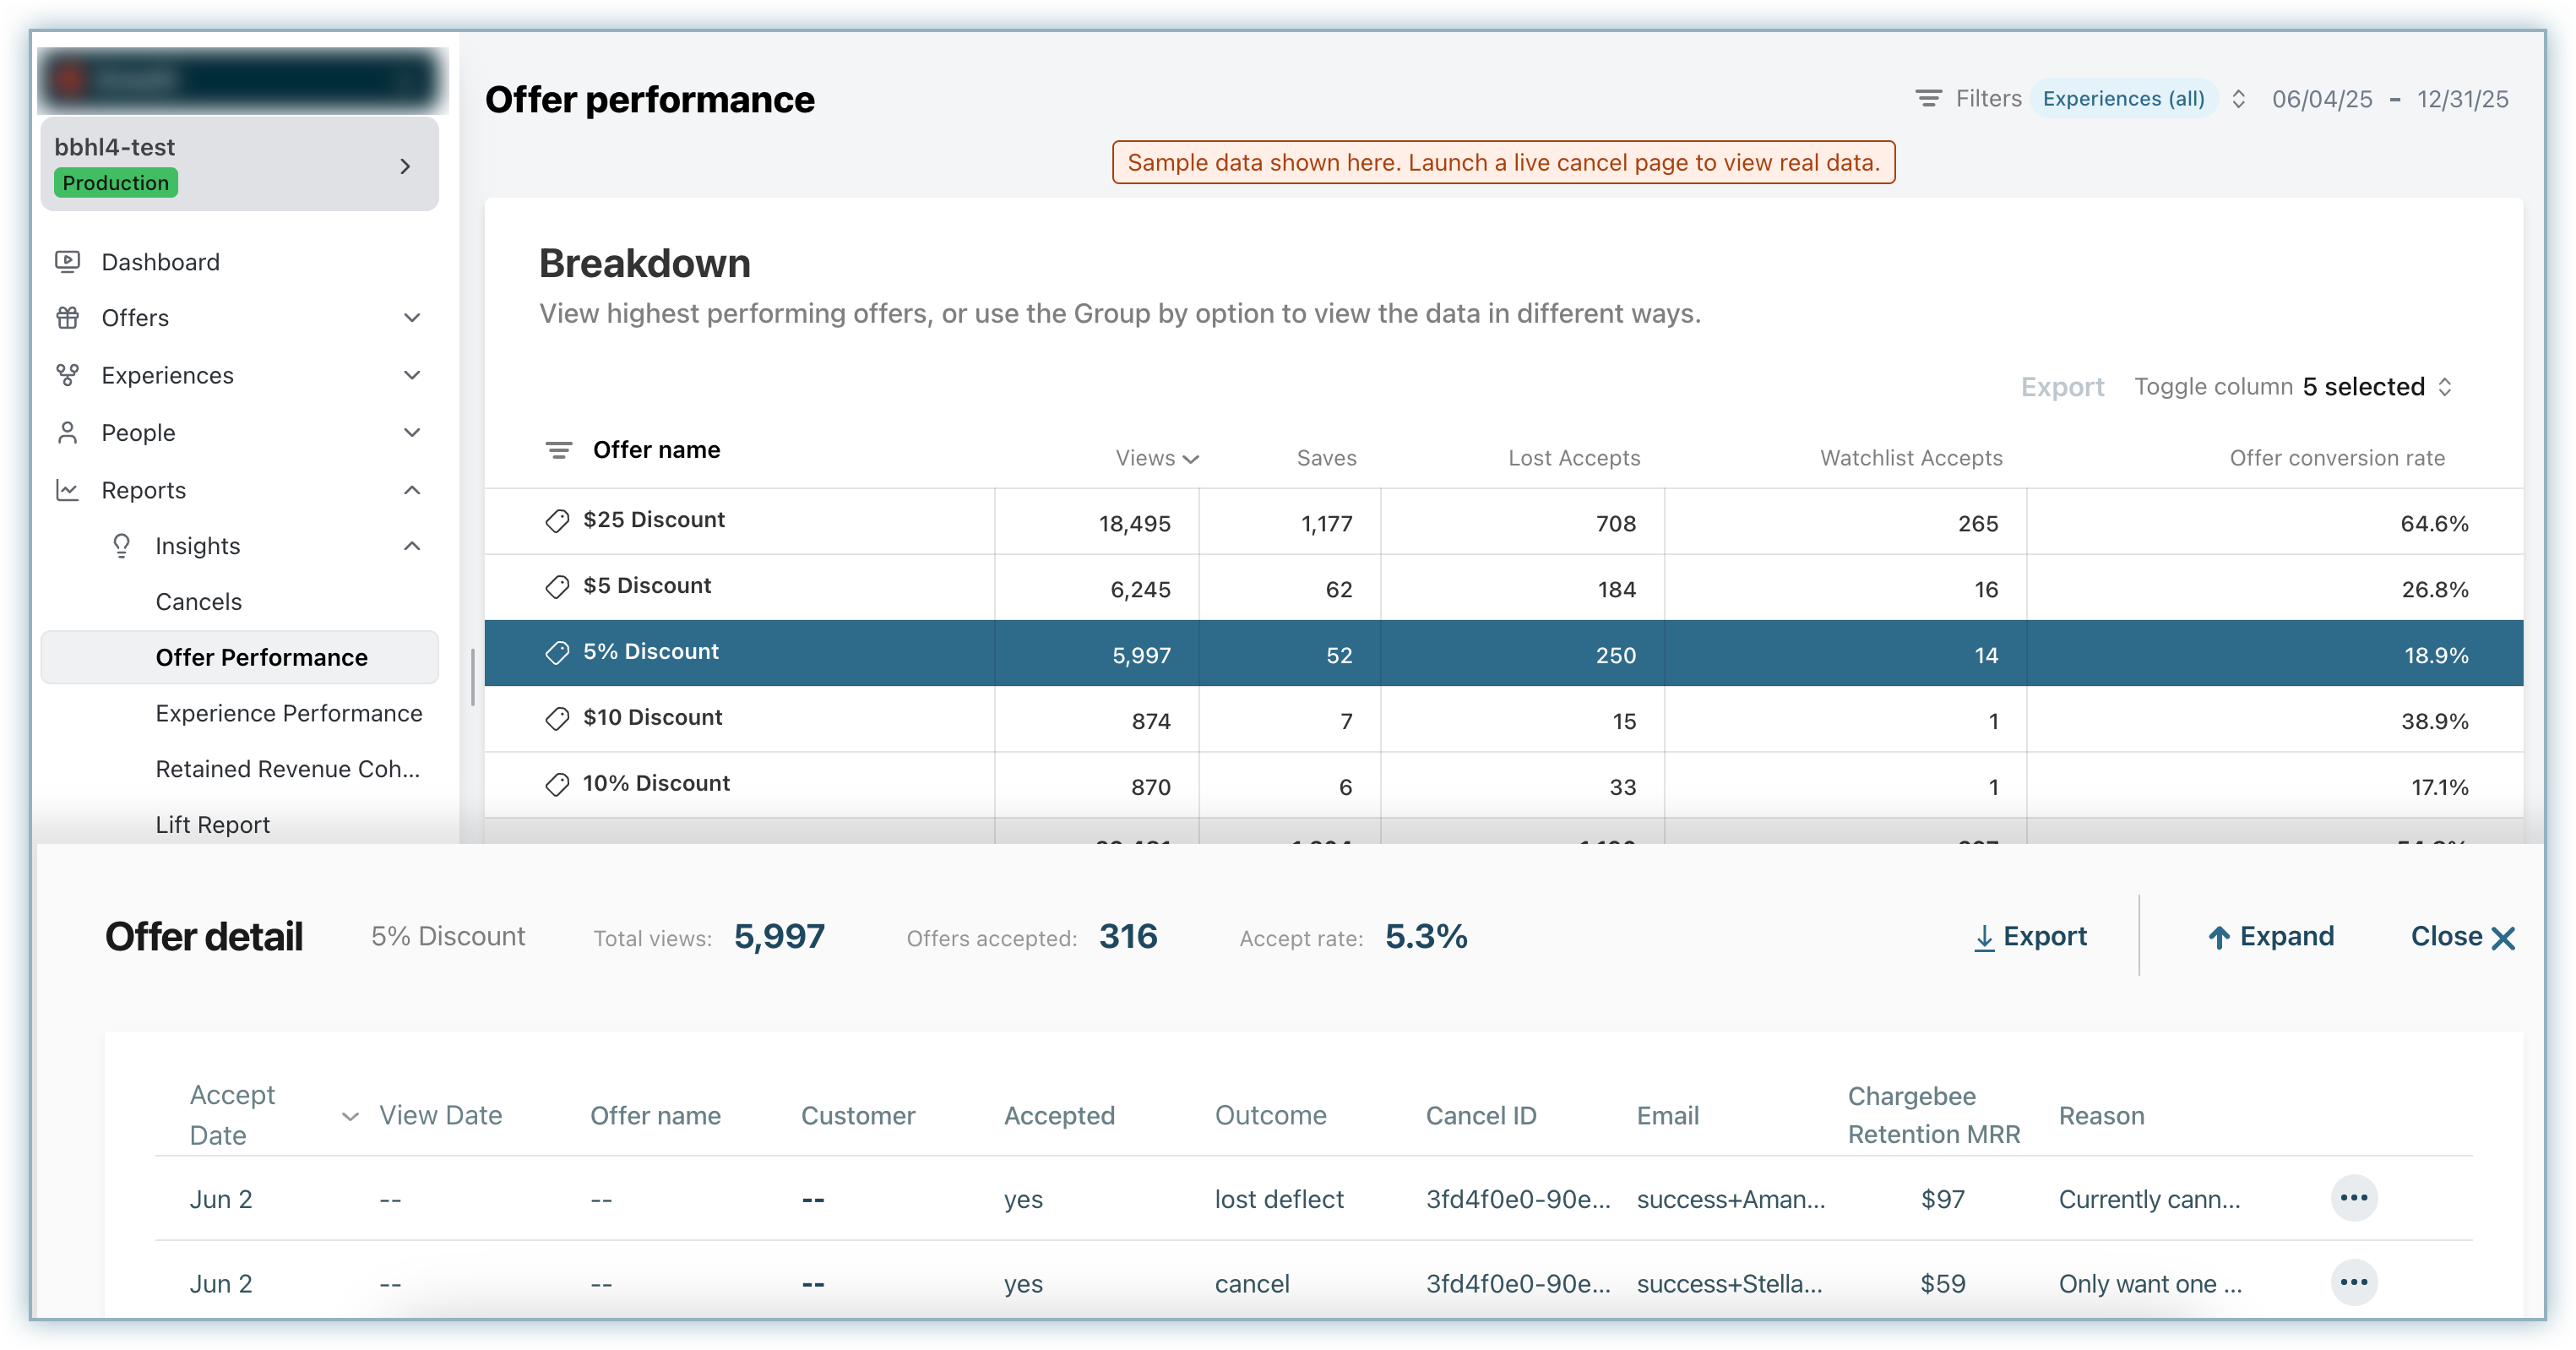
You can also export this data for further analysis outside the platform. For example, you may combine it with subscription data to track repurchase behavior or evaluate long-term retention by offer type.
Managing Offer Names
To update how offers appear in the report, you can edit their display names in the Offers and Experiences modules. Any changes made to offer names will automatically be reflected in the Offer Performance Report.
Maintaining clear and consistent naming conventions ensures that your reporting remains easy to interpret and actionable.
Was this article helpful?