Lift Report
Overview
The Lift Report in Chargebee Growth helps you measure the effectiveness of your retention experiences by comparing performance against a control group. It enables you to quantify the true impact of your cancel flow by analyzing how customers behave when exposed to retention strategies versus when they are not.
This report is particularly useful for growth, product, and customer success teams looking to validate the ROI of their retention efforts. By comparing key metrics across different groups, you can clearly understand whether your experiences are improving deflection, reducing cancellations, and driving better outcomes.
The Lift Report compares three groups:
- Growth (Retention Experience): Customers who go through your Chargebee Growth cancel flow
- Holdout: Customers who see a cancel page without offers or retention interventions
- Bypass (if enabled): Customers who are routed to your existing cancel experience outside of Chargebee Growth
By comparing performance across groups, you can determine if your cancel experiences are increasing deflection rates, reducing immediate cancellations, or improving downstream behaviours such as repurchase. This comparison is especially valuable when running experiments or rolling out new retention strategies. It allows you to validate changes with confidence and make data-driven decisions about optimizing your cancel flows.
To view the report, navigate to the Reports section on the left navigation and select Lift Report. The charts present a comparative view of performance across the available groups for the selected time period.
Understanding Lift Report Metrics
The Lift Report includes a set of key metrics that allow you to compare performance across Growth, holdout, and bypass groups.
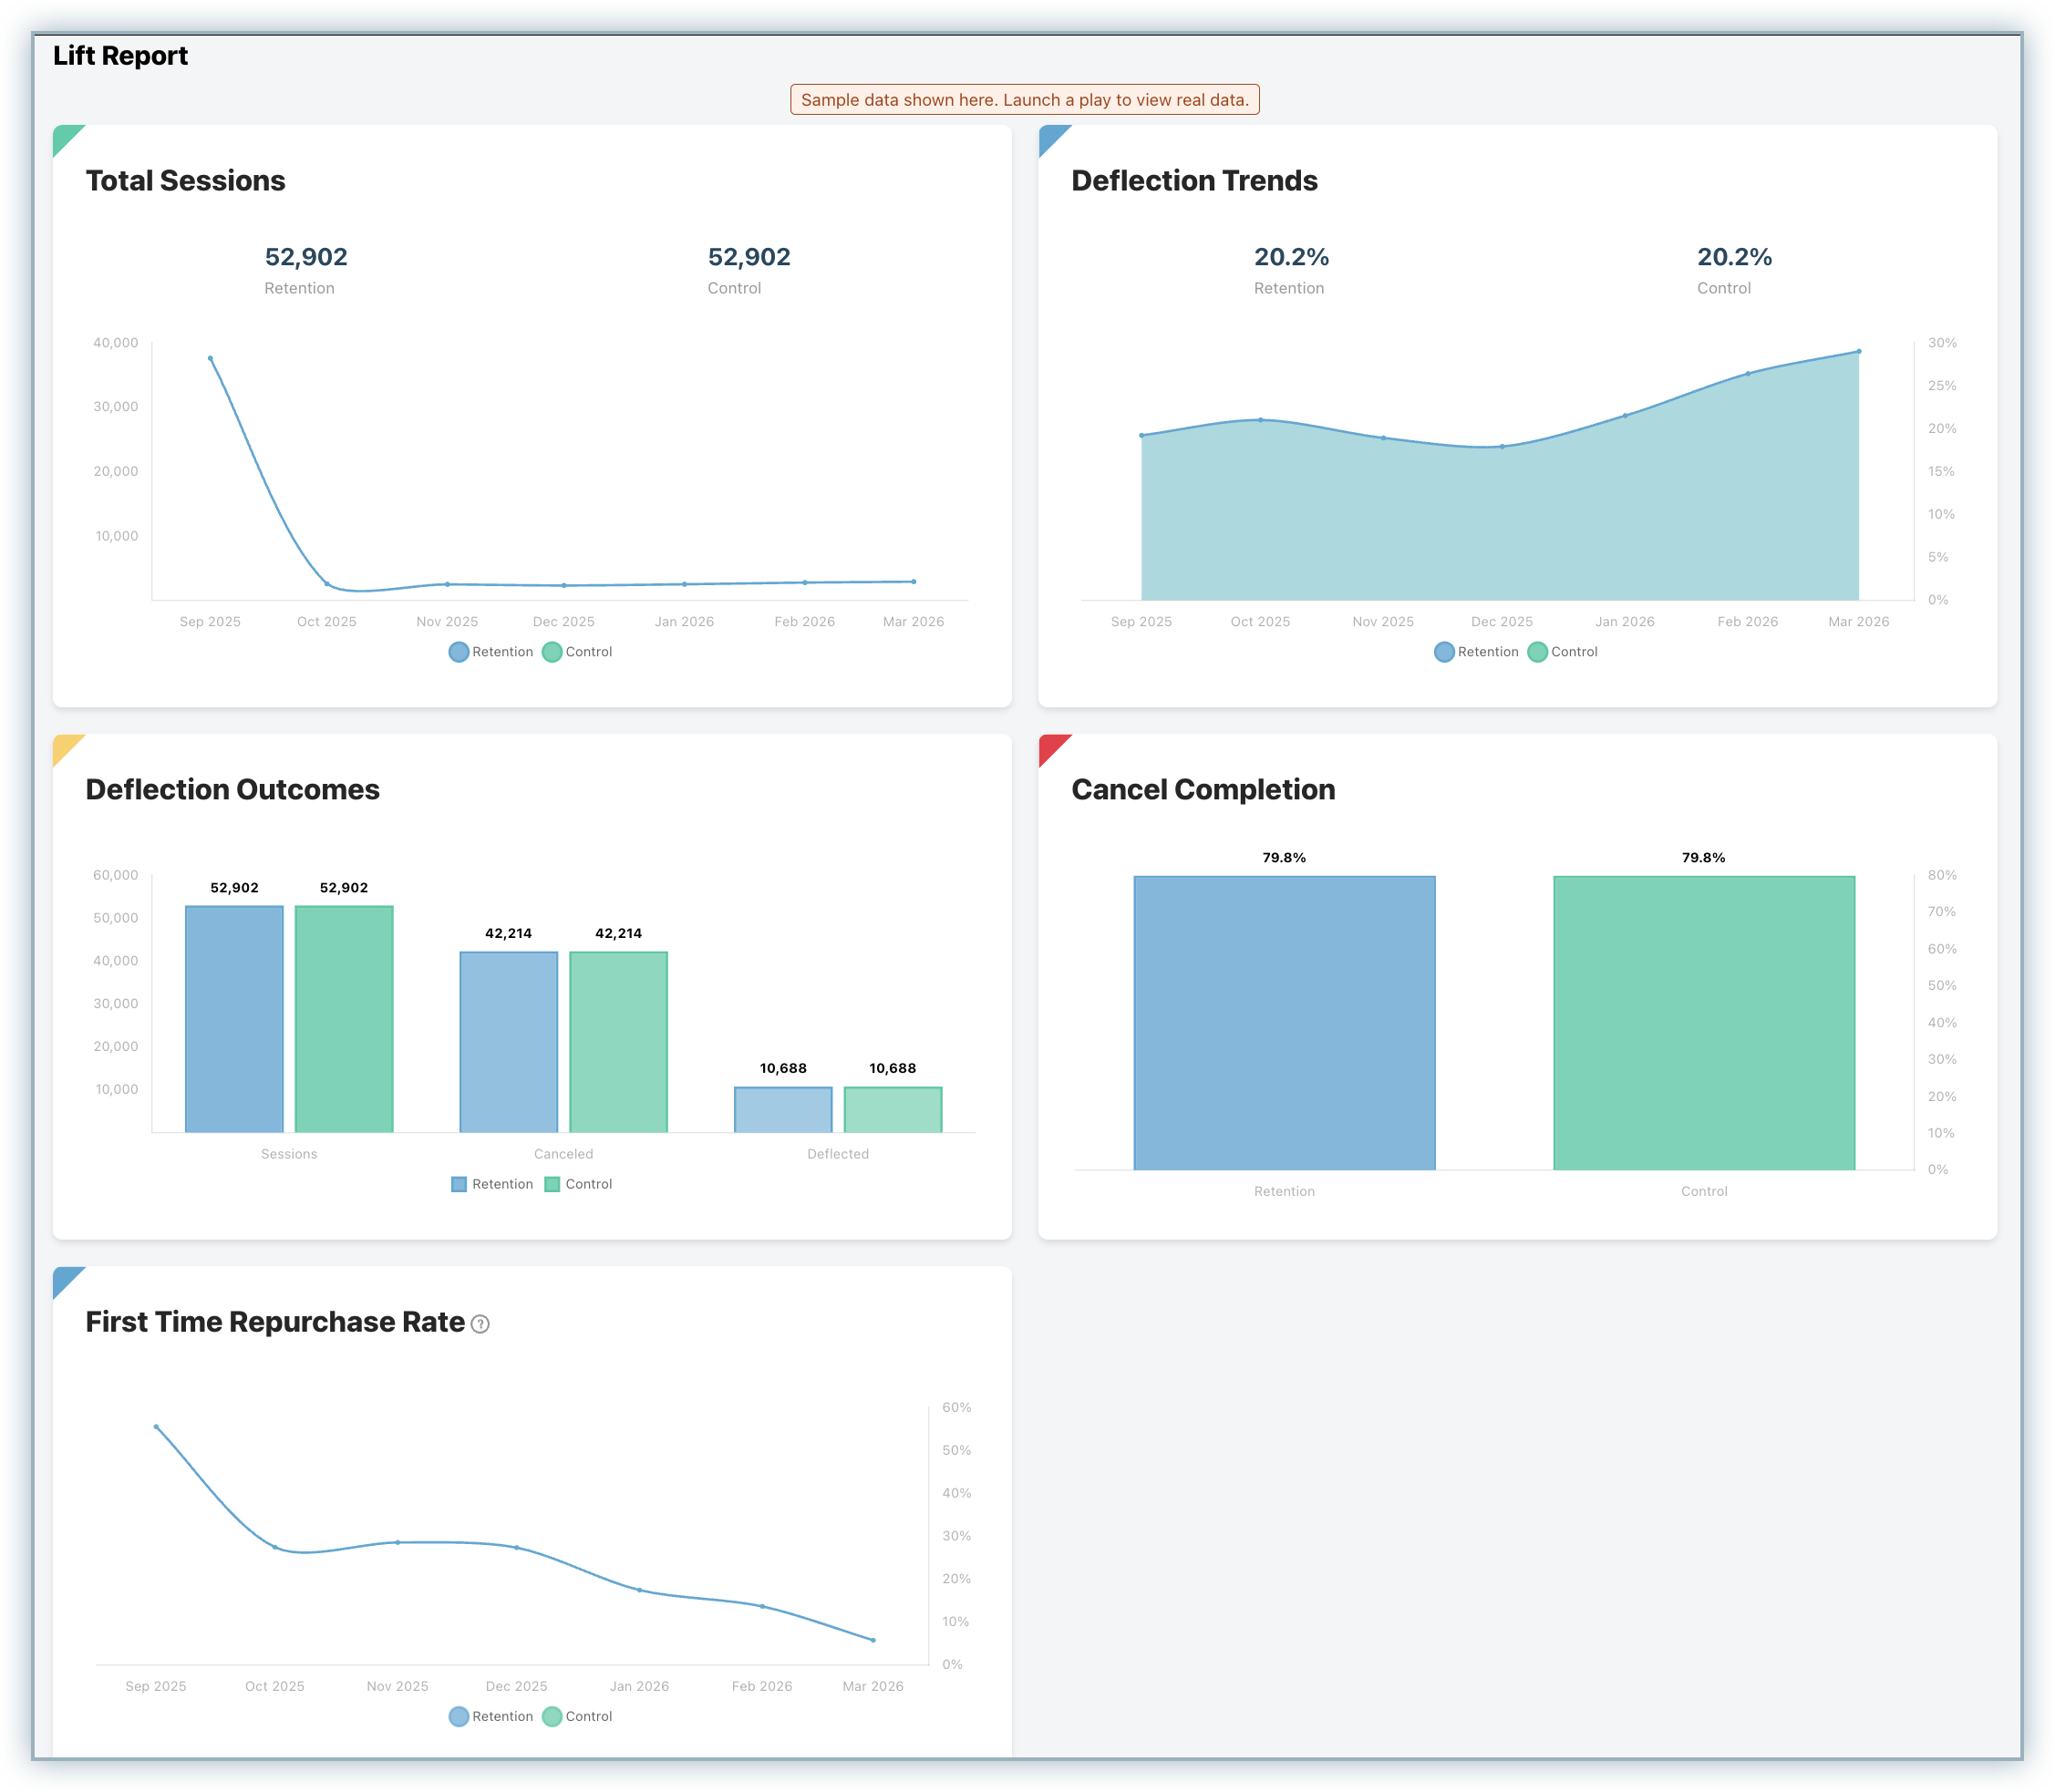
- Total Sessions: Represents the number of customer sessions for the selected time period. You can hover over the trend line to view session counts for specific intervals such as day, week, or month.
- Deflection Trends: Shows the deflect rate over time for each group. This helps you understand how effectively each experience prevents cancellations. Hovering over the chart reveals exact values for specific time intervals.
- Deflection Outcomes: Provides a breakdown of session outcomes, including total sessions, deflections, and cancellations. This gives a clear view of how users move through the cancellation journey in each group.
- Cancel Completion Rate: Indicates the percentage of customers who complete cancellation during their initial visit. You can hover over the visualization to see both session and cancellation counts for deeper context.
For Chargebee Billing users who have the bypass feature enabled, the report also includes:
- First-Time Repurchase Rate: Measures the percentage of customers who return and repurchase after canceling, across Growth, holdout, and bypass groups.
Was this article helpful?