Chargebee Pay is available to pre-qualified Chargebee Billing customers. Request access to use Chargebee Pay.
Dashboards
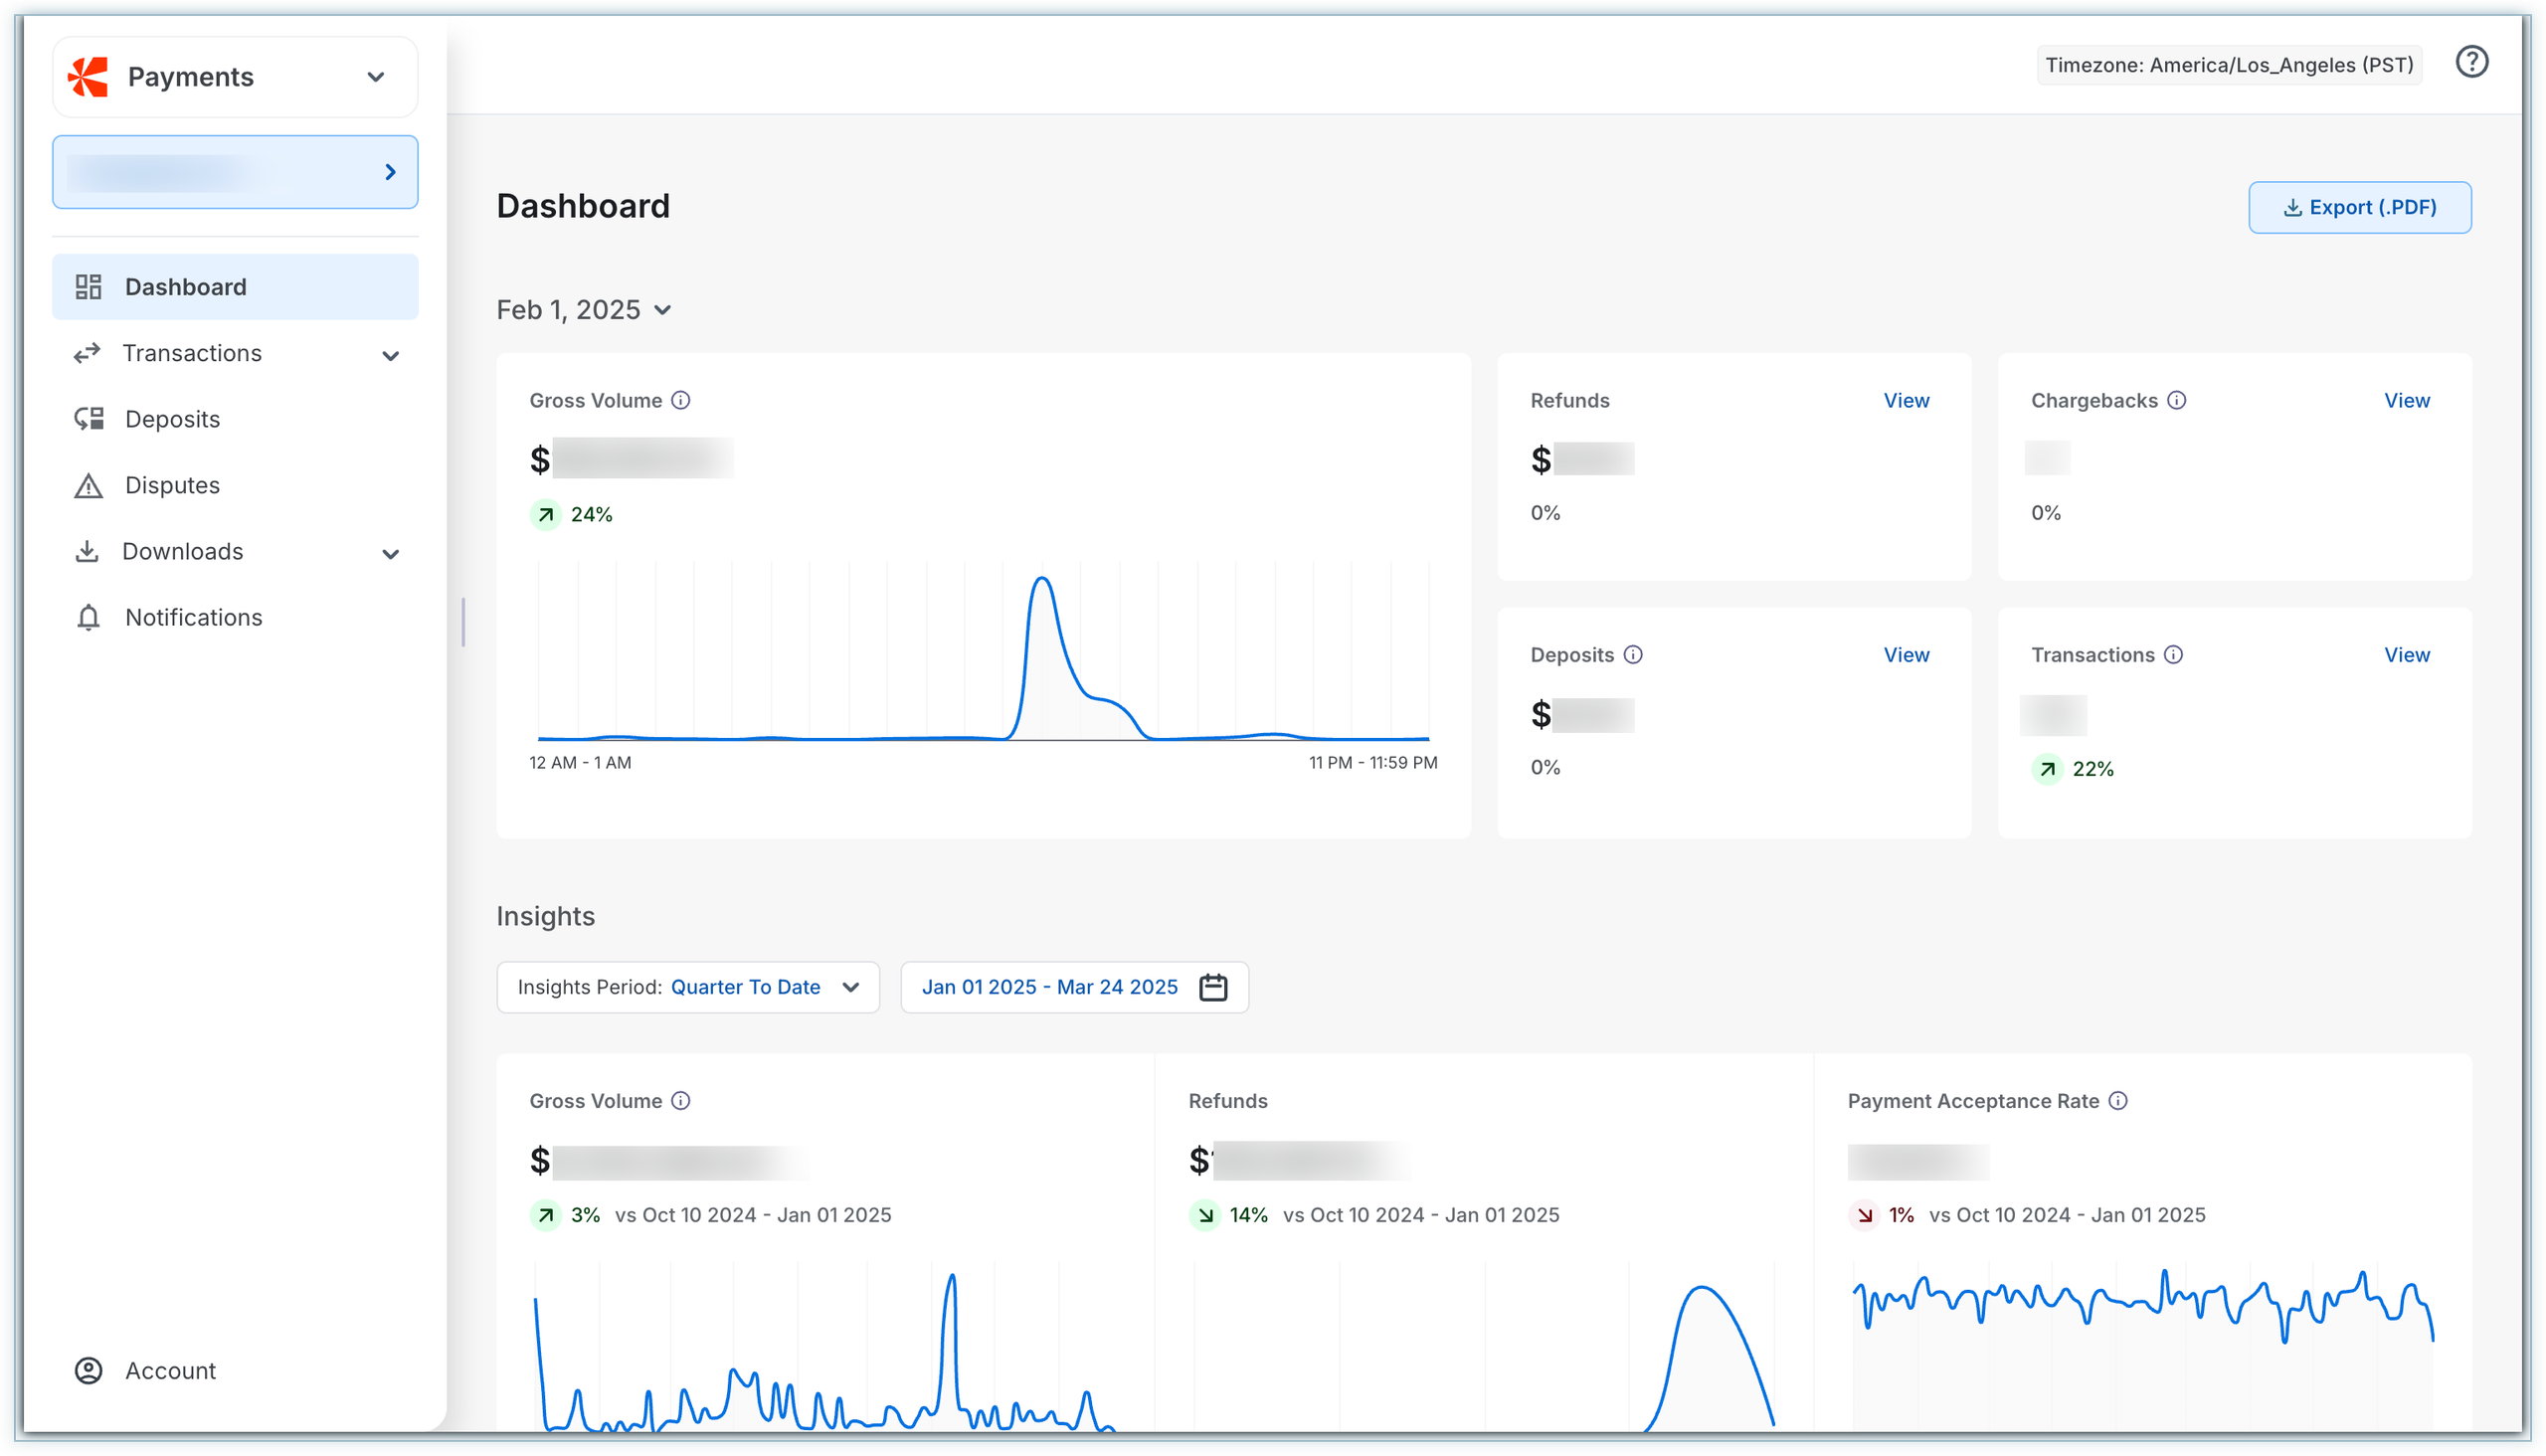
The Chargebee Pay dashboard summarizes your business's financial data to evaluate performance. It includes the following:
- A concise view of the current day's financial data is displayed by default in the Single-Day view.
- Valuable insights into the selected period's performance are available in the Insights view. You can export this information as a PDF for future reference using the Export button.
Single-Day View
This view depicts a single day and includes a date selector. You can choose any date from the first day of payment processing.
Note
Dates prior to the first day of payment processing are unavailable for selection.
Metrics available within the Single-Day view are listed here:
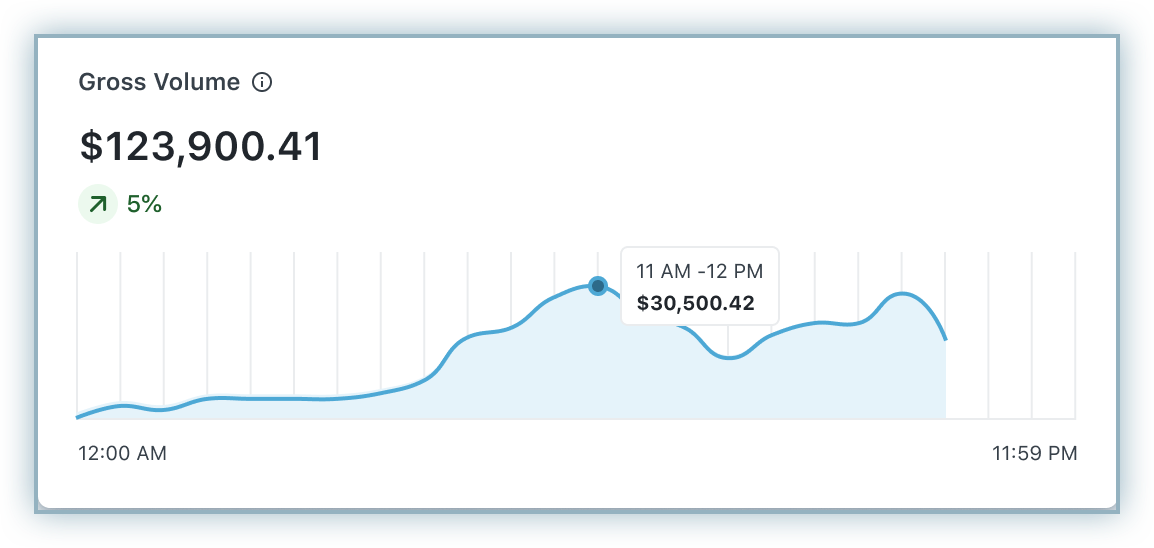
Gross Volume
Gross volume refers to the total amount processed successfully on a selected day. The delta value represents the percentage change compared to the previously selected day.
This metric represents the sum of transaction amounts (excluding dunning attempts).
Note
- Possible comparison scenarios common to all widgets:
- Increase (Green upward arrow): Indicates a positive trend for the business.
- Steady (No arrow): This represents an ideal or consistent performance.
- Decrease (Red downward arrow): Indicates a negative trend.
- A graph displays the transaction values over a 24-hour timeline.
- An information icon provides additional details.
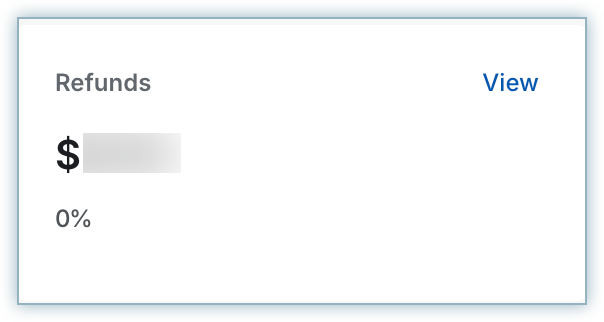
Refunds
The numerical value represents the total amount refunded to customers in the selected period. The View button redirects you to the Payments & Refunds module.
This metric represents the sum of the refunded amount.
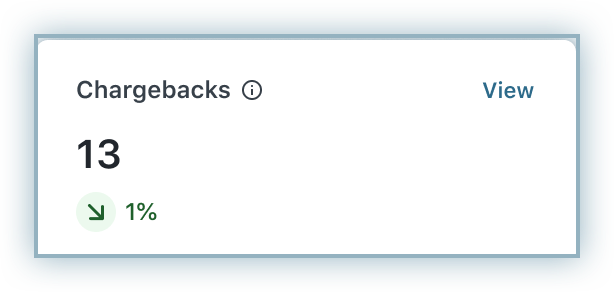
Chargebacks
The numerical value represents the total number of chargebacks filed. The View button redirects you to the Open tab within the Disputes module.
This metric represents the count of open chargebacks.
Deposits
The net payout credited to the merchant account during a selected period. The View button redirects you to the Payouts module.
This metric represents the total payout amount processed.
Transactions
The total number of transactions processed on the selected date. The View button redirects you to the Payments & Refunds module.
Count of transactions (excluding dunning attempts).
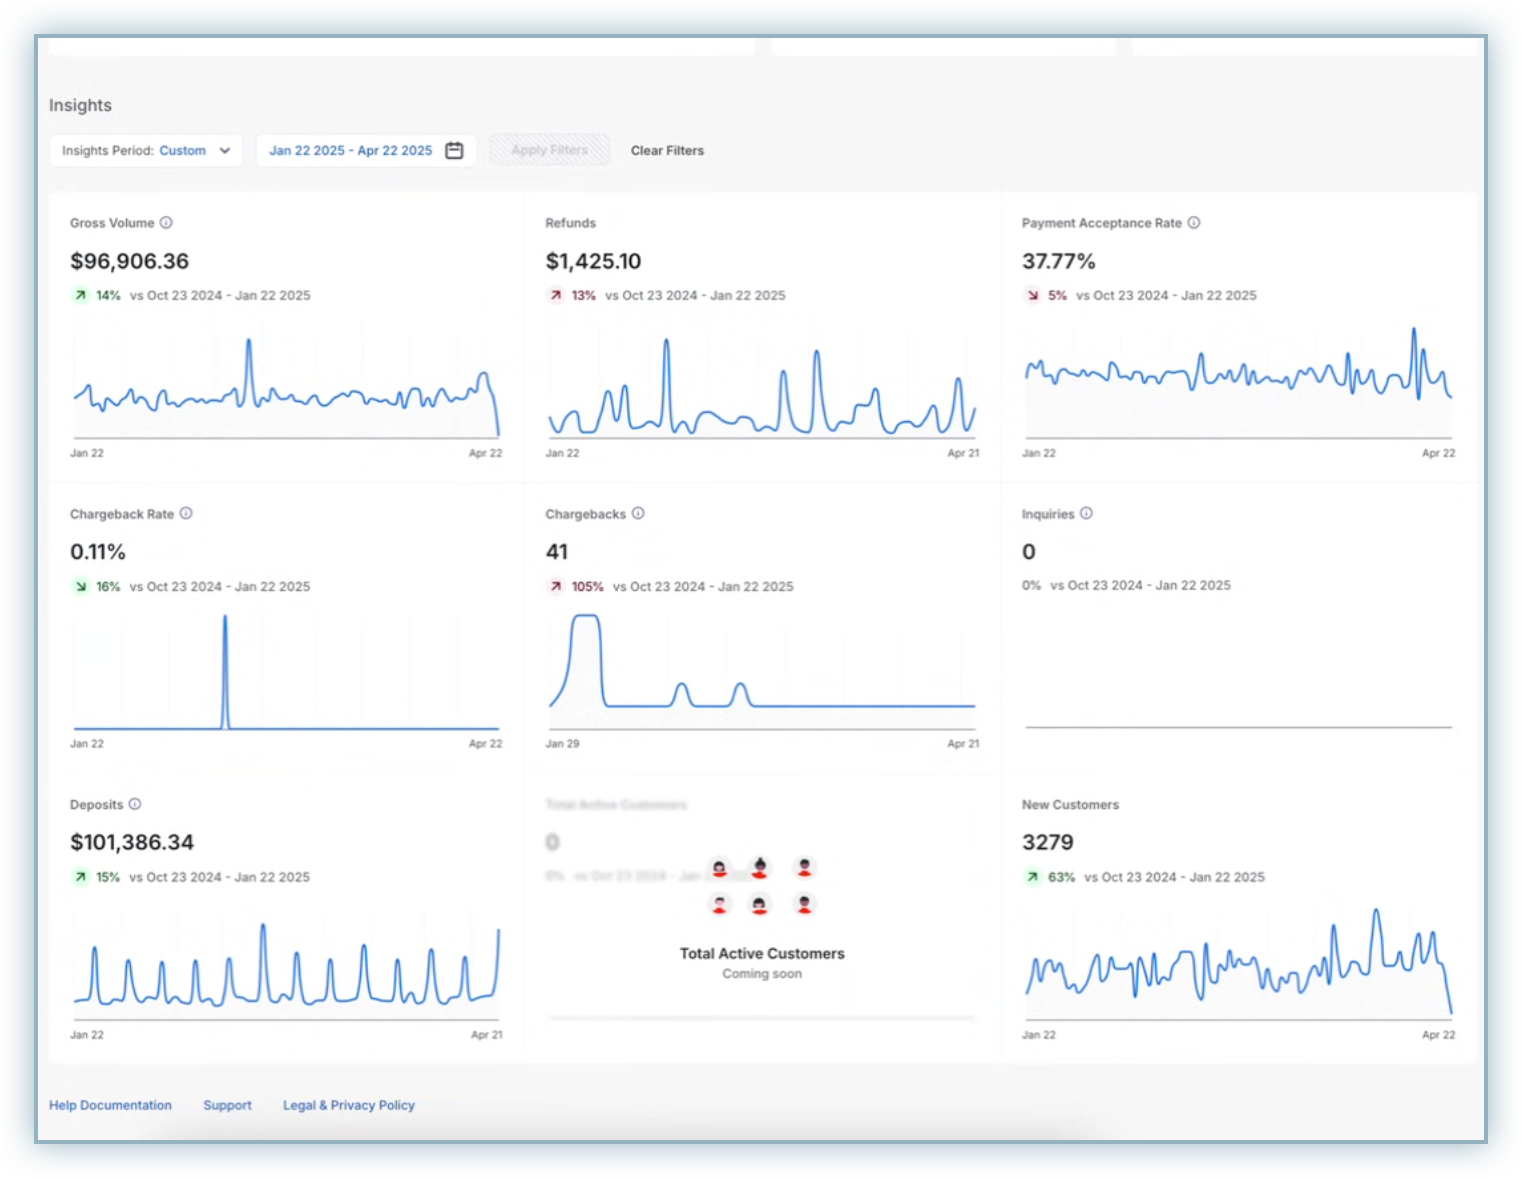
Insights View
The Insights section displays information based on the selected period. You can choose a time range from the dropdown menu, ranging from the current day to the past 3 months, or select a custom range, as illustrated below:
This section provides comprehensive analytics based on the selected filters.
Insights Period
You can choose a specific period to view analytics. Granularity varies from one day to one year. You can also choose Custom to select a specific date range.
Manage Charts
You can hide or display the charts in the Insights section.
Metrics and charts available in this view are listed here:
Charts
The chart displays a timeline with a start date and an end date. The timeline is adjusted based on the selected period.
Interacting with the bars on the chart will show a tooltip with values such as date and amount.
Hovering over the comparison data shows a tooltip indicating "Comparison of the previous period".
Payment Authorization Rate
The percentage of payment transactions successfully authorized by the payment gateway on the first attempt, compared to the total attempted transactions.
This metric represents the number of successful transactions divided by the total number of transactions (including dunning attempts).
Note
If the comparison percentage exceeds 1000%, it will be displayed as "1000%+" (e.g., for 1215% → 1000%+) for all these metrics.
Chargeback Rate
The percentage of transactions for which a chargeback is filed during a selected period. It also displays the percentage change from the previous period.
This metric represents the number of chargebacks divided by the total number of transactions (including dunning attempts).
Chargebacks
The total number of chargebacks filed during a selected period is displayed. It also displays the percentage change compared to the previous period.
This metric gives you the count of chargebacks.
Was this article helpful?