RevenueStory vs Classic Reports
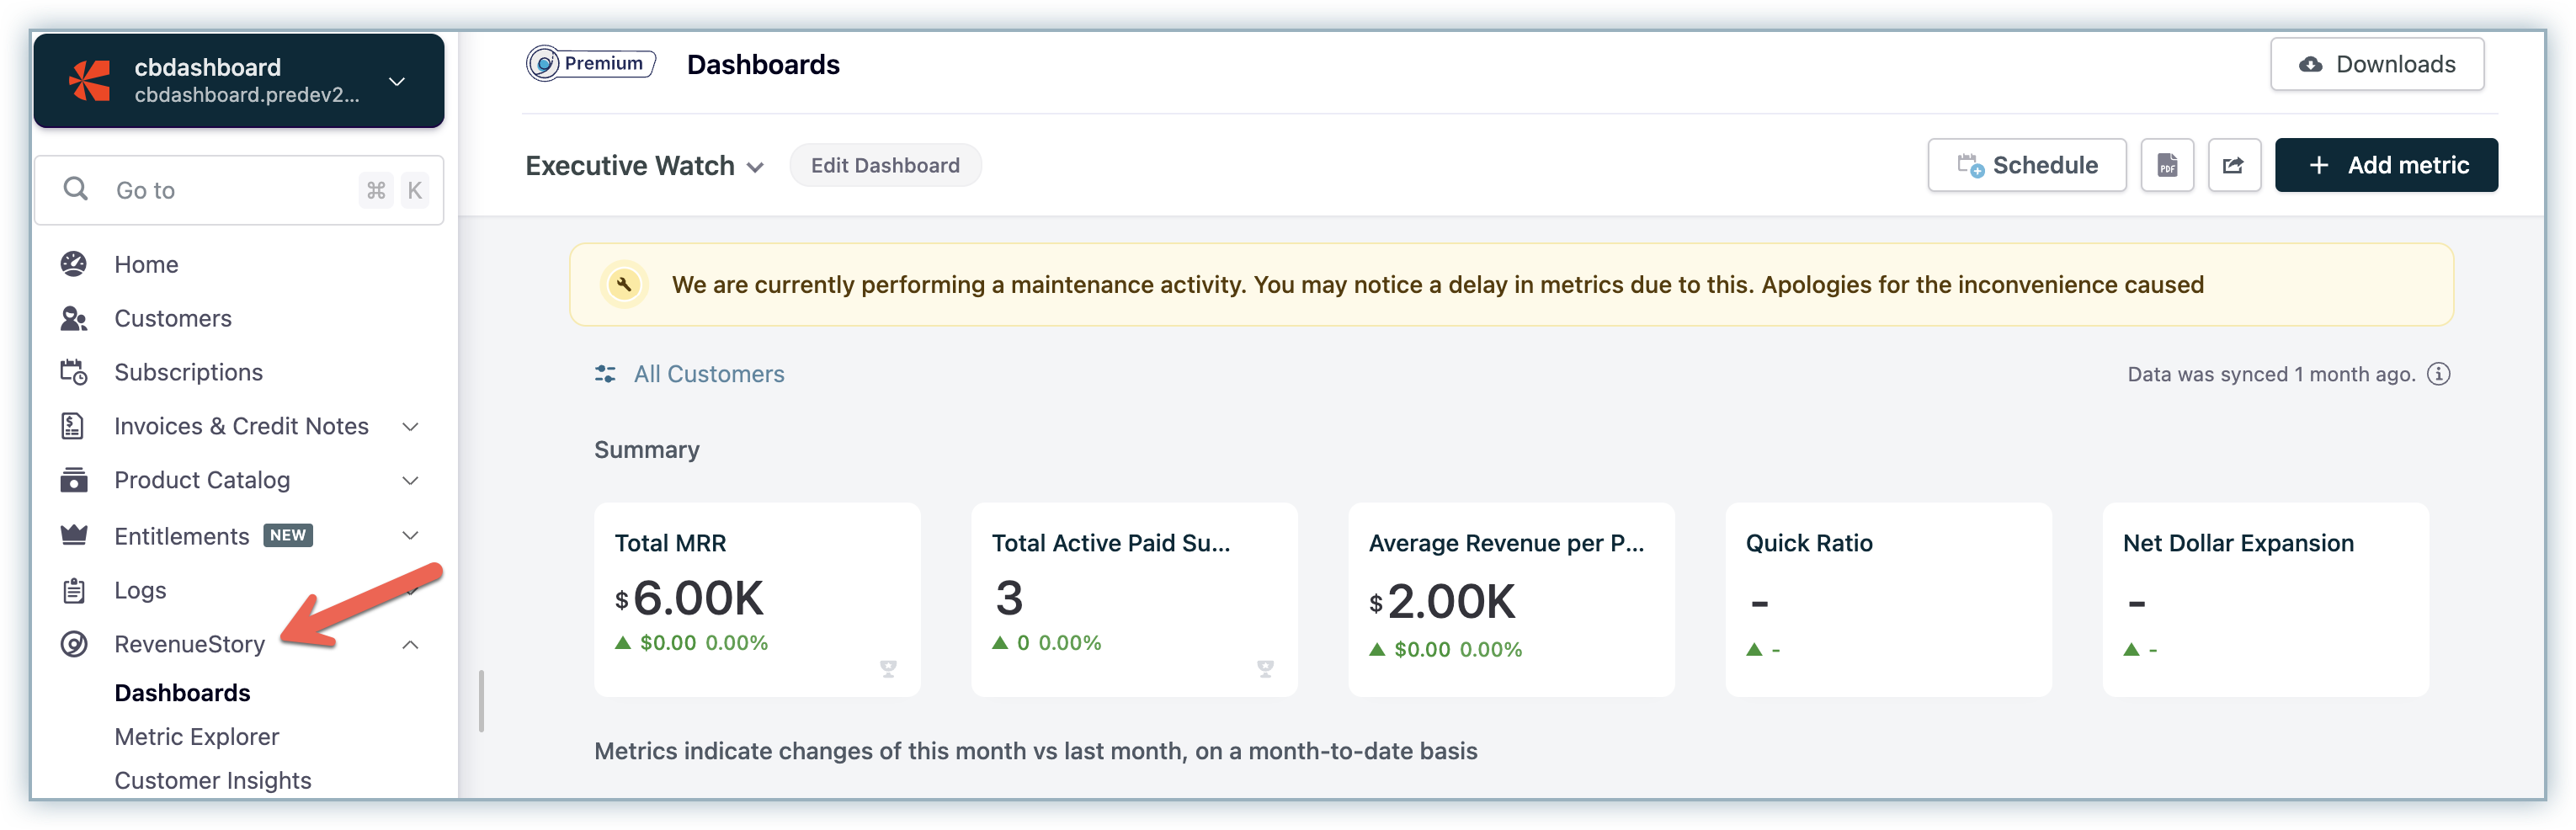
RevenueStory
RevenueStory gives a 360° business visibility on subscription-based analytics. It helps you identify and track the key performance indicators driving your organization's revenue, subscriptions, signups, activations, churn, and a host of other metrics that you need to make effective decisions. RevenueStory has more than 150+ ready-made reports that help you derive actionable insights on new sales, payments collected, monthly recurring revenue (MRR), activations, churn, and so on. You can access these reports from the RevenueStory tab in the Chargebee application.
Learn more about RevenueStory.
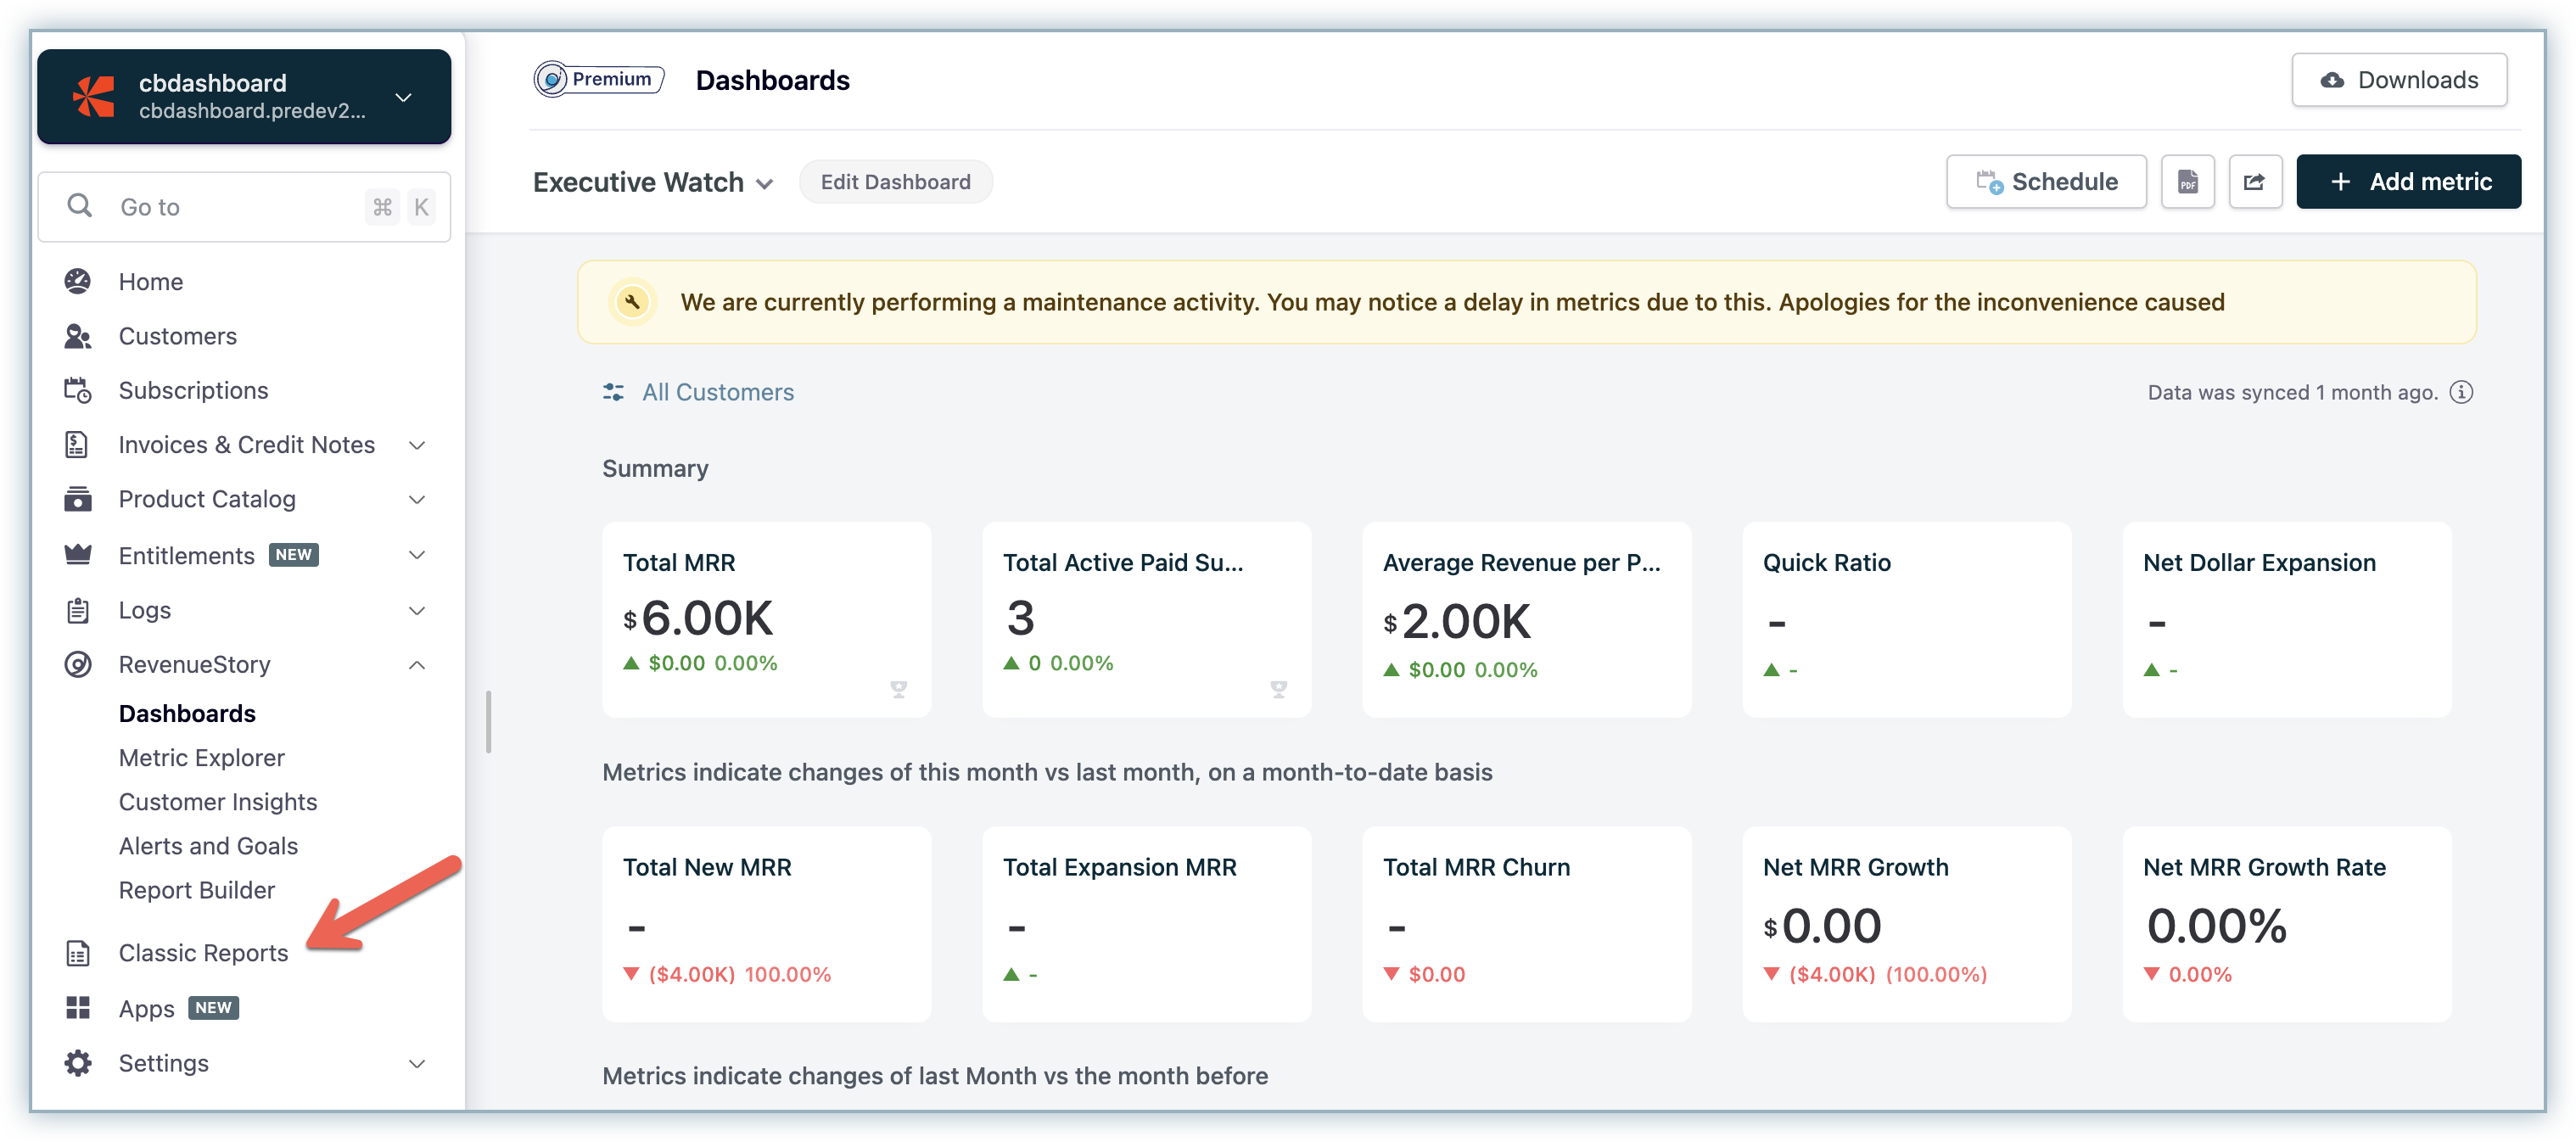
Classic Reports
Attention We will soon sunset the Classic Report. Check out Report Explorer, a more comprehensive solution of classic report features. For more information, read these Classic Report Sunset FAQs.
Chargebee offers different types of reports that are broadly grouped under subscriptions, accounting, and transactions. You can access these reports on your Chargebee site, under Classic Reports.
Learn more about Classic Reports.
Adding RevenueStory metrics to the dashboard
A dashboard is a type of graphical user interface that provides an at-a-glance view of key performance indicators. RevenueStory's dashboard provides a summary of metrics to measure the health of your business.
To add the RevenueStory metrics in your dashboard, do the following:
-
Log in to your Chargebee Site and click RevenueStory > Reports Explorer. Search for the required metric (for example, gross cashflow) in the search bar.
-
Click Add to add the report as a KPI or a Chart in your dashboard. For example, to add this metric as a chart, click Add near the Chart option.
-
Click Add to Dashboard from the Reports Explorer page and the Gross Cashflow chart will be added to your RevenueStory dashboard. Click RevenueStory > Dashboards to view the existing and newly added metrics.
Listed below are the Classic Reports available in Chargebee and their equivalent reports that are available in RevenueStory.
Subscription Summary
The subscription summary section displays information about your sales performance. It contains reports on revenue, signups, activations, failed transactions, canceled subscriptions, subscription count, a monthly report card for plans and add-ons, renewal summary, refund summary, and Average Revenue Per User.
Note
You can also get day-level data with these metrics in RevenueStory. To get the day-level data you need to add the metric to your dashboard at daily granularity.
The following table provides information on the differences between classic reports for subscription data and their equivalent reports in RevenueStory.
| Classic Report | RevenueStory Metric |
|---|---|
| Revenue This report displays the total revenue generated for each day of the current month. Formula: Sum of successful transaction amount after subtracting the refund amount on a particular date where transaction type is not equal to 'Authorization'. | Gross Cashflow Total value of payments received against recurring and non-recurring invoices during a specific period. Formula: Sum of transaction amount filtered by type as payments and status as Success. |
| Signups This report displays the day-wise signup for the current month. Formula: Total count of subscription created on a particular date. | Signups Total number of Signups during the specific period. Note: Creation Date is based on the minimum of Creation Date, Subscription Start Date, Trial Start Date, First Invoice Date, and Activated at date for each subscription. Formula: Count of subscription IDs created during a specific period. |
| Activations This report displays the activations for each day of the current month. Formula: Total count of subscription activated on a particular date. | Activations Number of subscriptions activated during the period, including all Trial to Active conversions. Note: This metric does not include reactivations and only considers the first activation date of the subscription. Formula: Count of subscription IDs activated during a specific period. |
Failed Transactions This report displays the failed transactions for each day of the current month. Formula: Total count of transaction failed on a particular date. | Failed Transactions Total number of failed transactions during the period. RevenueStory groups failed transactions in to the following categories:
|
| Cancelled Subscription This report displays the cancellations done on each day of the current month. Formula: Total count of cancelled subscription on a particular date. | Total Subscription Churn This is the sum total number of cancellations in a certain period of time. This metric does not include trial expirations. Formula: Count of subscription IDs cancelled during a specific period. |
| Subscription Count This report gives you an overview on the number of subscribers you have for all your plans. By default, all subscription states (future, trial, active, non renewing and cancelled) are considered in the count indicated in this report. You can use filters to view the count based on specific subscription criteria. Formula: Count of subscription IDs grouped by plan at present. | Total Active Subscriptions by Plan Total number of subscriptions as of a specific period segmented by plan. Formula: Count of subscription IDs grouped by plan as of a specific period. |
| Monthly Report Card for Plans This report is useful to understand how each of your plan is performing overall. Calculation takes into account the discount / credit applied in the invoice and these are pro-rated, as applicable. Formula: Amount = Sum( (quantity- free quantity)*(amount + discount amount) - tax if applicable) grouped by Plan Id where invoices is in Paid status and paid on that month. | Total Billing by Plan This is the total value of invoices generated from subscriptions segmented by plan. It is the total amount arrived at after considering discounts, coupons, add-ons, taxes. It includes both recurring and non-recurring invoices. Formula: Sum of Total Invoice amount minus any applicable discounts filtered by component type as plan and grouped by plan as of a specific period. |
| Monthly Report Card for Addons This report is useful to understand how each of your addon is performing overall. Calculation takes into account the discount / credit applied in the invoice and these are pro-rated, as applicable. Formula: Amount = Sum( (quantity- free quantity)*(amount + discount amount) - tax if applicable) grouped by Addon Id with invoices paid on date filter. | Recurring Addon Revenue Summary Breakdown of revenue generated from recurring addons. Formula: Sum of Total Invoice amount minus any applicable discounts filtered by product type as addon and charge type as recurring and grouped by addon as of a specific period. Non-recurring Addon Revenue Summary: Breakdown of revenue generated from non-recurring addons. Formula: Sum of Total Invoice amount minus any applicable discounts filtered by product type as addon and charge type as non-recurring and grouped by addon as of a specific period. |
| Refund Summary Provides you with a summary of all the refunds made along with the type of refund (full or partial). You can run the report using different filters to view specific refund types as well as for different time periods. | Refunds Total value of refunds processed for customers during a specific period. Formula: Count of Transaction Ids filtered by Type as Refunds and Status as Success. |
| Average Revenue Per User/Month (ARPU) Measure of the revenue generated per user for the period of a month. Calculation is basically done by dividing the amount paid by the user by number of months the user is active. For currently active users, ARPU is calculated by using the period from the activated date till the next billing date. For cancelled users, it is calculated by the number of months between the date of activation and the cancellation date. | Average Revenue Paid per Subscription (ARPS) The average revenue earned per paid subscription per period. Formula: Ratio of monthly recurring revenue and active paid subscriptions as of a specific period. |
Renewal Summary
Classic reports in Chargebee provide Renewal Summary report, which is used to list all future and past renewals for a specific period. It does NOT include one-off invoices and pro-rated invoices that are raised in the middle of a billing term.
Note
Currently, RevenueStory does not support the Renewal Summary metric.
Accounting
You can find reports related to accounting such as account summary reports, aging, tax summary, and tax exemption report in classic reports.
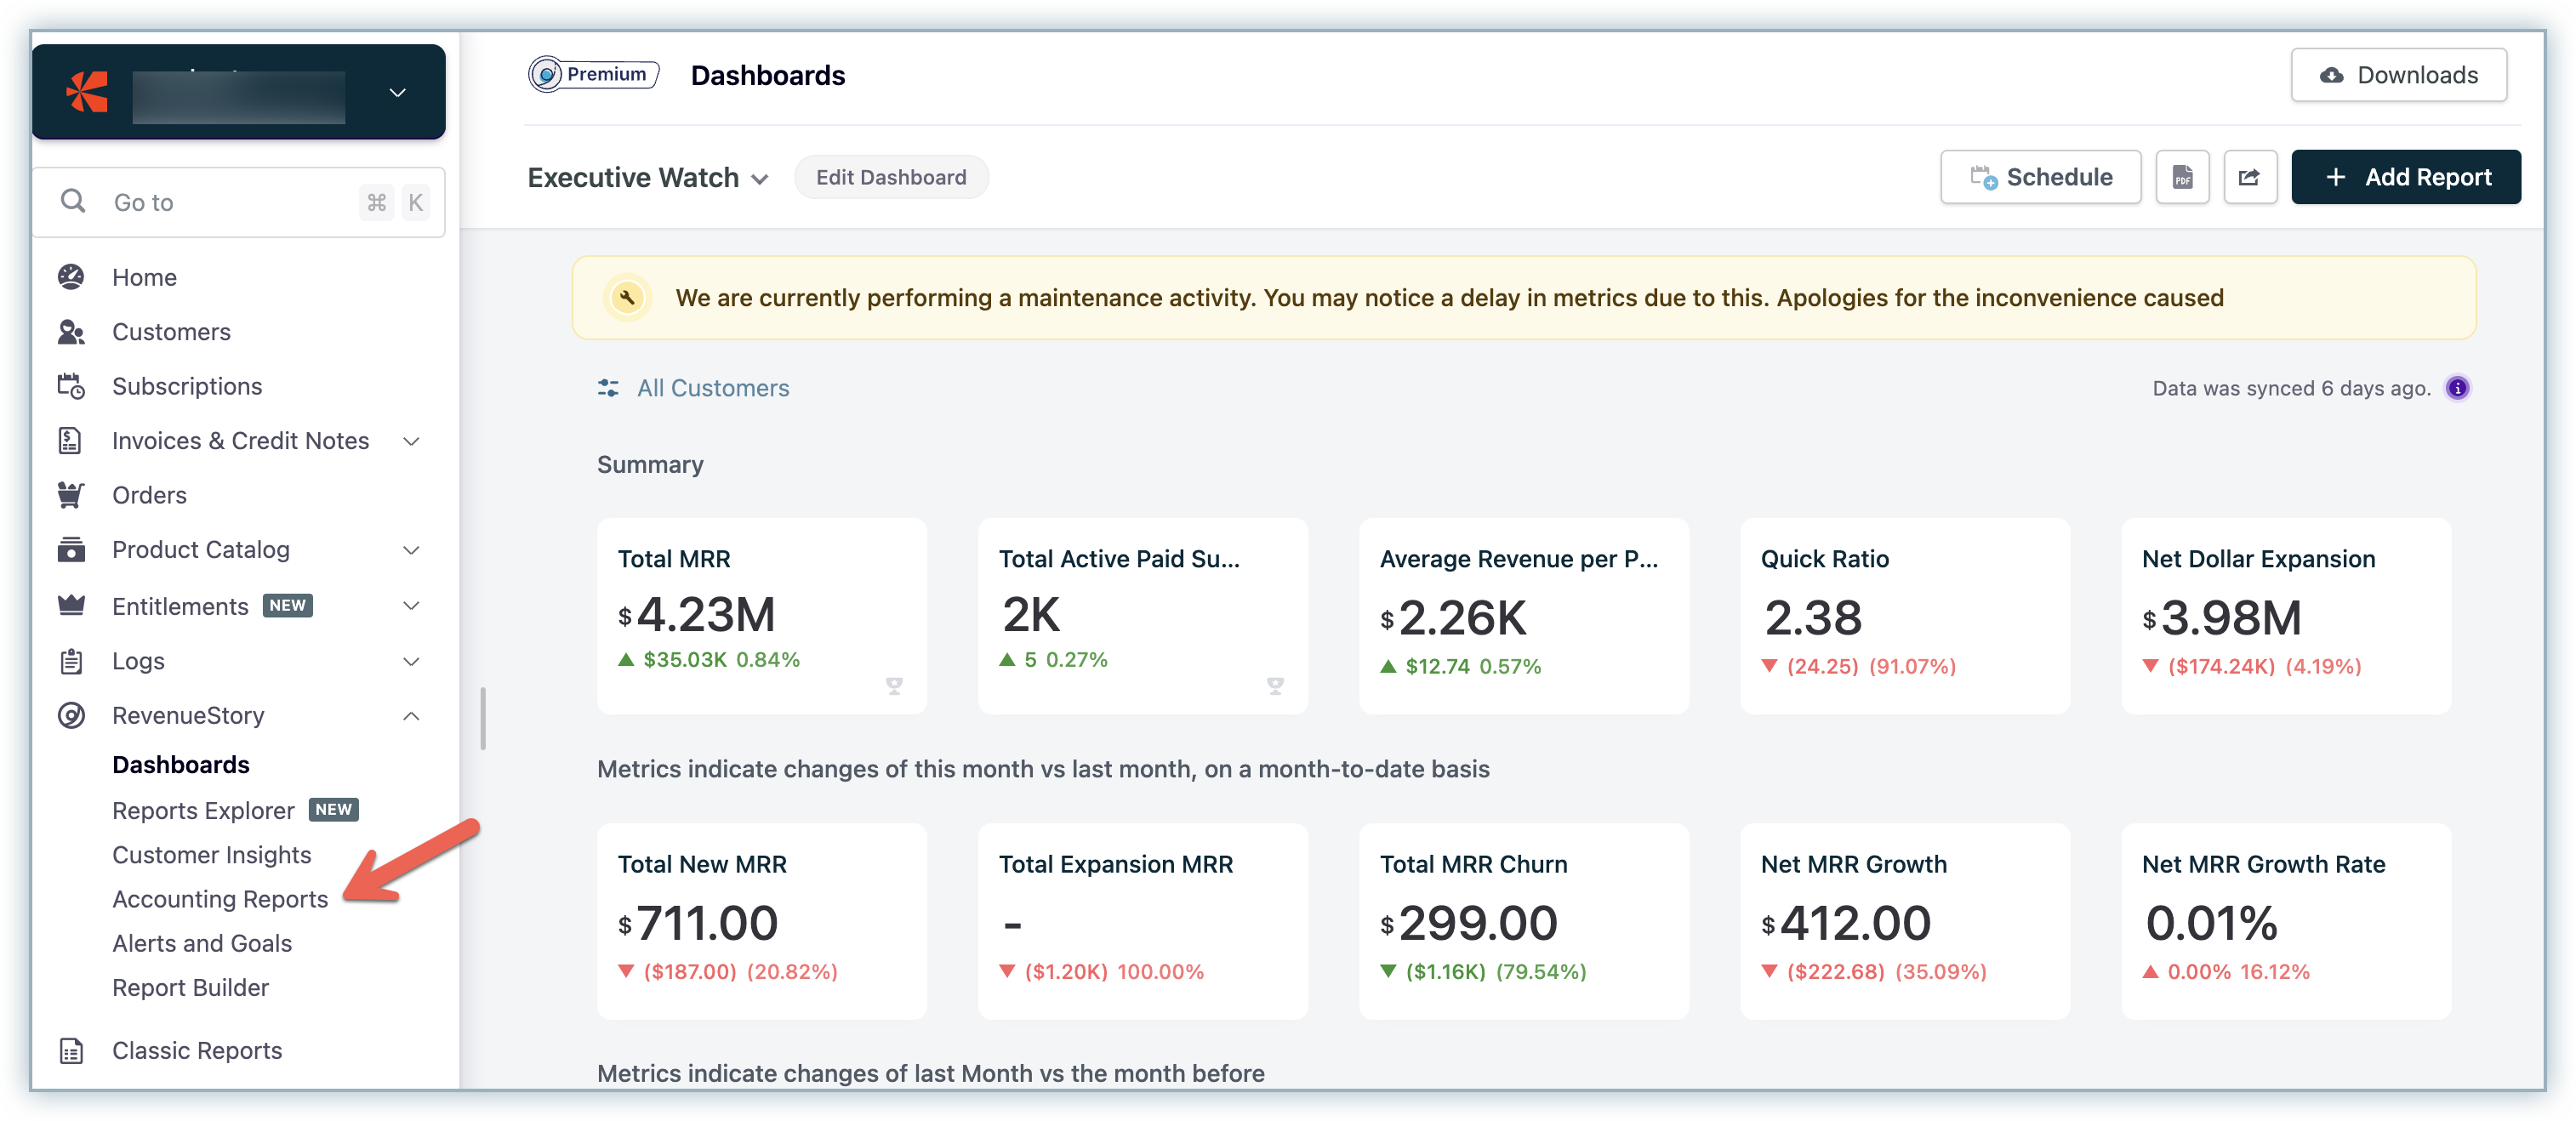
To view the accounting reports in RevenueStory, do the following:
Log in to your Chargebee Site and click RevenueStory > Accounting Reports. View the account summary from the Accounting Reports section.
Note
Classic reports show only the last 24 months of data whereas the accounting reports in RevenueStory can display data from any year as required.
The following table provides information on the differences between classic reports for accounting data and their equivalent reports supported in RevenueStory.
| Classic Report | RevenueStory Metric |
|---|---|
| Accounting Summary Report The Account Summary report is a monthly report of your sales, discounts, bad debts, and reversals, that can be used for accounting purposes. | Account Summary The Account Summary metric displays the monthly report of your sales, discounts, bad debts, aging balance and reversals.Note: Credit notes generated to cancel the invoice are not considered for calculation. |
| Account Receivable (A/R) Aging Report An aging report gives you a detailed view on the outstanding invoices based on the invoice date or due date. The value displayed in the report is the net due amount of the outstanding invoices. | Account Receivable (A/R) Aging The Account Receivable - Aging report displays the AR Aging and Amount Due. |
Tax Summary Report The tax summary is a comprehensive report of all your taxable sales made during a specific period. | Tax Summary Breakdown of total taxes applicable for invoices during a specific period. RevenueStory classifies these reports as the following:
|
Tax Exemption Report
This is a comprehensive report of all the exempted sales made during a specific period. It contains details of the exempted portion of your sales and the reasons for exemption.
Transactions
The transaction section of the classic report contains reports such as transaction summary, transaction trend, and lost opportunities.
The following table provides information on the differences between classic reports for transaction data and their equivalent reports supported in RevenueStory.
| Classic Report | RevenueStory Metric |
|---|---|
| Transaction Summary Displays a summary of all the payment transactions (success, failure, voided, etc.) within the system. | Payment Transaction Breakdown A summary of successful, failed, voided, in-progress and timeout payment transactions month-on-month. Refund Transaction breakdown A summary of successful, failed, voided, in-progress and timeout refund transactions month-on-month. |
| Transaction Trend Transaction trend displays daily transactions, average transaction by day of the week and hour of the day. Daily Transactions shows the total number of transactions that occurred in a day. Average Transactions by Day of Week displays the average number of transactions that has occurred during the specific days of the week based on the transaction date you specify. Average Transactions by Hour shows the average number of transactions based on the hour of occurrence. | Number of Payment Transaction Total number of payment transactions during a specific period. Formula: Count of Transaction Ids filtered by status as success and type as payments. Number of Voided Payment Transaction Total number of voided payment transactions during a specific period. Formula: Count of Transaction IDs filtered by status as voided and type as payments. Number of Failed Payment Transaction Total number of failed payment transactions during a specific period. Formula: Count of Transaction IDs filtered by status as failed and type as payments. Number of Refund Transaction Total number of refund transactions during a specific period. Formula: Count of Transaction Ids filtered by status as success and type as refunds. Number of Failed Refund Transaction Total number of failed refund transactions during a specific period. Formula: Count of Transaction IDs filtered by status as failed and type as refunds. |
Lost Opportunities
This displays the opportunities that have been lost or missed. These are all the customers who tried to sign up with you but were unable to. It displays the email addresses of users whose sign-up attempt failed along with details including the total number of attempts made, the time of the most recent attempt, and the maximum amount they tried to sign up for during these attempts.
Note
Currently, RevenueStory does not support the Lost Opportunities metric.
Please refer to this link to learn more about the recent changes that Classic reports have undergone.
Was this article helpful?