Google Analytics Hacks for Subscription Businesses
11 MIN READ
|
Updated on June 10, 2024
A promise is a promise.
We gave you a comprehensive list of Analytics and Tracking tools for Subscription Businesses in one of our previous posts, and we promised you that we would talk about each website analytics and tracking tool in detail.
So here’s our first post in keeping with that promise, and this time it’s Google Analytics (which was pretty obvious from the beginning, I know).
What we’re going to do now is look at how a SaaS startup can best leverage Google Analytics to optimize its service, at each stage of its customer life-cycle. We’ll be using Dave McClure’s “AARRR” model to guide us through the process.
We’ve taken the example of a SaaS business that lets you browse, listen to and download songs. So the examples of metrics mentioned throughout the blog would be aligned to this business – just to make things clear.
Shall we begin?
Ok before you start getting your hands dirty, you need a plan – a proper plan to get you started.
Avinash Kaushik has given a beautiful framework to help you out with this.
The plan ideally is a five-step process:
Now that we hopefully have a plan and a bit of clarity as to what to watch out for, let’s get into action.
The first step. Get people to your site. Then? Get them to take a desirable action. Keeping an eye on your acquisition data will give you an idea of whether your marketing efforts are paying of, and as to which channels are better than the others. It also shows who are getting more attracted to your product, aka your target customers.
The basic objective of any website would be to get their attention and get them to take an action because of it. An ideal action would be to sign up for your free trial. Apart from that, actions like subscribing to your blog, newsletter, drip campaign, etc., would serve as good micro-conversion goals. But please, please do not rely on pageviews to represent your acquisition; it’s a vanity metric which has received its own share of brickbats from experts like Eric Ries and hence let’s just do away with it.
For tracking the above mentioned actions, all you need to do is to create “Goals” for each of those actions. Look at the conversion of these goals – to consider a visitor as “acquired” (Goals → Overview report → Goal Completions, Goal Value, and Goal Conversion Rate). One thing to keep in mind, while tracking the conversion rates, is to look at the rate as well as the numbers – percentages can be deceptive at times.
Tip: You can easily determine how much you’ve earned once a visitor signs up for a paid plan. But does it mean that you earn nothing when he/she subscribes to your newsletter? No. So how do you assign economic values for your micro-conversion goals? Read this blogpost by AK to learn how to do it.
Also, keep in mind that just visiting is different from getting engaged. So set yourself realistic targets to consider a visitor as acquired/engaged – say they read “x” number of posts before subscribing to your blog, spent more than “x” seconds or visited “x” pages before signing up for your free trial, etc. Visitors who don’t meet those criteria would become a part of what we call “Bounce Rates” or “% Exit”.
Next step – segment and analyse those acquired visitors – who are they? What are they trying to solve (Keywords analysis)? Where are they coming from (Direct/Referral/Search/Social)? Is there a pattern in their behavior?
Okay so what’s the point of setting up goals? With data like these, segmenting and targeting customers becomes very easy. You’ll also gain insights on the effectiveness of your website in retaining the attention of the visitors – minute attributes which could produce considerable results when worked on.
So now you know how to measure your website’s acquisition. But how do you make it better?
Not all your visitors get converted, and those who convert, usually don’t convert instantly; the decision process takes a longer time than what marketers expect. And this takes an even longer time (Image), if you’re running a B2B subscription business (and hence it becomes all the more important to pay attention to this).
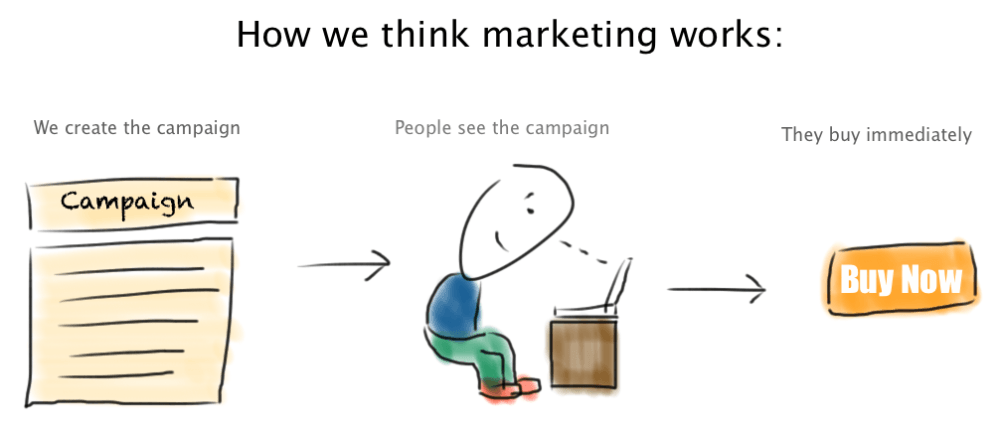
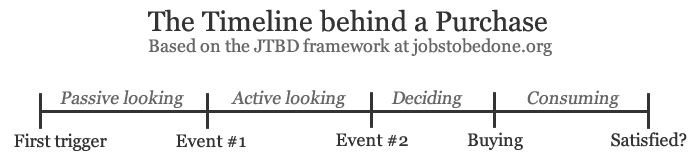
Image source: http://justinjackson.ca/play-the-long-game/
Hence, acquisition becomes all the more elaborate for a subscription business. And the easiest way to acquire customers is by getting to those people who’ve already visited your website and have taken a few actions.
With the aid of GA, you can create a Remarketing List, by pin-pointing to specific groups of visitors (say, visitors who abandoned after viewing the pricing page), using a set of criteria or events and can show them tailored messages with the help of features like Remarketing Lists for Search Ads (RLSA) and Dynamic Remarketing.
This happens once the acquired customer starts using your app, i.e., once he/she moves to the acquisition stage.
You got the user to signup. Your next task would be to get them close to reaping the benefits of your app – benefits which you had promised in the acquisition stage – an effective onboarding process. And this is the stage to evaluate that. To set goals to measure the same, your attention will have to move to the in-app behaviors of your customers.
So your next question would be:
I know that Google Analytics metrics will help me track user behavior on my website. But how can I track their behavior within my app (using Google Analytics)?
Pollen.io have found a solution to do just that – to understand their user behavior and to improve the usability of their app.
You would’ve built your product with specific use-cases in mind, based on the different customer personas you’ve developed. So all you have to do is set up goals for the use case, and track your app users’ conversions with respect to those goals.
Once you specify a particular path/sequence of steps that you would want your visitors to follow in your app (Eg. Browsed through the albums list → Selected a album → Listened to a song → Added the album to the wish list) , you can check as to which step they are falling out at (Abandonment rate), by making a funnel for the final goal, which in this case would be “Added the album to the wish list ”.
Fix a goal, create funnels for that goal, and you’re good to go. Once you identify the steps with high abandonment rates, you can tweak them, test them, figure out what’s working (and what’s not), test the abandonment rate again, rinse and repeat.
Tip: PadiTrack for Google Analytics gives you great funnel reports (it’s free, as well). (Update: PadiTrack has been discontinued – here’s a Google Sheets alternative)
Adding “Dimensions” is another trick that would add more context to the events that you record. For instance, adding the dimensions like Plan type, total tenure of the user, etc., and comparing them with the user’s behavior would give you a much deeper and more complete understanding. Add “User id” as a dimension, now you can drill down to the actions of individual users.
You can then find out people from which source are converting better (i.e., are advancing to the activation stage). You’ll get to know where to target and whom to target – you can’t afford to keep feeding the wrong market and the wrong source.
Tip: Create a predefined segment for “Sessions with Conversions”. You can then compare “all sessions” or “sessions without conversions” with the “sessions with conversions” in Acquisition → New Users report and Behavior → Behavior Flow report to identify their behavior patterns.
This stage is all about getting the activated customers hooked to your app, to keep them coming back.
The retention criteria varies from one business to another. Some apps require the customers to sign in daily, some weekly, some monthly, and so on. So depending on your service, you can set corresponding yardsticks to measure the retention level of a customer – it could be logging in “x” times within “x” days after signing up with you.
Please note here that retention is not engagement. While the former deals with customers coming back to your app (visits), the latter would deal with the time spent on your app (time on page). For example, Google is a high retention, low engagement site. So before you decide on what to track for retention, you must be clear with this difference.
To track the users who are coming back, you just have to get the count for “new visits”, and then subtract that from the aggregate count (or 100%). What you’re left with are the returning users.
Referring to the Cohort Analysis report (with the metric as “User Retention”) will give you a clear picture of your retention rate and how it’s been changing over time. Again, depending on the nature of your app, you might want to change the cohort size and range. Segmenting the cohort report, will show you users from which sources/campaigns/channels are sticking longer with you.
Using the Custom Dimensions feature, you’ll be able to define a particular segment of users (with a specific condition) to be called as “Activated Users”. Applying this segment in the Cohort Analysis (based on their date of first visit), will help you in filtering out the activated users and in analysing their retention rates.
Tip: Audience → Behavior → New vs Returning lets you compare the two segments of users. Audience → Behavior → Frequency vs Recency shows the number and percentage of users who’ve been coming back to your page for a specific number of times. Note that you must use the Day/Week/Month level of aggregation depending on your app’s usage.
This stage is all about converting your customers into your evangelists. Through proper url tagging (utm_source, utm_medium, utm_campaign), you’ll be able to trace the campaign that is bringing you more visitors (bringing us back to the acquisition stage).
To give you an example of a good referral campaign, when you signup with Typeform, a SaaS app that lets you create online forms and surveys, you receive a welcome email with a link (http://www.typeform.com/?utm_source=twitter&utm_medium=social&utm_campaign=onboarding_email_1) that asks you to send out a tweet telling the world how excited you are on signing up with them.
One thing to keep in mind is that you mustn’t stop with the visitor traffic alone. You must also find out how many of those visitors are actually converting and which source/channel is bringing you maximum conversions.
Let’s face it. The prime purpose of running any business is to sell – no denying that. And for SaaS, conversion ideally happens when a person moves from your trial version to your paid plan (if you have a trial plan, that is). So all your efforts boil down to how you get people to become your customers – to part with their hard-earned money.
So the main goal for this stage would be the customer moving from a trial plan to a paid plan – the most obvious macro conversion goal out there.
Define your plans using Custom Dimensions, set event goals for each of those dimensions, and track the conversion of each goal. This will enable you to know when a customer pays/subscribes.
Let’s say, you create plan-specific urls. So whenever a user subscribes/pays for a plan, he/she’s taken to that specific url, which in turn converts the corresponding goal, and there, you’ve tracked a transaction!
If you need a good launchpad, our recommendation would be AK’s Occam’s Razor Awesomeness. Packed with 6 Segments, 9 Custom Reports and a VP, Digital Dashboard (instead of the default Starter Dashboard), it is the perfect base to start your GA journey.
A final takeaway – whatever metric you track, make sure that you segment it, and get into the in-depth details, instead of just looking at them superficially. As Avinash Kaushik puts it, “Segment or die” !
Not convincing enough? Look at this case.
Let’s say you single out that specific segment of users who upgrade their plans quicker than others. You gather all possible data relating to that segment – traffic sources, campaigns, locations, keyword searches, their grandmother’s maiden name (the last one is optional though). Now you know where and how to find more of these people, or in other words, how to earn more, easily!
To conclude, Google Analytics is ideal for tracking Acquisition, but the same cannot be said for tracking in-app behavior (in other words, to measure your Activation, Retention and Recurring Revenue). If you’re bent on using just this tool alone for your business’s analytics, then you can implement our suggestions. But if you’re open to using other tools that look into much deeper details, then we’d recommend tools like KISSMetrics and Mixpanel (about which we’ll be discussing in the subsequent posts, as promised).
There!
One done. Four more to go (Mixpanel, KISSMetrics, CrazyEgg and Quantcast – to be precise). We’ll keep you posted once they’re out!
P.S. A hearty thanks to Aditya Thoomati from Marketing, for his valuable contributions to this post (and for patiently handholding me through the process).