Frequently Asked Questions
1. What is the difference between Current MRR (Monthly Recurring Revenue) and MRR in RevenueStory?
Current MRR (Monthly Recurring Revenue) refers to the subscription's MRR that is available at the moment. MRR refers to the subscription's recurring revenue for a given period. Ensure that you use the subscription's MRR metric when you want to view historical information. Selecting Current MRR metric will display the current recurring revenue (in View underlying data) no matter which date is selected.
2. How are site custom fields used in RevenueStory?
Site-level custom fields in Chargebee (for customers, subscriptions, and item prices) can be used in RevenueStory to filter, group, and analyze data for tailored reporting and insights. Learn more about custom fields in Chargebee
3. What are the Premium features available in RevenueStory? How is it different from the standard plan?
Here is a comparison of the Standard and Premium Plan in RevenueStory:
| Feature | Standard | Premium |
|---|---|---|
| Report Builder |
|
|
| Email Scheduling | Allows three email schedules (per user). | Supports unlimited email schedules. |
| Dashboard Sharing | Does not allow sharing of dashboard templates. | Supports unlimited dashboard sharing. |
| Custom Fields | No custom fields support for metrics/reports/filters |
|
| Site consolidation | Does not support consolidated reporting. | Supports consolidated reporting. |
| Alerts | Supports only one alert per site. | Supports unlimited alerts for key metrics. |
| Goals | No support for goals. | Supports unlimited goals for key metrics. |
| Premium reports | - | A specially curated list of premium reports. (45+) |
| Customer Insights | No customer based reports supported | Reporting based on customer level + Parent level (for account hierarchy enabled domains) |
4. How do I analyze my data by Plan or Addon in report builder?
You can analyze the data by Plan or Addon using the Monthly Component History and Yearly Component History and Product Type in Visual reports.
5. What are classic reports? Are the equivalent of classic reports available in RevenueStory?
Classic reports are reports that are available in Chargebee. Chargebee offers different types of reports that are broadly grouped under subscriptions, accounting, revenue recovery, and transactions. Learn more
6. How is MRR calculated in Chargebee?
Refer to thislink to know how MRR calculated in Chargebee.
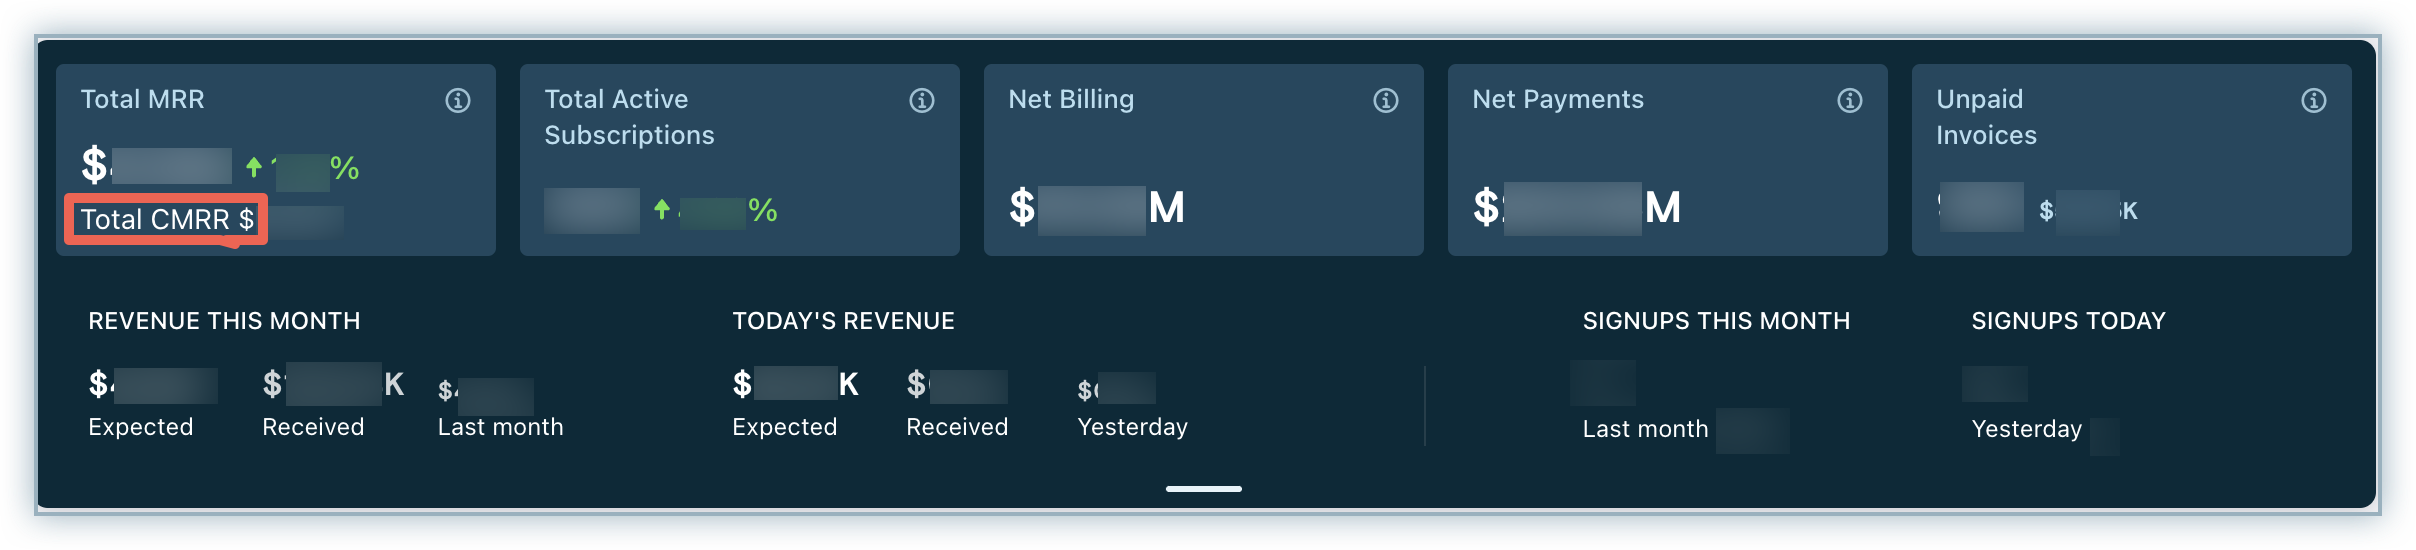
7. What is the difference between expected revenue and CMRR?
(CMRR) is the Monthly Recurring Revenue (MRR) that we can expect to get in the future from activations, scheduled changes, and cancellations on subscriptions in addition to the current MRR. Based on this, CMRR can be higher or lesser than the current MRR. Also, CMRR is similar to MRR as it calculates the normalized monthly recurring revenue that one can expect to earn from subscriptions.
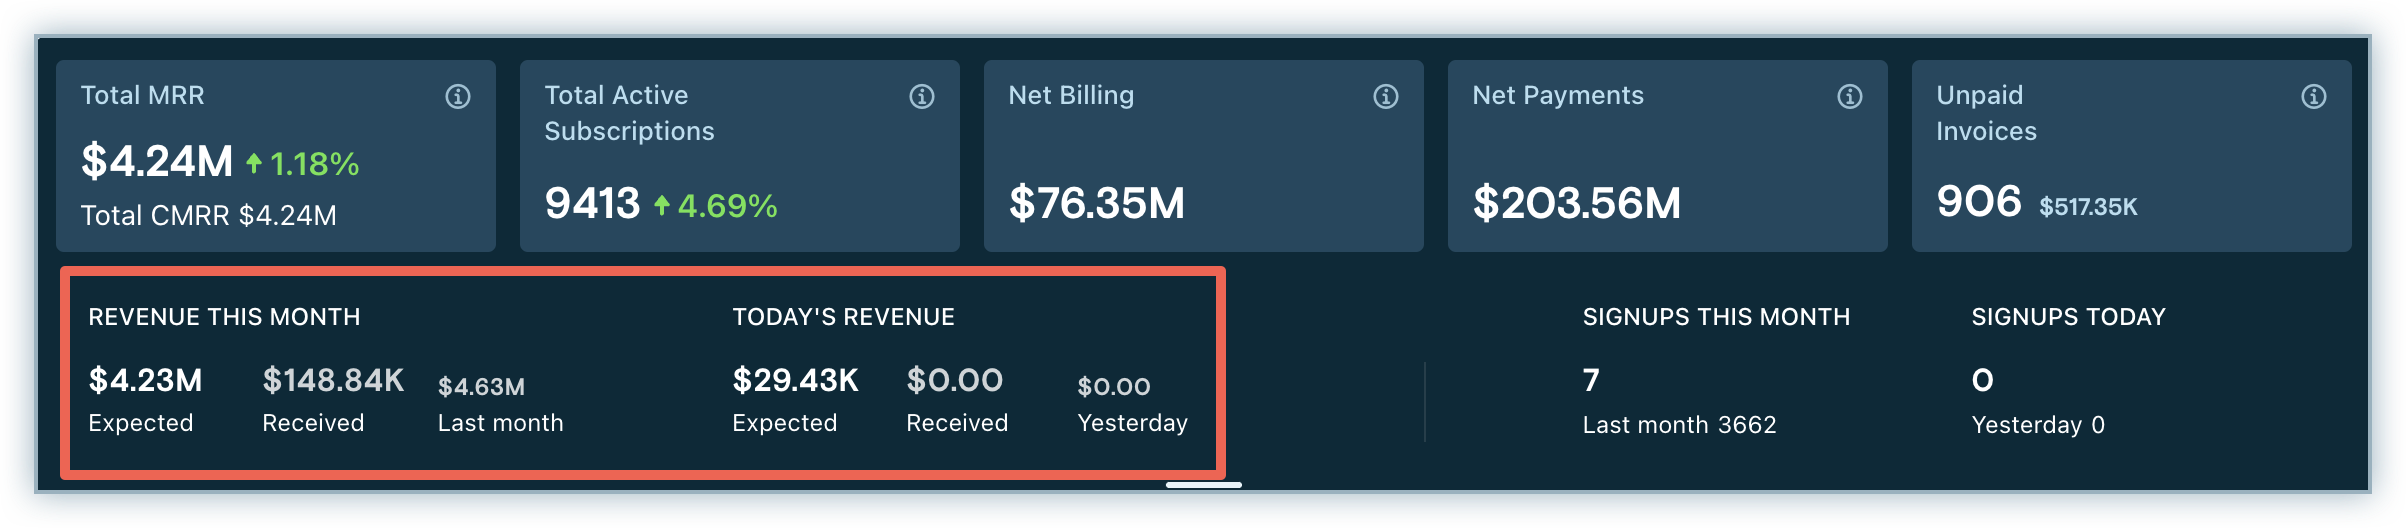
Expected revenue is an invoiced revenue that you can expect to receive from your customers by end of the day or month. The composition of your expected revenue metric is dependent on your site-level settings. This could include Payments, refunds, revenue from pending renewals, revenue from expected trial conversions, and revenue from overdue invoices. Expected revenue is not the normalized monthly revenue but the overall revenue that is expected by the period's end (day or month). The daily expected revenue includes invoices in dunning.
In Chargebee expected revenue is available in two variants.
Expected revenue this day - Using this metric, you can understand the revenue that you expect to receive by the end of the day.
The daily expected revenue is calculated as received revenue (default) + upcoming renewals (default) + trial and future subscriptions with cards (optional) + invoices in dunning (optional) + monthly revenue calculations (optional).
Expected revenue this month - Using this metric, you could understand the revenue that you expect to receive by the end of the month.
The monthly expected revenue is calculated as received revenue (default) + upcoming renewals (default) + trial and future subscriptions with cards (optional) + monthly revenue calculations (optional)
For example, if you have a quarterly plan with an amount of $300 from a subscription, which is expected to be activated in the current month, CMRR will be $100 whereas expected revenue will be $300 from the subscription.
8. Why should MRR not be used for GAAP accounting?
Generally Accepted Accounting Principles (GAAP) is a traditional accounting methodology that refers to a common set of accounting principles and standards issued by the Financial Accounting Standards Board (FASB). GAAP metrics do not consider delayed profitability into account. These metrics rely on the sales that have already been made.
However, with the SaaS business, things are different. To begin with, Monthly Recurring Revenue (MRR) is not a reportable GAAP revenue. The revenue is not calculated based on past sales, but on current and predicted subscriptions. In simple terms, MRR is a predictable measure and not a recognized revenue. MRR calculates an expected revenue number to clarify where your company's performance is headed and indicates what you can expect based on the existing customers, sales, upgrades, churn, and so on.
Several metrics have been adopted across the SaaS industries to keep track of their business performance. Metrics such as Monthly Recurring Revenue (MRR), Annual Recurring Revenue (ARR), Committed Monthly Recurring Revenue (CMRR), Churn, and so on have become standard when measuring the performance of a SaaS company.
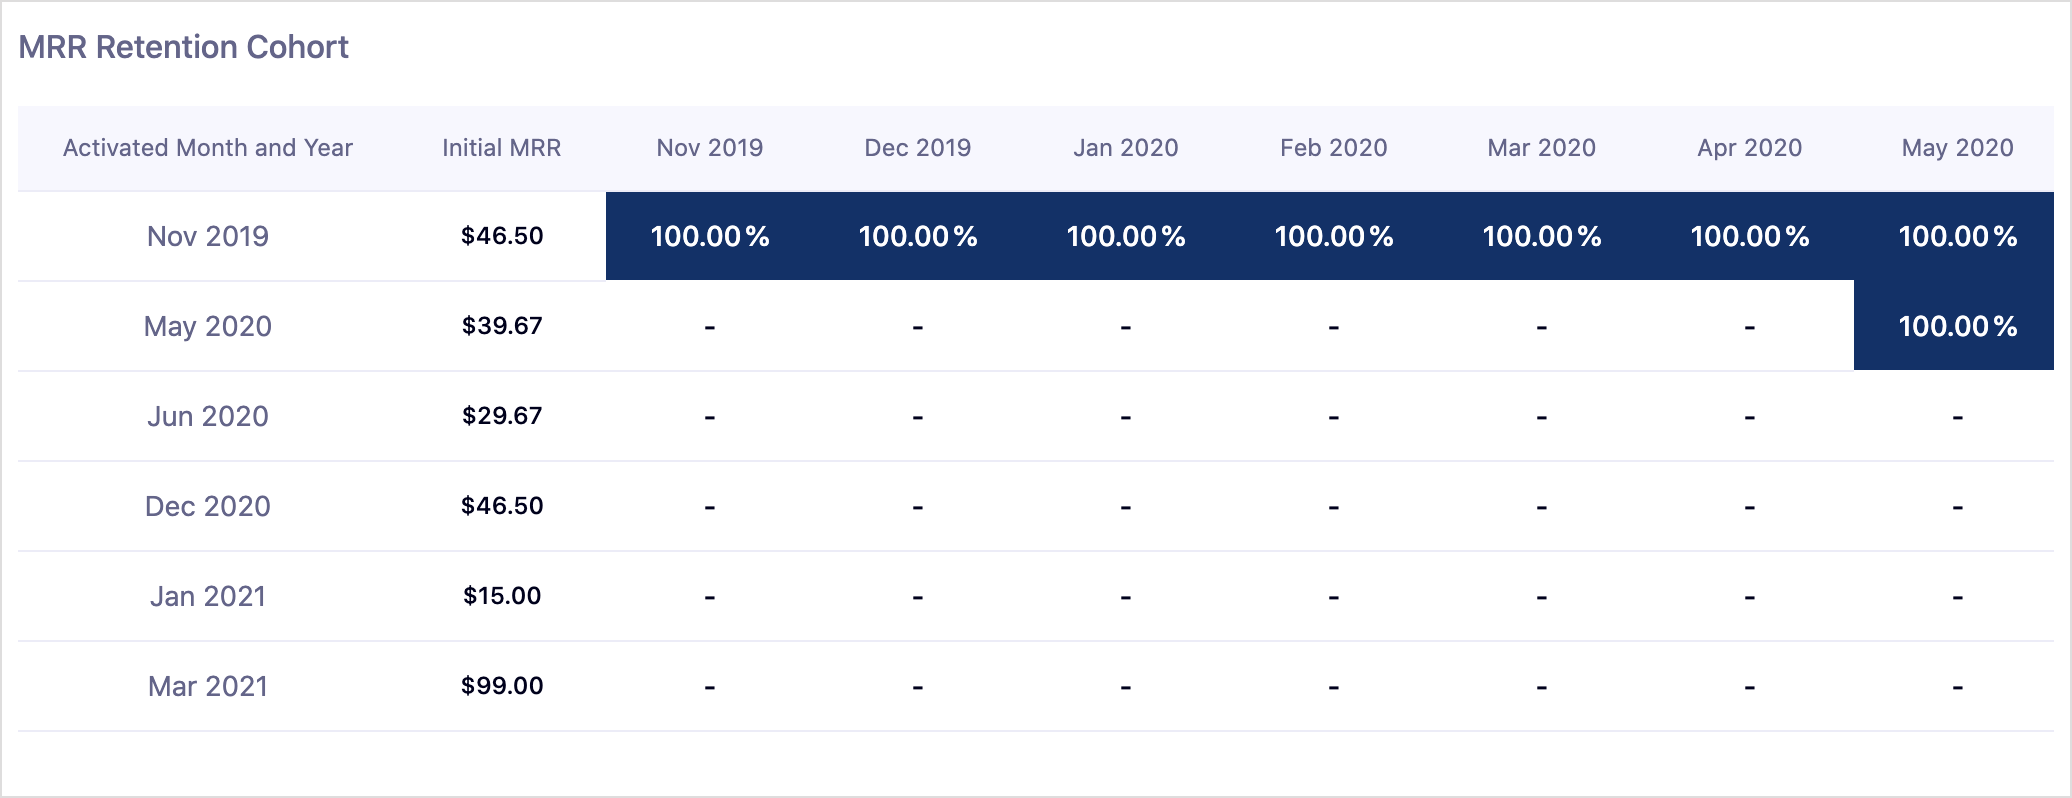
9. What is MRR Retention Cohort and how do I build a custom MRR retention cohort in Report Builder?
MRR Retention Cohort is a metric that shows how you've been retaining the MRR earned from a cohort of subscribers activated in a month, over the subsequent 12 month period. A retention rate greater than 100% is great news.
Let's understand this with a few examples:
Example 1:
A bunch of customers activated in a month (say Jan 2017) with an initial MRR of $1000 are growing to $5000 MRR in Dec 2017. Your retention rate for Dec 2017 is increased to 500% in this case.
Example 2:
If you had $1000 MRR at the beginning of a month and lost $100 MRR due to churn, but still gained $200 MRR from product upgrades in the same month, the MRR Retention Rate for that month would be 110%.
Cohorts are good indicators of both Lead quality (when you traverse growth row by row) and the impact of your product and engagement activities (when you traverse by columns). Also, look at your MRR cohort in conjunction with the Subscription Retention Cohort to see how many customers in the original cohort have been retained after 12 months. One big customer could be pulling the entire cohort forward, or one churn could cause a huge drop. If you see a sudden up or down in percentage, you need to look at the subscription retention cohort to see if this is a trend or a one-off caused by few customers.
MRR retention cohort is an OOTB report available under Reports Explorer which provides a monthly view of the cohort retention rates for the last 24 months. If your requirements are to create a customized MRR retention cohort, this can be achieved using a report builder.
To build a custom MRR retention cohort in Report builder, follow these steps:
-
Click RevenueStory > Report Builder.
-
Select Summary Report.
-
Select Subscription activation date from Subscription resource in the row grouping. Default grouping is year and month.
-
Select MRR change date from Monthly subscription history resources in the column grouping. Default grouping is year and month.
-
Select MRR in the values. Default aggregation is Sum.
You will be getting the MRR trends of subscriptions cohortized by activation month and year. The customer can choose a filter to get data as per their requirements.
Note
Apply filters by selecting the last date of the previous month and not of the month for which the cohort analysis is needed. The underlying data can be obtained by selecting the build as a detailed report option on the summary page. e.g. for cohort analysis starting from January 2021, we should select the activation date as "is after" 31 Dec 2020 and not 1 Jan 2021.
10. How does RevenueStory handle currency conversion and exchange rates?
Reporting Currency and Exchange Rates
- RevenueStory uses a reporting currency to convert transactions across multiple currencies into a single common currency for reporting.
- By default, the base currency and the manual or auto exchange rates configured in your Chargebee siteis used as the reporting currency.
- If you do not want to use the base currency set up in Chargebee site as the Reporting Currency, you can contact support to change the Reporting Currency in RevenueStory. In such cases where the Reporting Currency is different from site base currency, RevenueStory will use auto exchange rates by default for currency conversion and does not support manual exchange rate entry.
How exchange rates are applied
- RevenueStory always uses the latest available exchange rate.
- Exchange rates are available at a daily granularity: If a day is completed, that day’s exchange rate is used.
- If a day is in progress, the previous completed day’s exchange rate is used.
Impact on reports
- Period-based reports (e.g., MRR) use the exchange rates as of the last completed day of the reporting period. For example if daily reports use the exchange rate of the latest completed day, and monthly reports use exchange rate of the last completed day of the month.
- Transaction-based reports (e.g., billing, invoices) Uses the exchange rate as of the transaction date.
11. How is the Lifetime Value metric calculated in RevenueStory?
The Lifetime Value (LTV) is a metric that provides the financial worth of a subscription during its lifetime, to the business. In other words, it is the average revenue that a subscription generates until it cancels.
Lifetime Value = Paid subscription lifetime × Average Revenue per paid subscription (ARPS)
Note
LTV calculation includes the historical MRR of any subscriptions imported in Chargebee.
Average Revenue per paid subscription is calculated as the ratio of MRR for the month and total active paid subscription for the month.
Average Revenue per Paid Subscription (ARPPS) = Total MRR / Total Active Paid Subscriptions
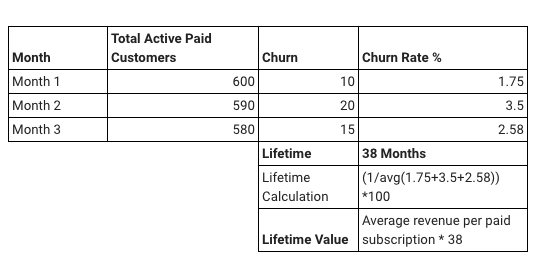
Paid subscription lifetime is calculated as the inverse of the average churn rate for the last three months
Paid subscription lifetime = 1/Avg(Churn rate current month + Churn rate previous month + Churn rate the month previous to the previous month)
Example
Consider the duration of three months from January to March.
-
At the end of January, the total active paid customers were 600, and the churn for January was 10. The churn rate % is calculated as (10 ÷ 600) × 100 = 1.75.
-
At the end of February, the total active paid customers were 590, and the churn for February was 20. The churn rate % is calculated as (20 ÷ 590) × 100 = 3.5.
The same procedure applies to the upcoming months.
If you take the inverse of the average of the last three months' churn percentage, you would be able to get the Lifetime of a subscription.
If you multiply the lifetime with the average revenue per paid subscription, you will arrive at the lifetime value of a subscription.
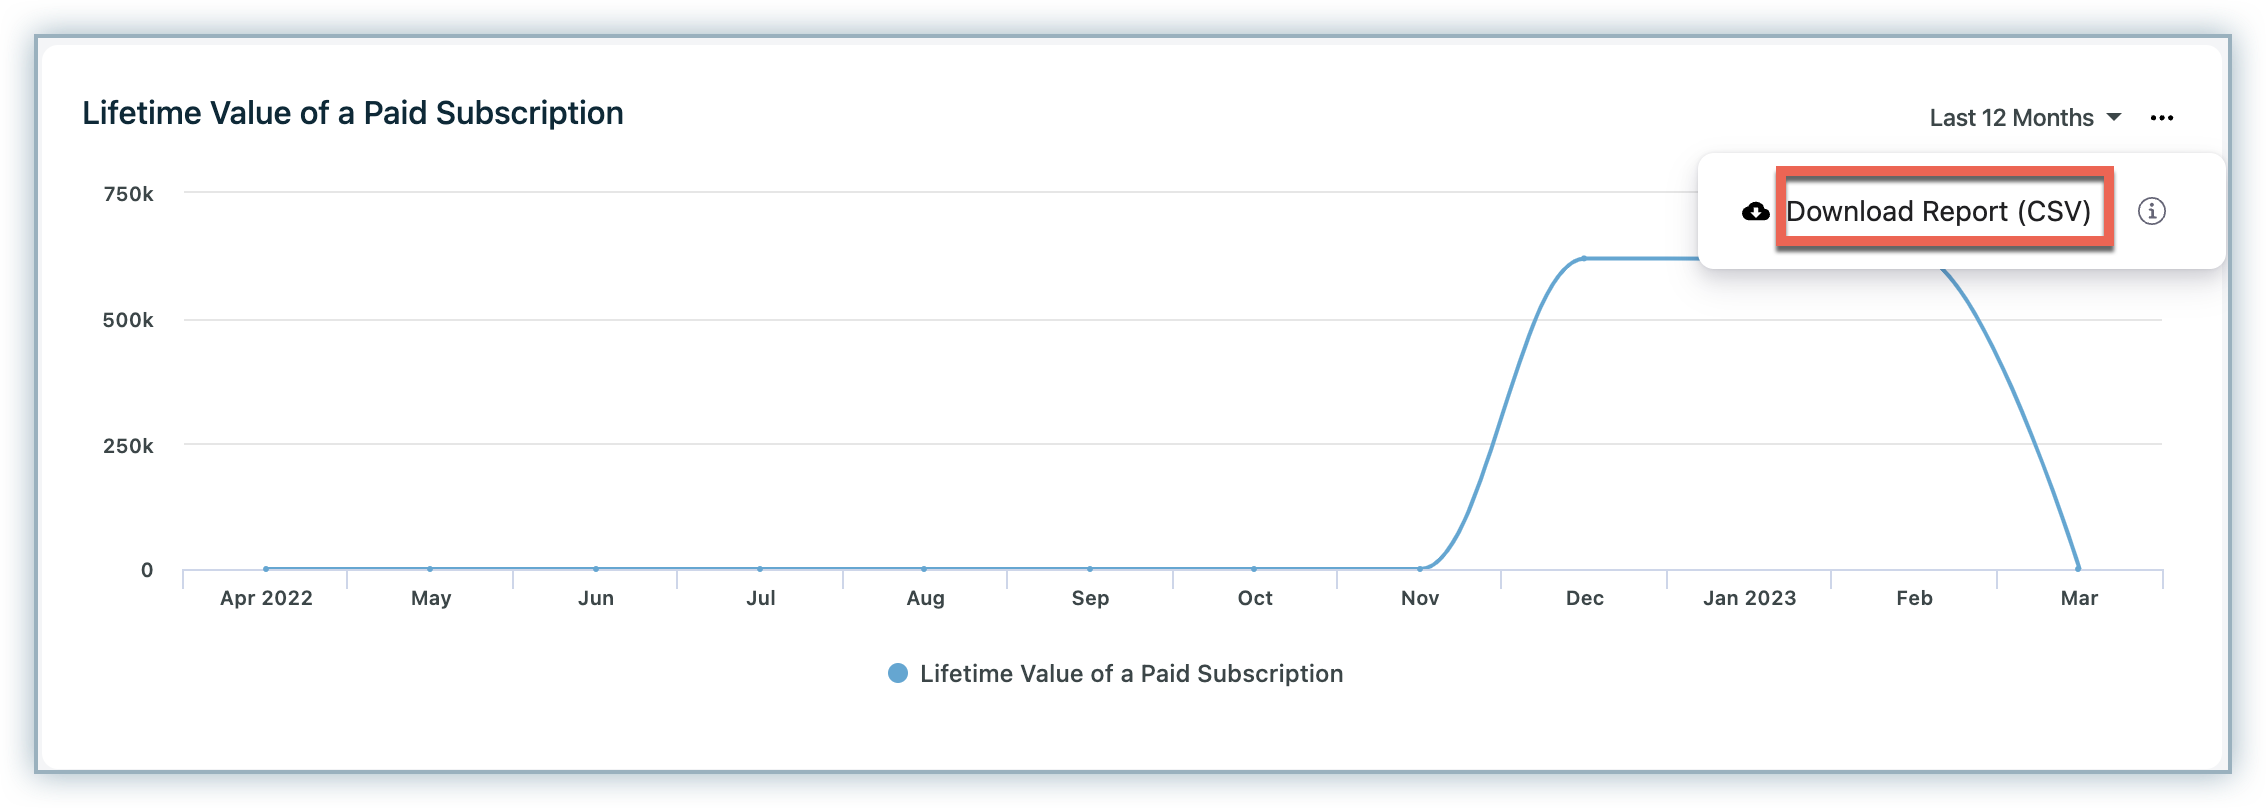
Note The "lifetime value" metrics in Revenuestory do not have the "View Underlying Data" option. This is because it is merely a projection of how many months into the future the subscription would exist. However, you can download the entire report using the Download Report option:
You can access the LTV (lifetime value) report in Chargebee under Menu > Revenue Story > Report Explorer.
12. How does changing my Chargebee site's time zone affect the data in the dashboard?
Once the time zone is altered, the data displayed in the Dashboard will vary accordingly and align with the new time zone. However, the change in alignment will leave a time gap or time overlap depending on the new time zone you choose.
Time Overlap: Time overlap is when the new time zone is shifted from UTC to a time zone that falls before UTC (i.e., New time zone = UTC+[hh]:[mm]). Like IST, which is UTC+05:30 hours.
Say you change the time zone of your Chargebee site from UTC to IST in January. This will ideally mean that all the transactions that had gone through in the last 5.30 hrs in December will now also belong to January, which will leave the metrics with an overlap.
To handle this data overlap, Chargebee will not shift the data to the current month since the data was added in last month already.
Time Gap: Time gap is when the new time zone is shifted from UTC to a time zone that falls after UTC (i.e., New time zone = UTC-[hh]:[mm]). Like PST, which is UTC-07:00 hours.
Say you change the time zone of your Chargebee site from UTC to PST in January. This will ideally mean that all the transactions that had gone through in the first 7 hours of UTC time in January will now belong nowhere, leaving an unaccounted 7 hours of data in Chargebee metrics.
To handle this data gap, Chargebee will add the data in the gap to current month's data. In this case, it will be added to the data of the 1st of January.
13. What happens to MRR calculation if a subscription is deleted in Chargebee?
When a subscription is deleted, it is excluded from all metrics such as MRR, Downgrade MRR, and so on for historical and current data.
14. Are subscriptions that are activated and canceled within the same period included in New MRR calculations?
No, subscriptions that are activated and canceled within the same period are excluded from New MRR calculations. This ensures that only sustained revenue growth is accounted for in the New MRR metric.
15. Why is my one-time charge not included in MRR?
A one-time charge is not included in Monthly Recurring Revenue (MRR) if it is invoiced before the subscription’s current_term_start.
This typically occurs when:
- The subscription is future-dated, and
- The charge is configured to be billed On Subscription Creation
Even if Flexible MRR is enabled and the charge is marked Include in MRR, it will still be excluded if it is billed before the subscription term begins.
Impact:
- MRR includes only recurring charges.
- One-time charges billed upfront (such as setup fees) are excluded if invoiced before the term starts.
- This can result in MRR appearing lower than the total contract value.
16. How can I include one-time charges in MRR?
To ensure one-time charges are included in MRR (for future subscriptions):
- Bill the charge within the subscription term.
- Configure the charge to be billed On Subscription Activation instead of creation.
- Ensure the Include in MRR option is enabled.
Was this article helpful?