Home Dashboard
Chargebee has a built-in reporting system in the web interface to provide you with insight into how your business is performing. Using the 'Reports' section, you can easily view and analyze the statistics of your account and get comprehensive details about your collections, billing, and transactions.
The overall appearance of reports is colorful and easy on the eye. All reports come with markers that have tooltips when you hover over them and when you move your mouse over the graph. The tooltips along with a set of named ranges and advanced filters help you quickly find what you're looking for.
Dashboards
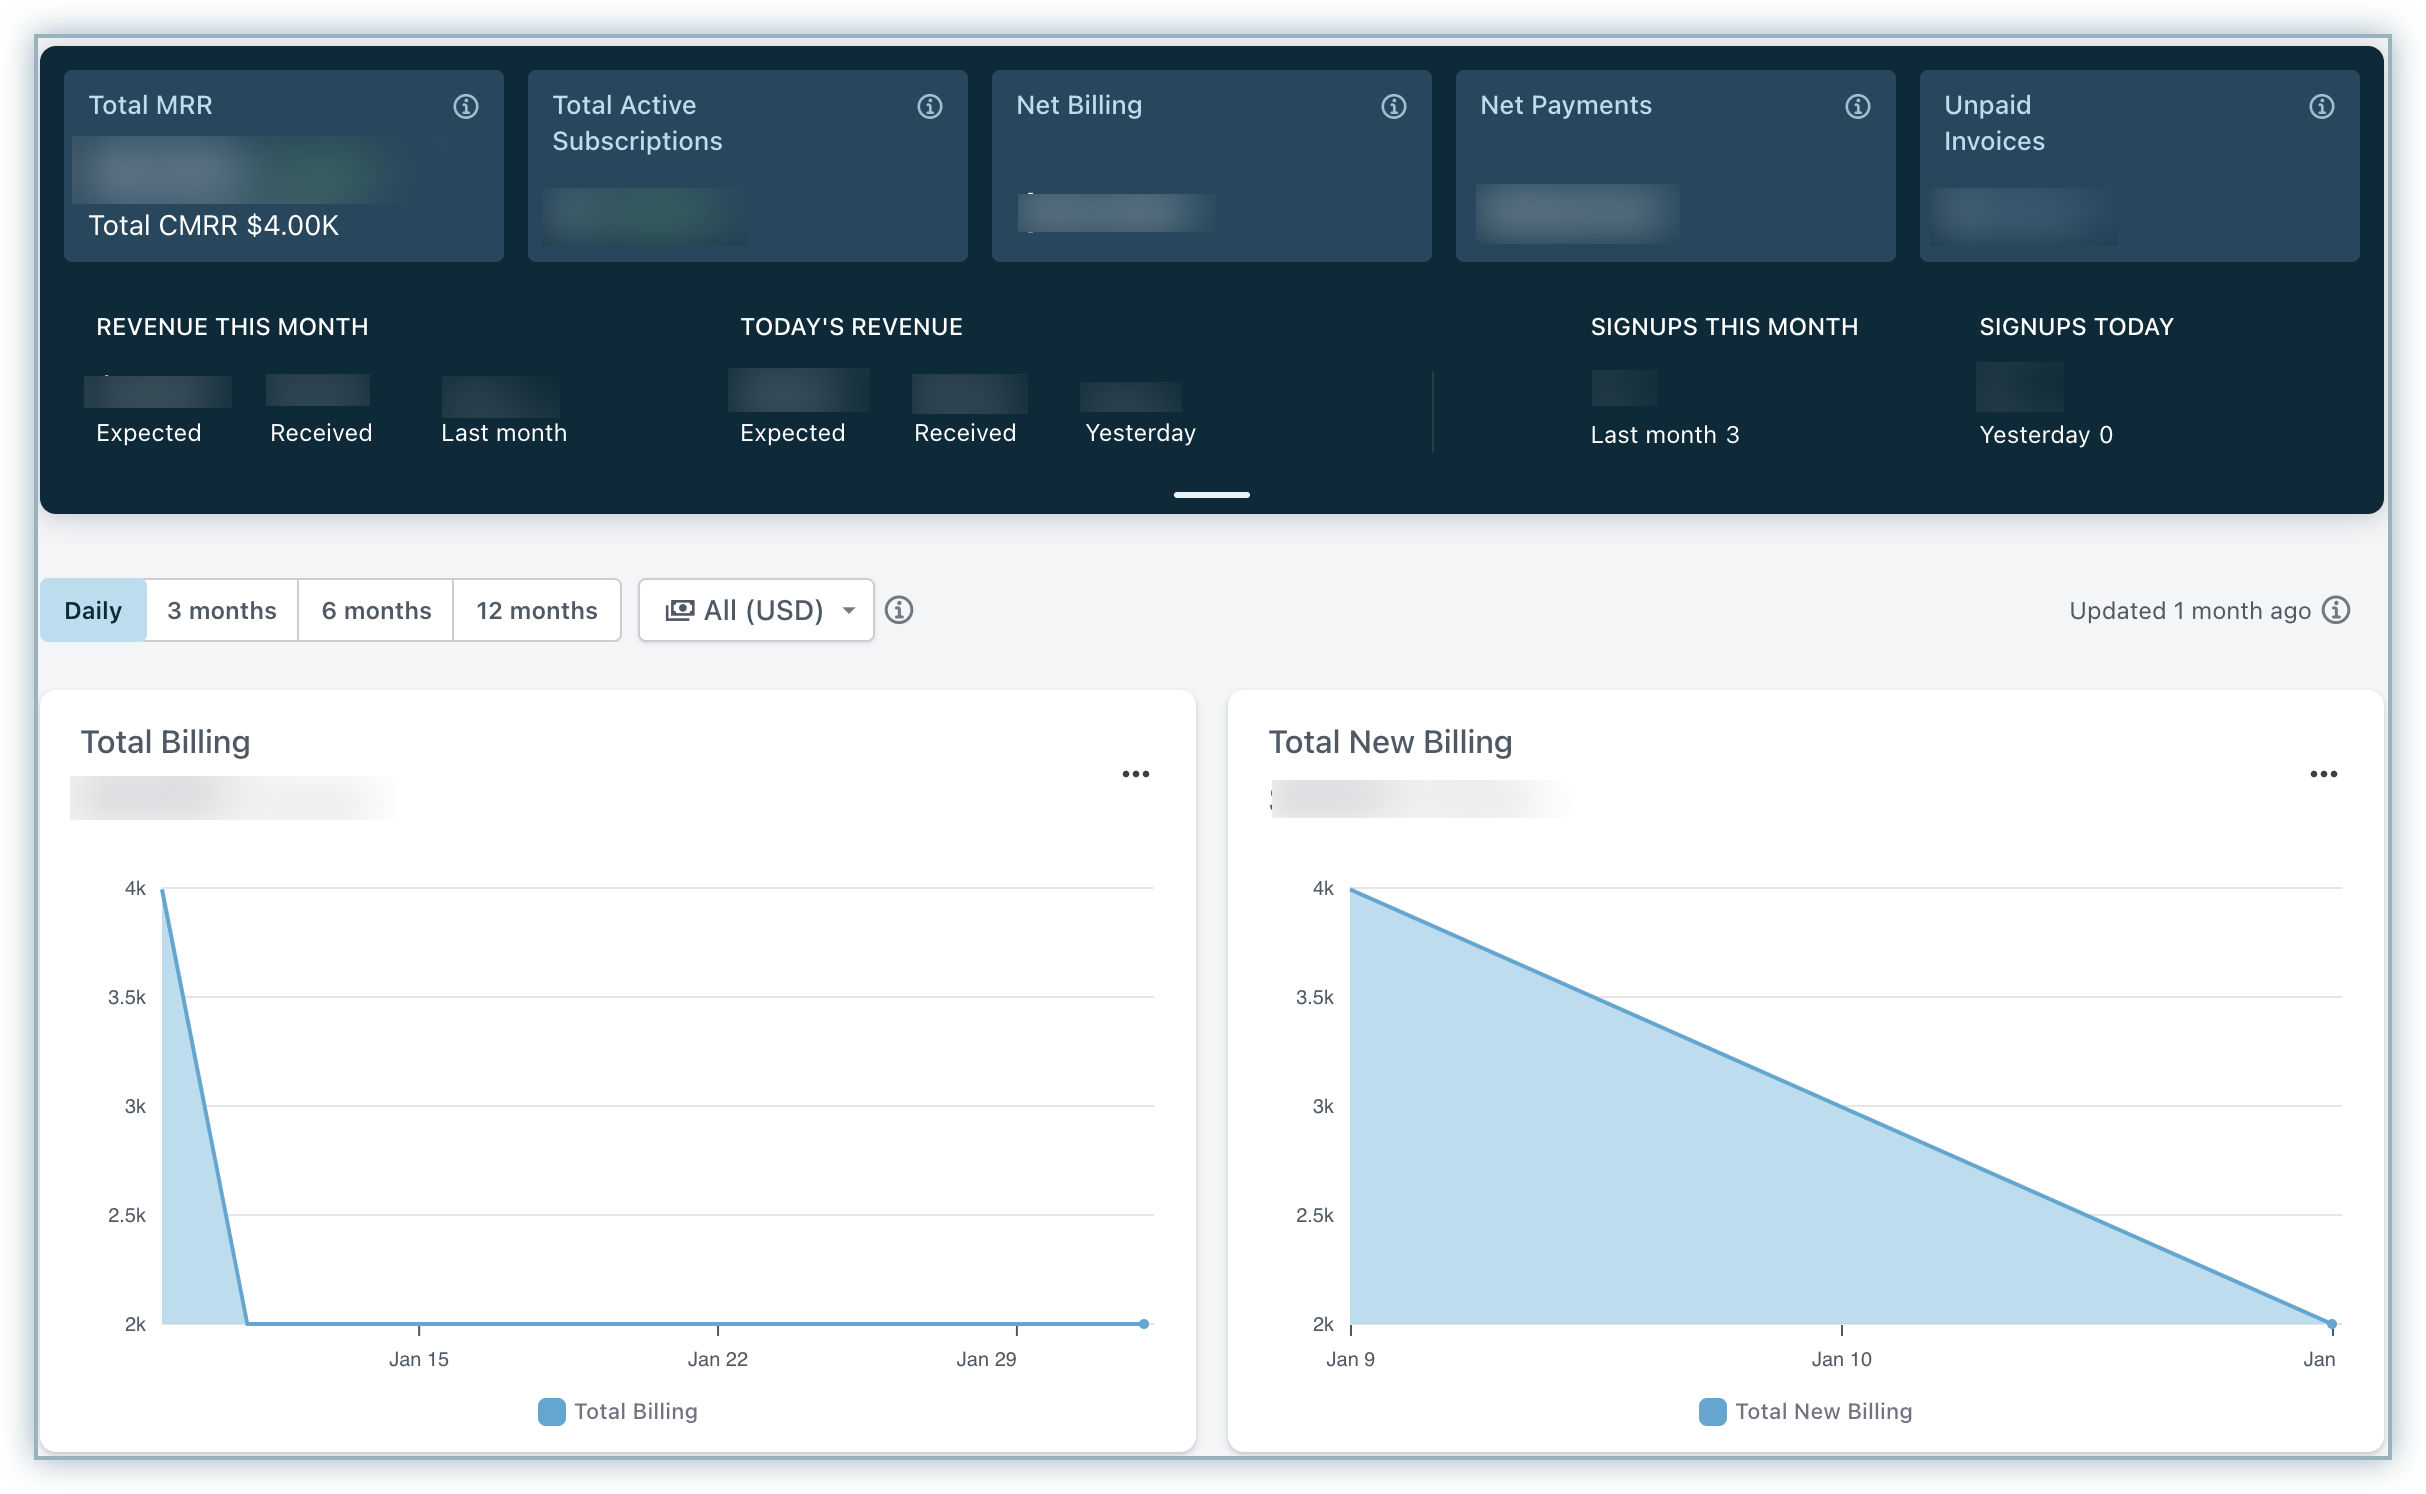
Chargebee's dashboard provides a summary of metrics to measure the health of your business.
The data displayed on the dashboard depends on the time zone set for your Chargebee site.
If you update the time zone in your Chargebee site, the current month's data displayed on the dashboard will be updated based on the new time zone.
Previous months' data will follow the previous time zone. However, if you'd like to display the previous months' data based on the new time zone, contact support.
Note
RevenueStory now powers your home dashboard. The dashboard refreshes once every 15-20 minutes based on the data volume on your site. If you have RevenueStory enabled for your site, you may see differences in numbers between your home dashboard and dashboards within RevenueStory. This does not indicate a data accuracy issue as the variance results purely from differences in the refresh rates.
Was this article helpful?