Sample Reports
RevenueStory's Report Builder enables you to create reports on your own. The information in Chargebee is remodeled as data sources (tables), thereby enabling you to visualize any data that you want as insightful reports. Using this feature, you can transform raw data into actionable insights. We have curated a few essential reports that you can create using Report Builder.
Note
To know more about the availability of this feature, visit our plans and pricing page.
MRR by Plan/Addon
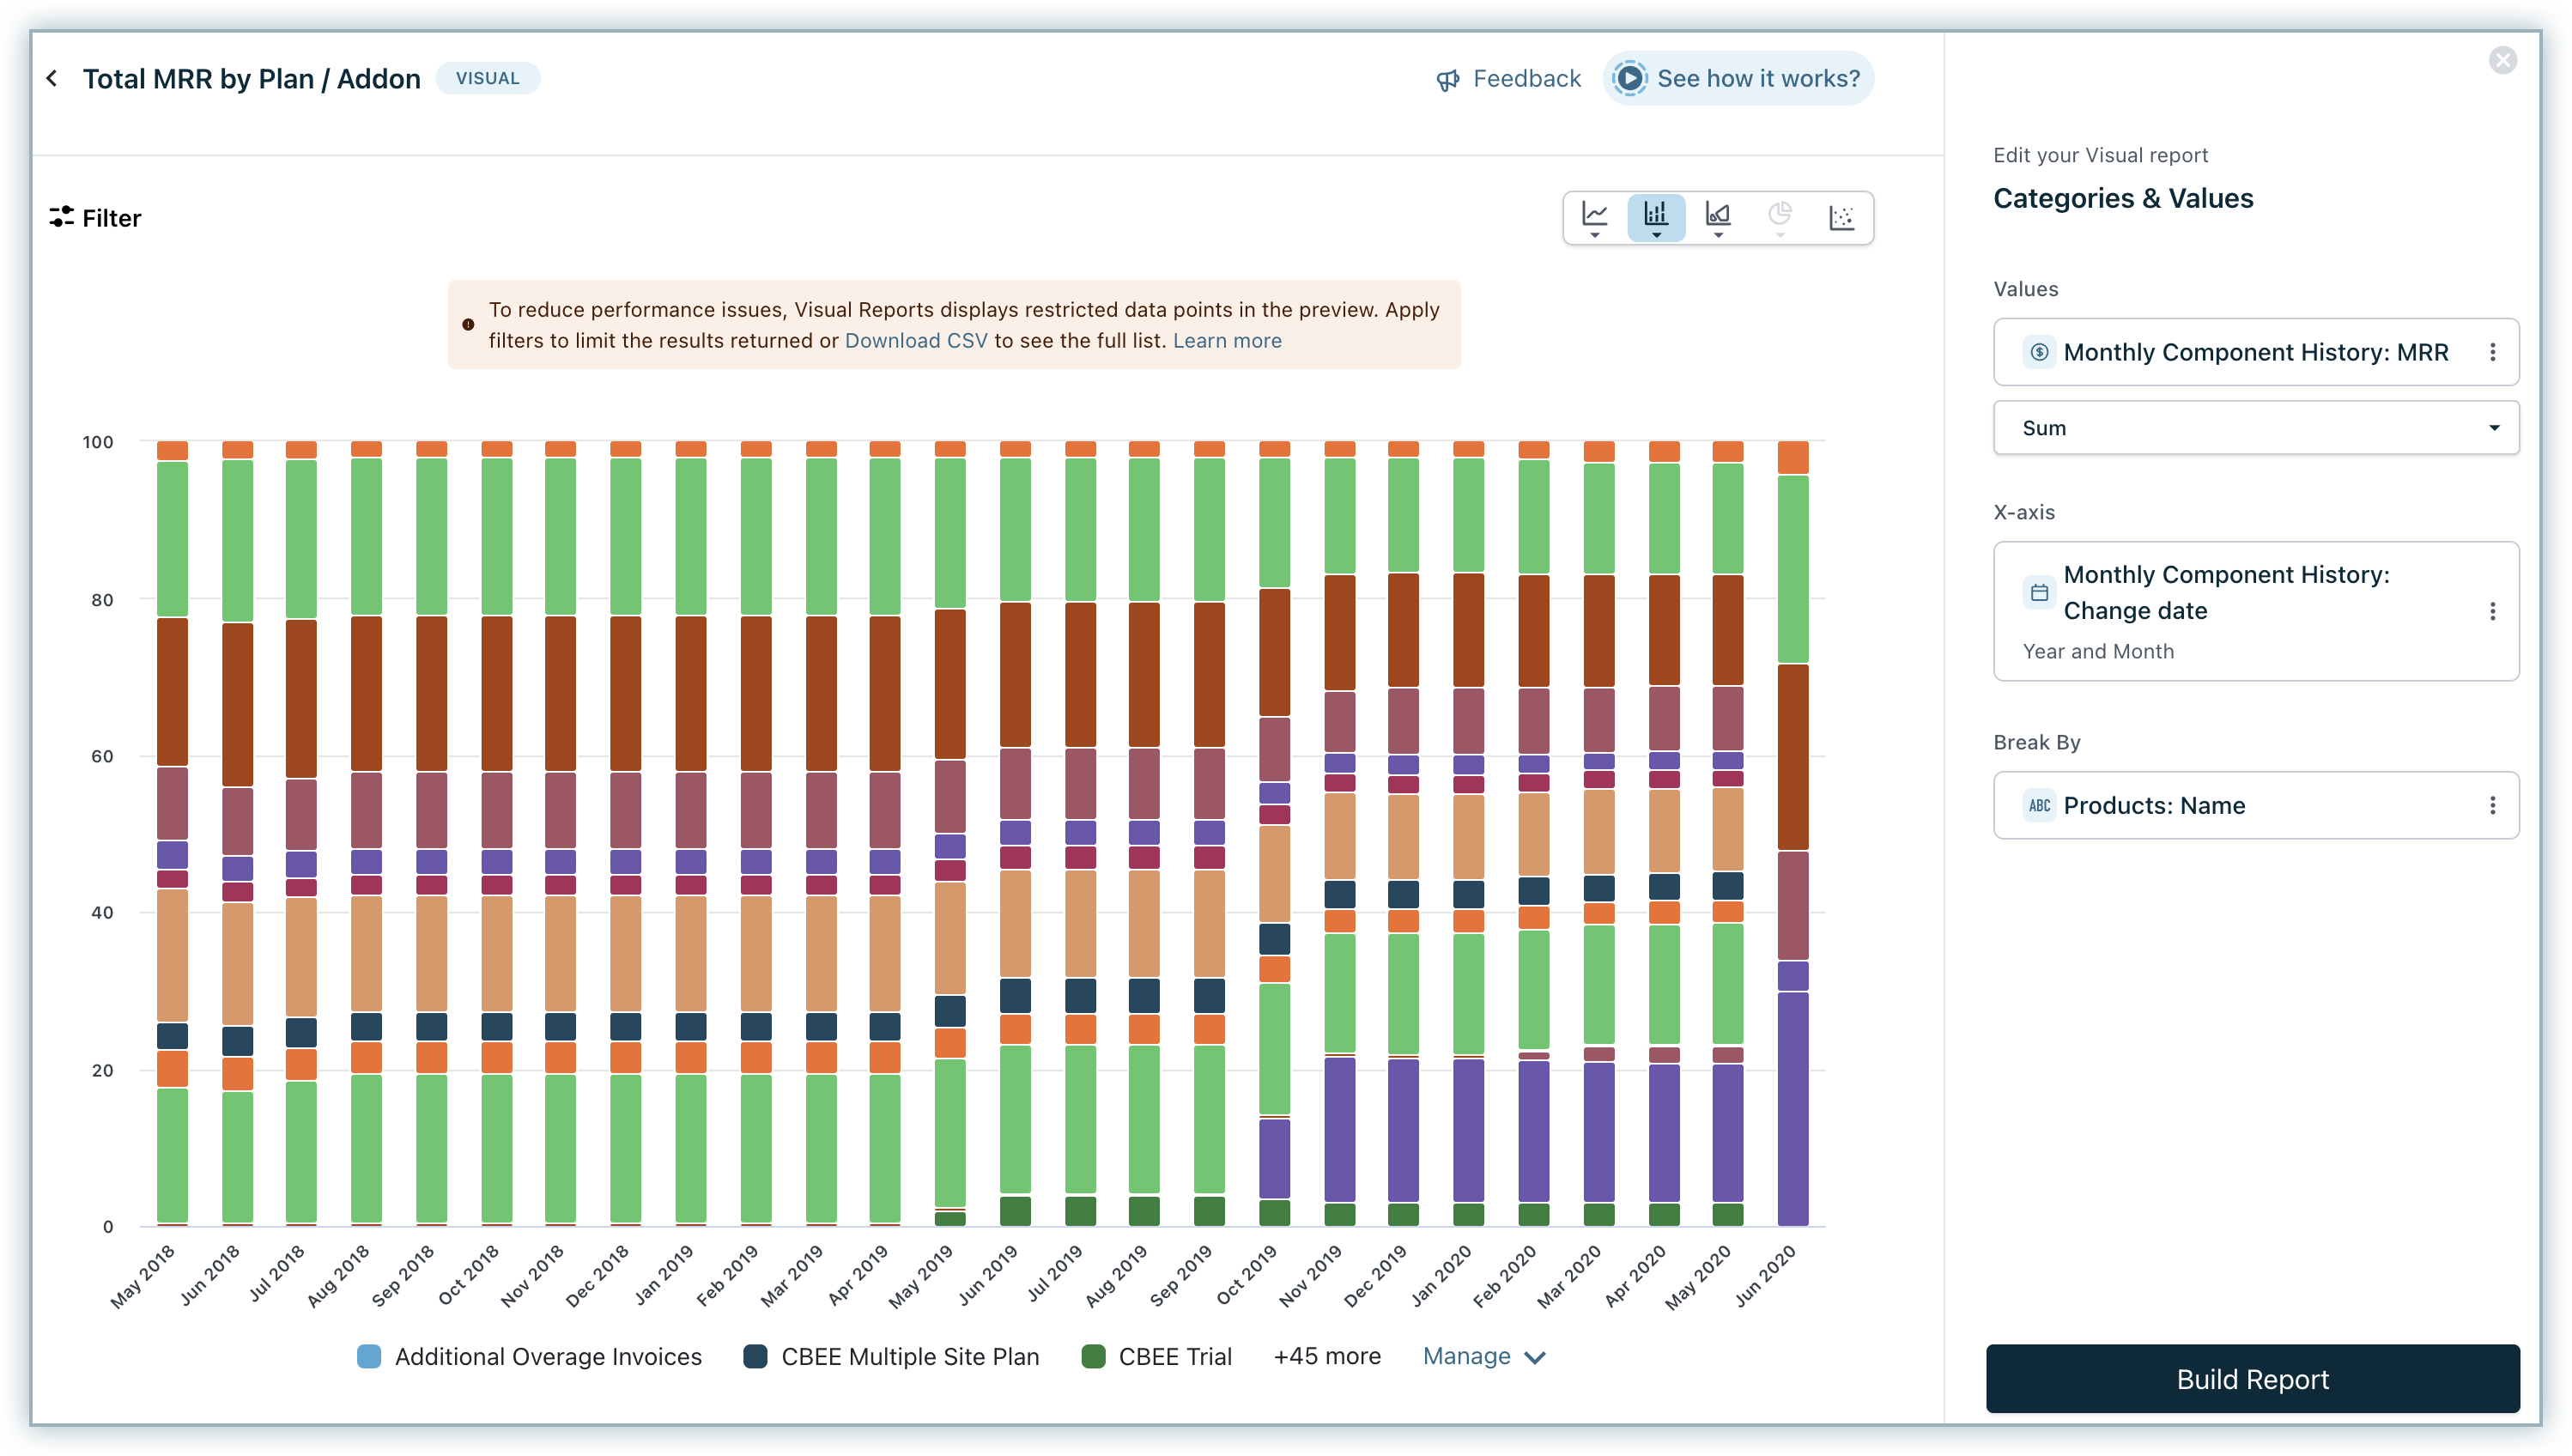
This Visual report enables users to visually interpret the Total MRR by Plan/Addon. Follow these steps to generate this visual report.
- Click RevenueStory > Report Builder.
- Click Build New Report and click Visual Report to build a new report.
- Click the +Add field under Values and select the Monthly Component History as the data source. Then, select the metric MRR from the selected data source.
- Under X-axis, select the Monthly Component History data source and field Change date.
- Under Break by, select Product, and then Product Type to break this report by Plans/Addons. The Report Builder will automatically select the best visualization type based on the fields selected, so users are aware of the changes that happen automatically. You can change the visualization type to Line (Line/Spline), Bar (Bar/Stacked Bar/Stacked Bar 100%), Area (Area/Area Spline), Pie (Pie/Donut), or Scatter chart.
- Set a Title to save the newly created visual report and click Build Report.
The following screenshot displays what the Visual report would look like.
The same report can also be generated using the Summary report.
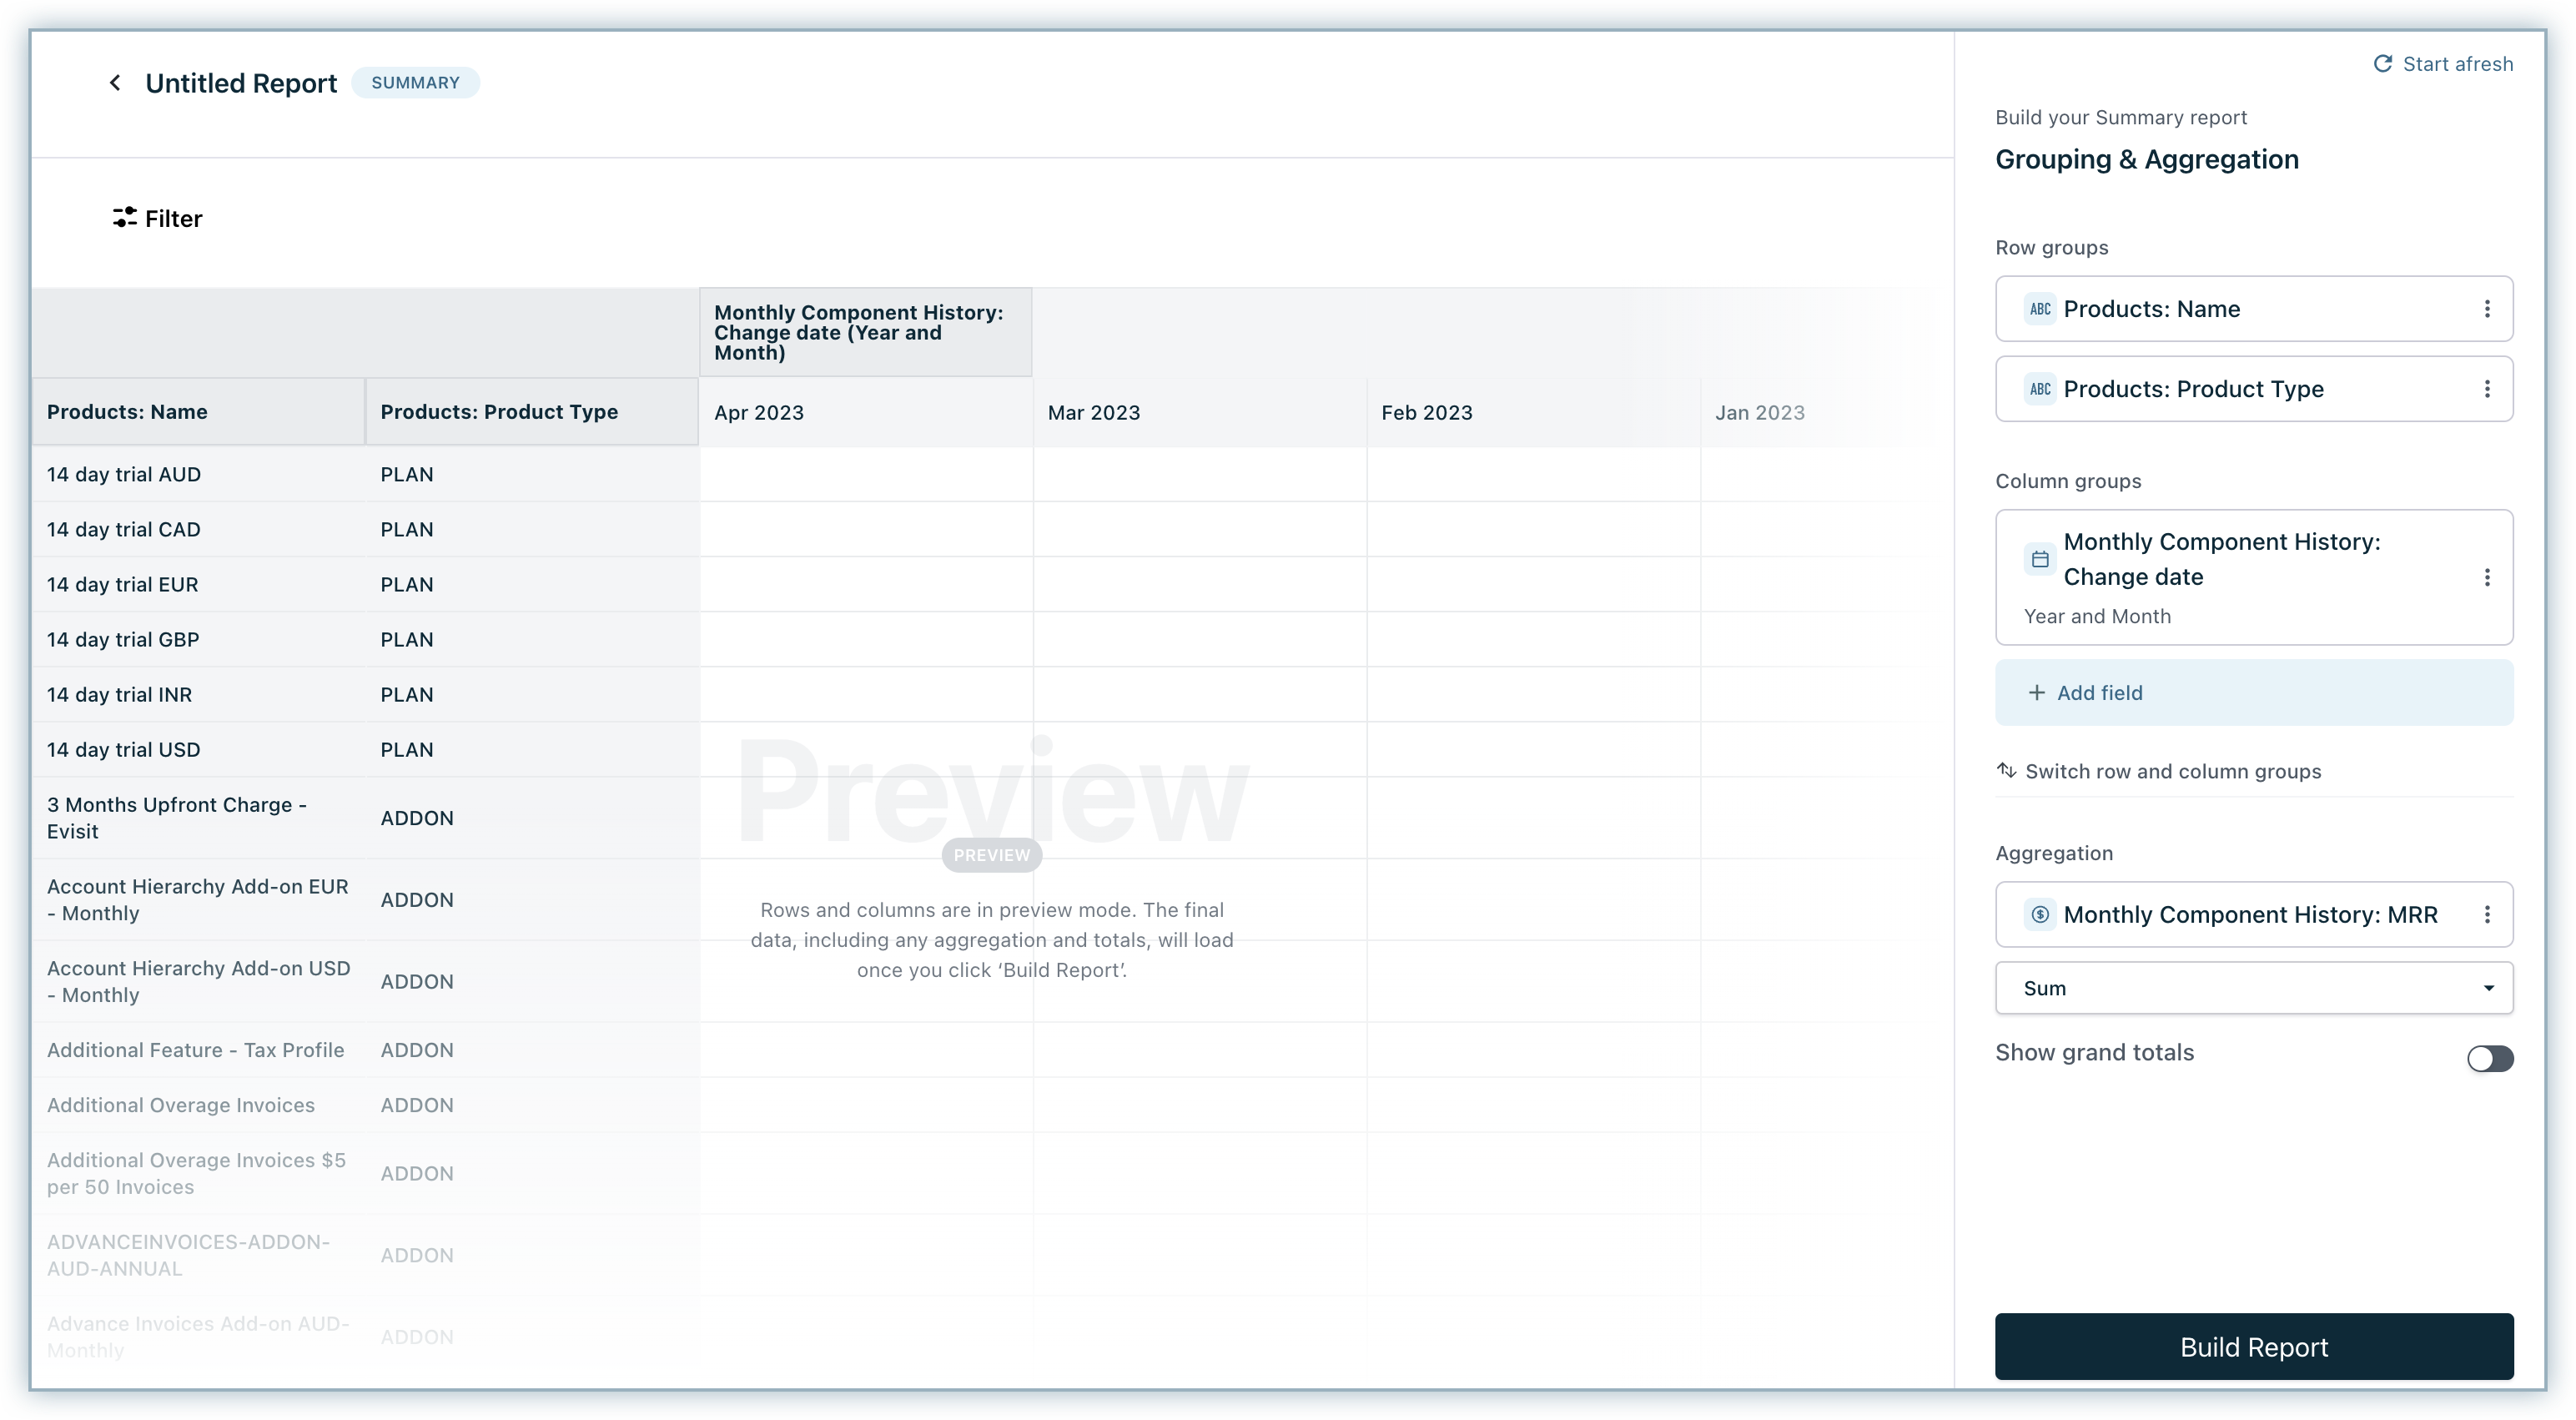
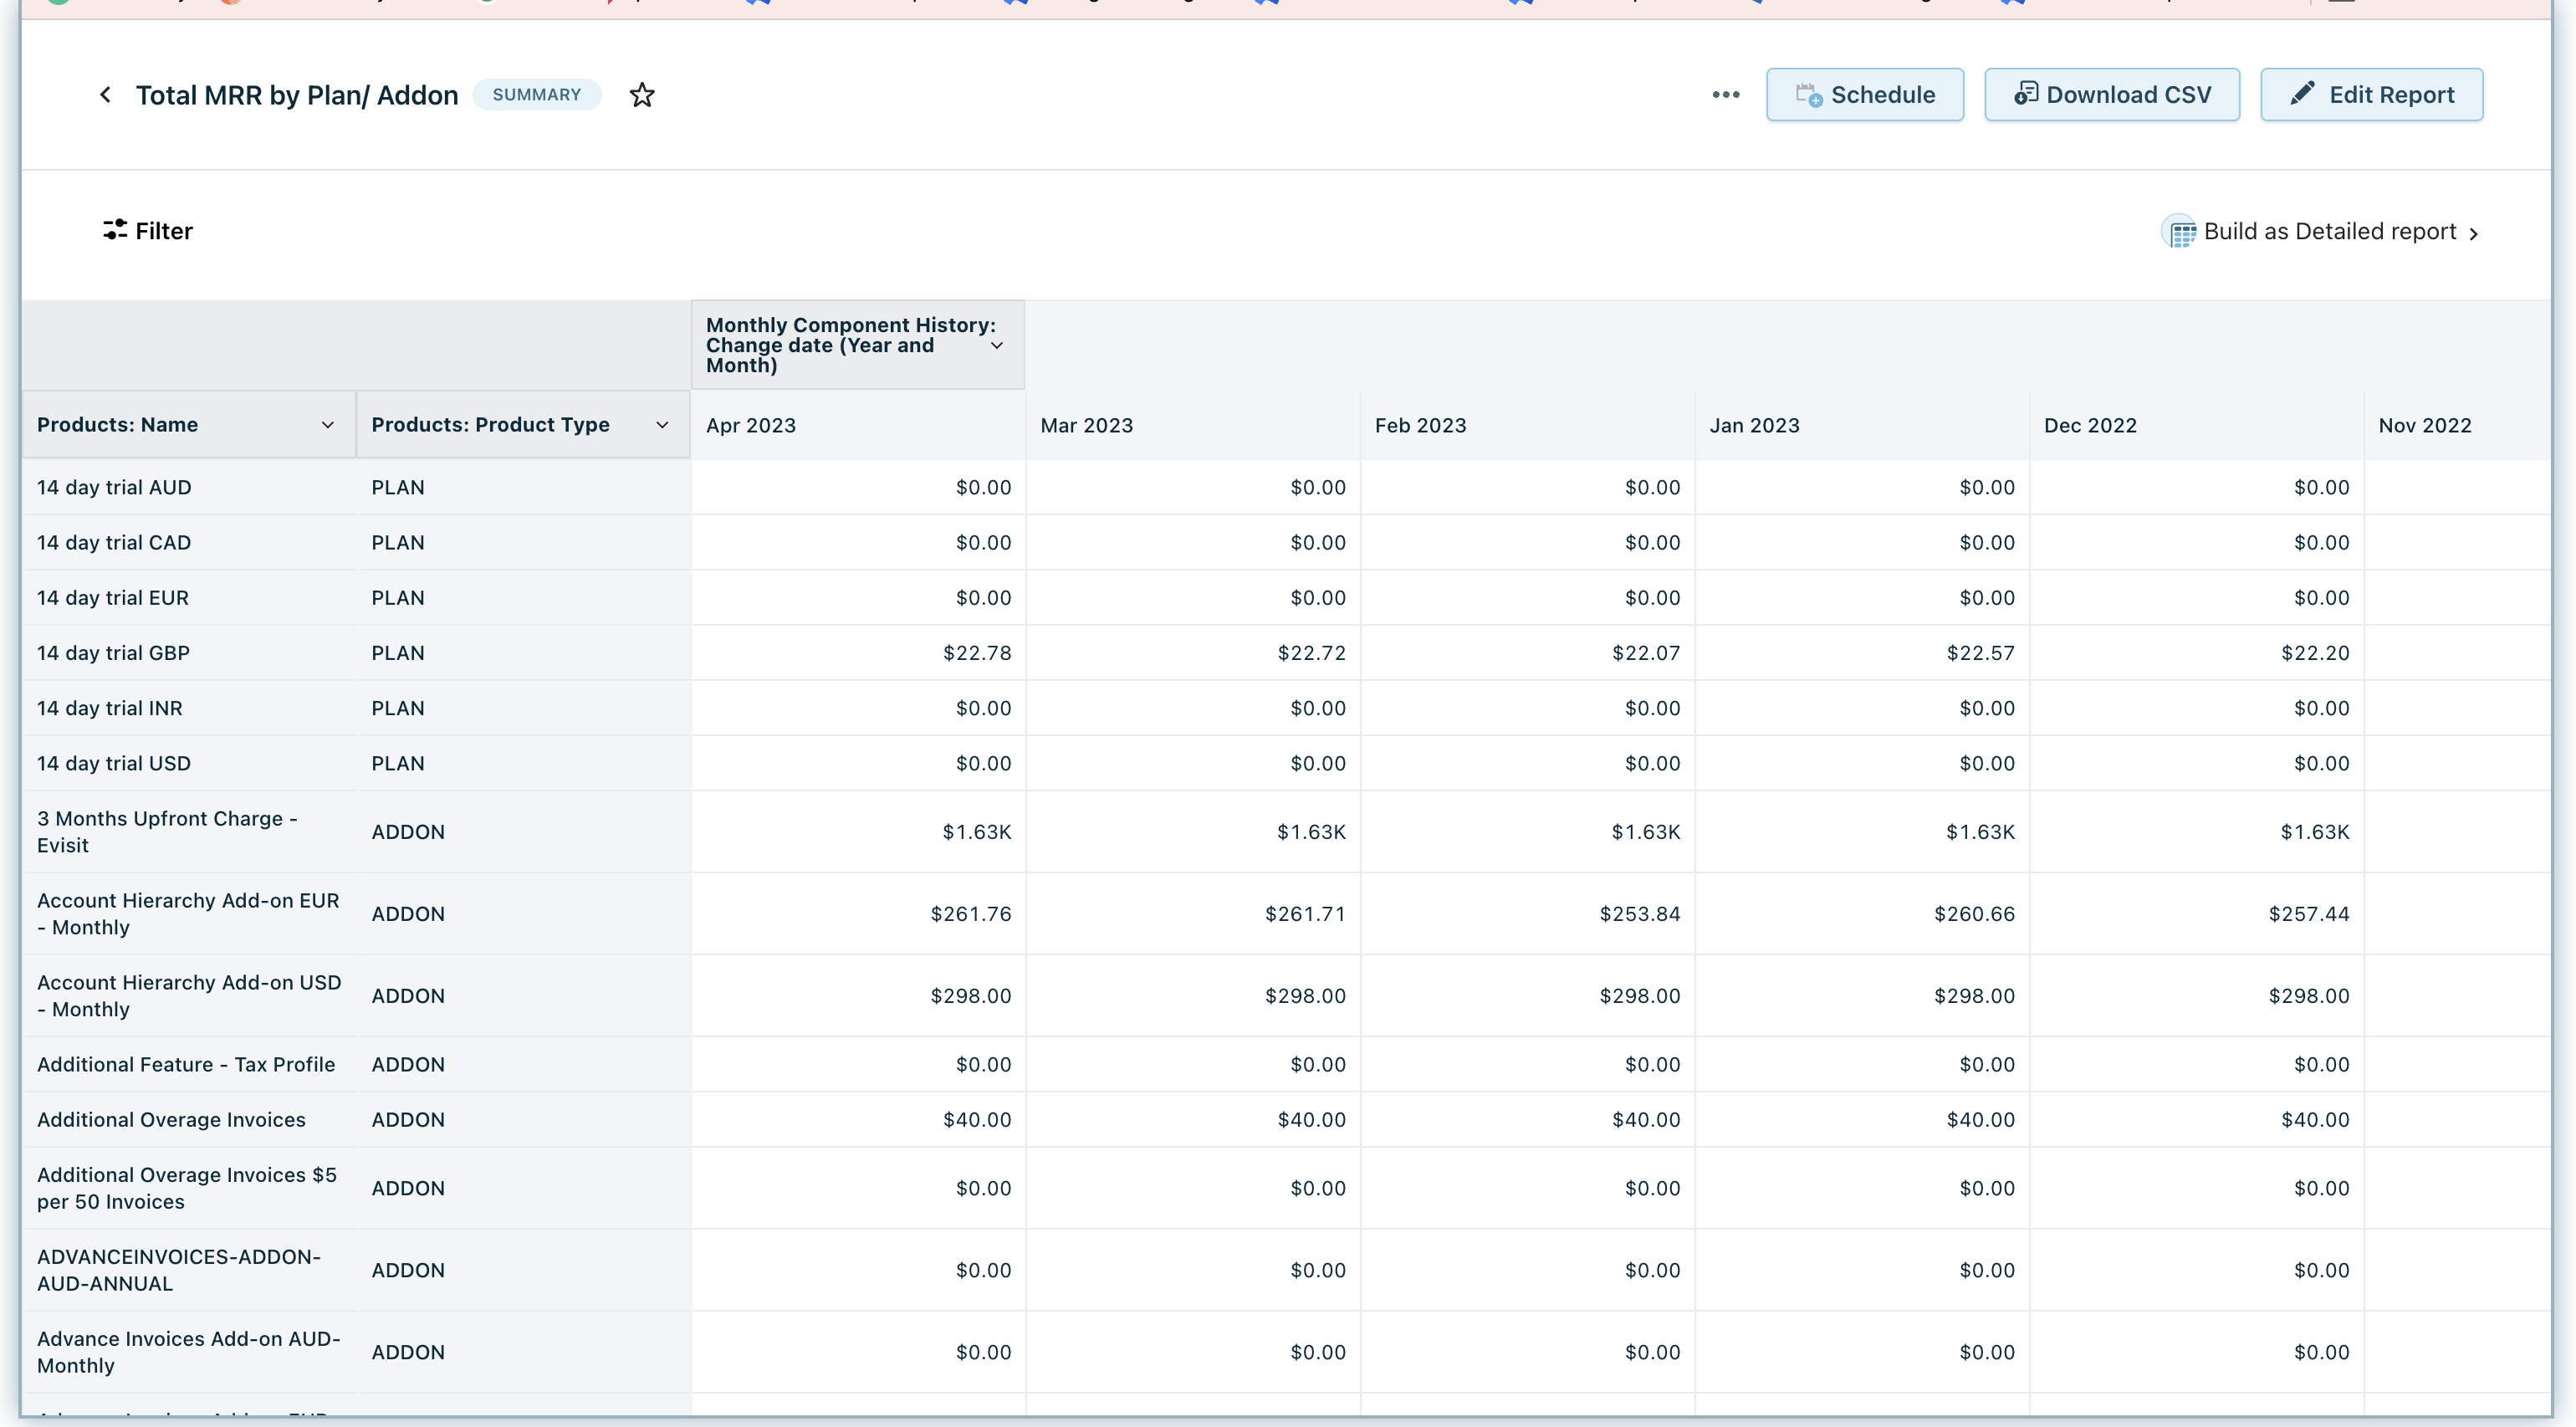
The final report built using the Summary report would be similar to the one shown below.
Total Active Subscriptions by Addon
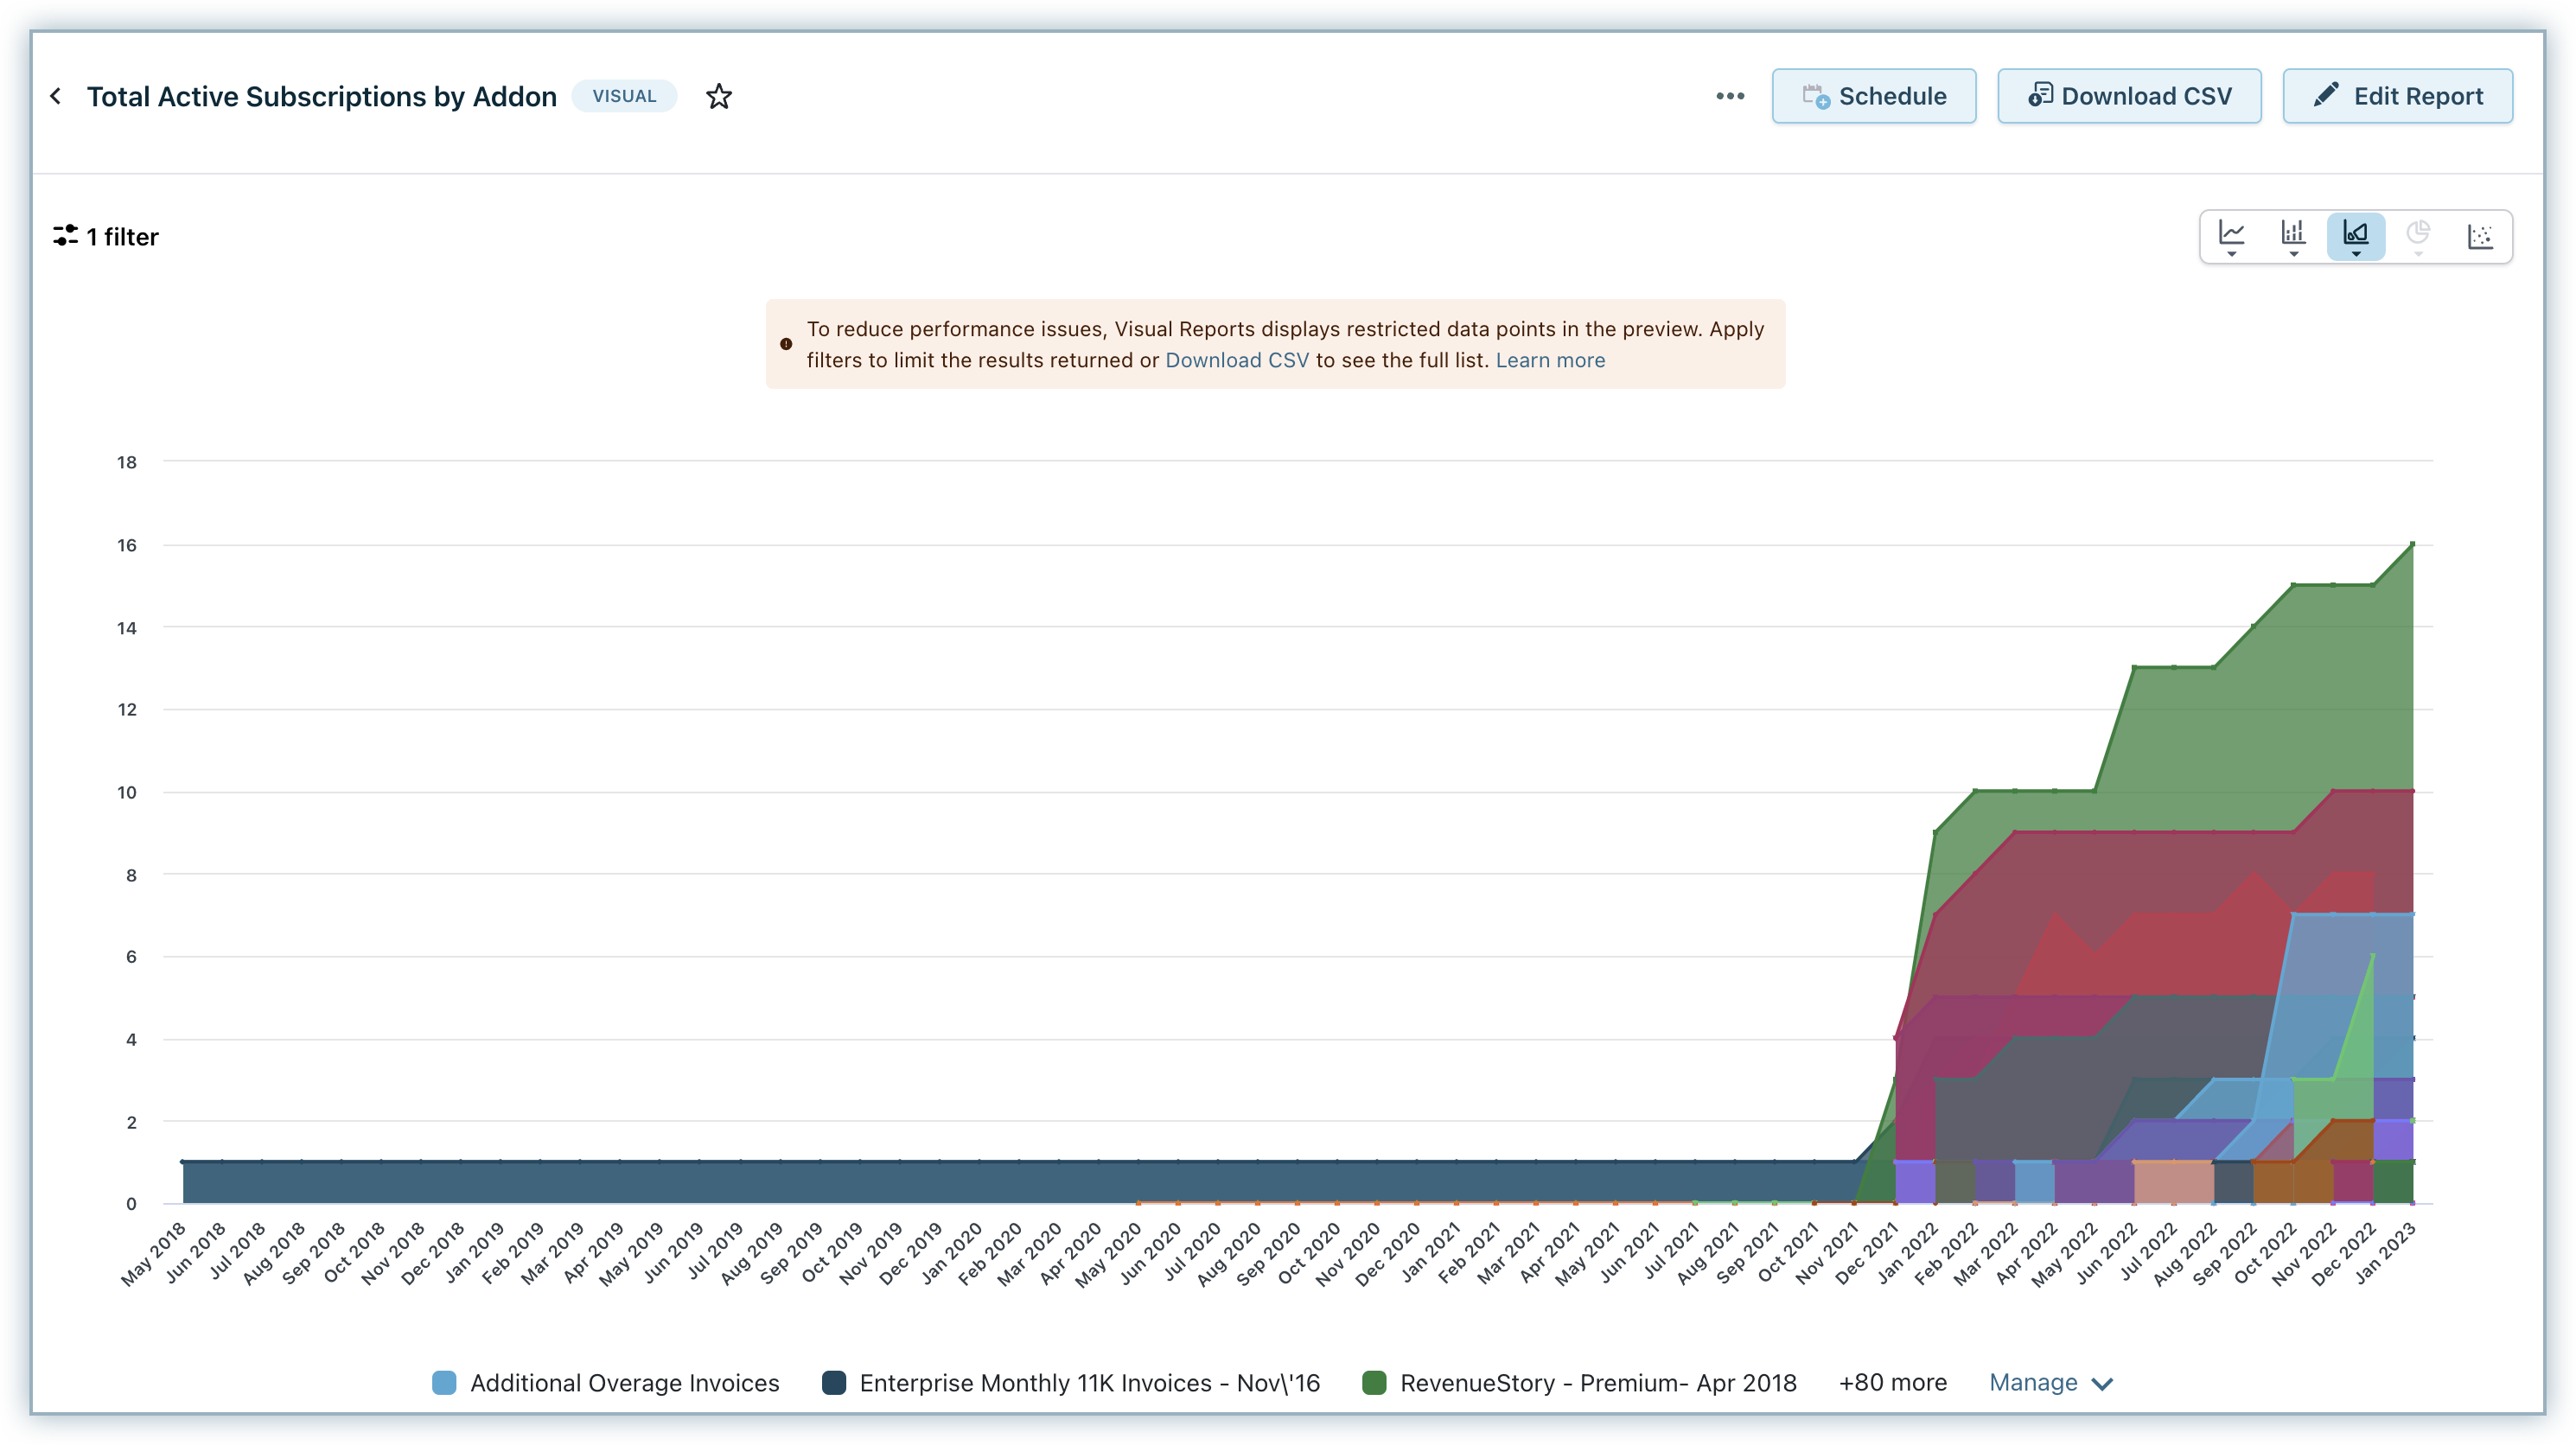
This report enables users to visually interpret the total active subscriptions by an addon. Follow these steps to generate this visual report.
- Click RevenueStory > Report Builder.
- Click Build New Report and click Visual Report to build a new report.
- Click the +Add field under Values and select the Monthly Component History as the data source. Then, select the metric Active Subscriptions from the selected data source.
- Under X-axis, select the Monthly Component History data source and field Change date.
- Under Break by, select Product, and then Product Type to break this report by Plans or Addons. The Report Builder will automatically select the best visualization type based on the fields selected, so users are aware of the changes that happen automatically. You can change the visualization type to Line (Line/Spline), Bar (Bar/Stacked Bar/Stacked Bar 100%), Area (Area/Area Spline), Pie (Pie/Donut), or Scatter chart.
- Click Filter > Add Filter to filter the report by product type and select Addon.
- Set a Title to save the newly created visual report and click Build Report.
The following screenshot displays what the report would look like.
Sales by Country
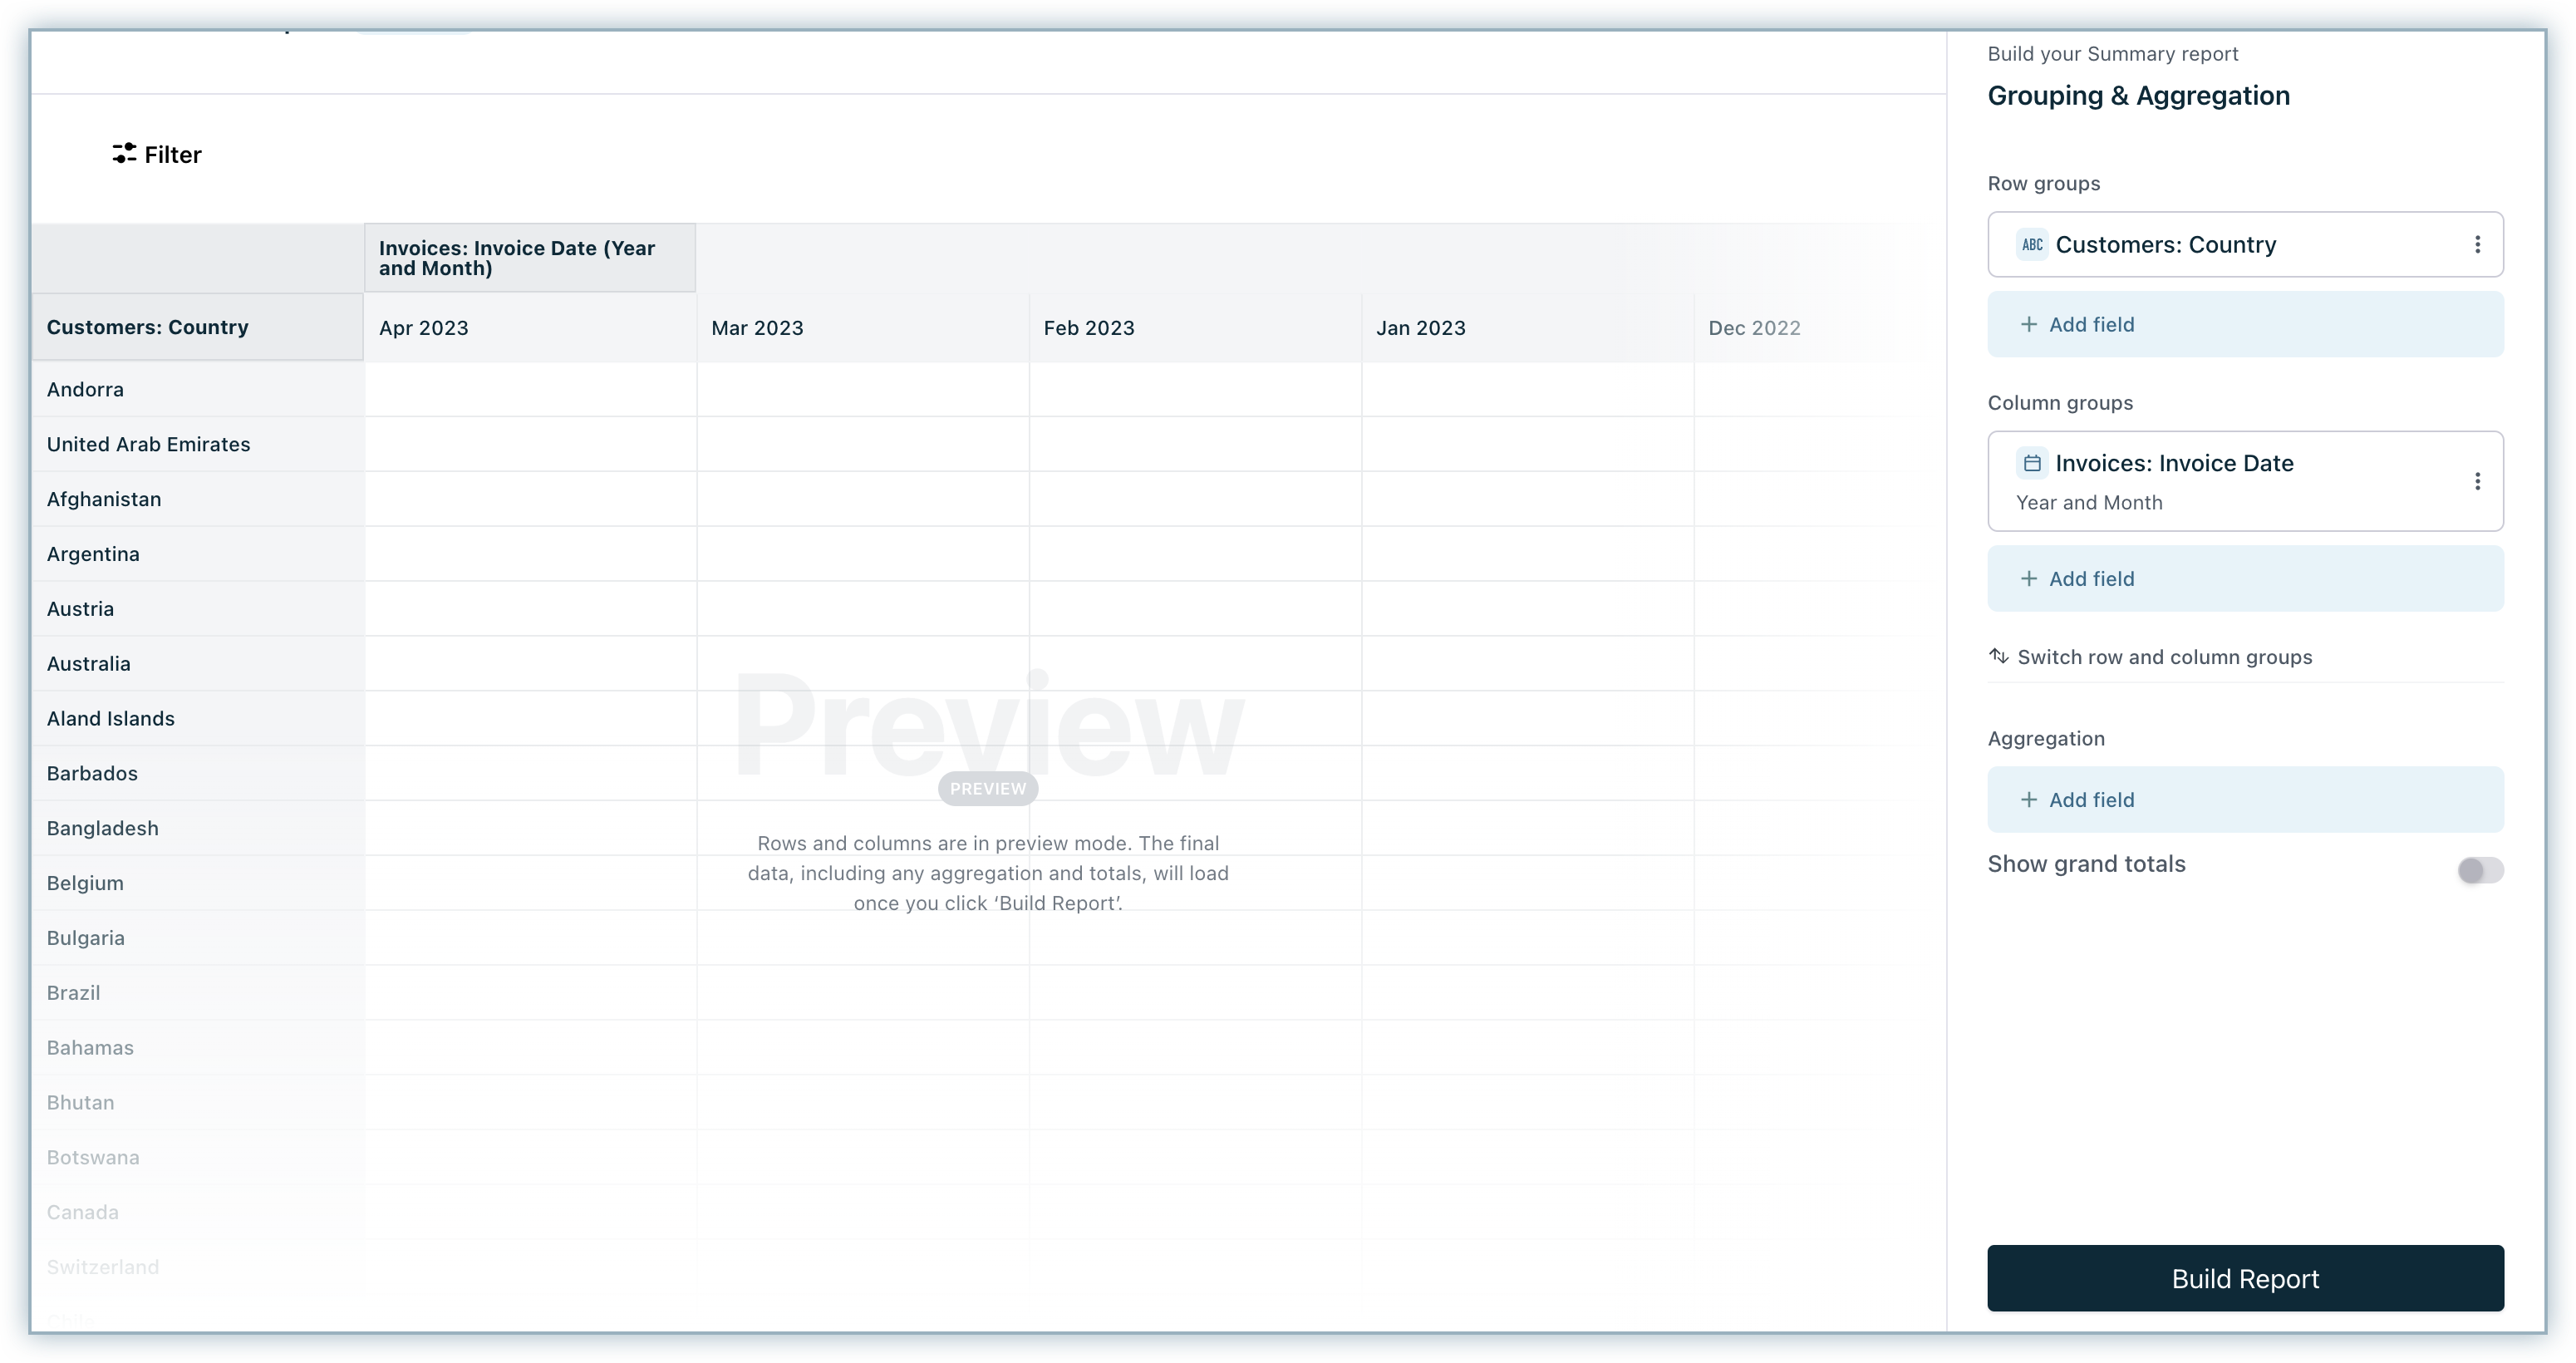
This Summary report displays the total revenue earned each month across different countries.
We are now going to follow these steps to build this report:
-
Click RevenueStory > Report Builder.
-
Select Summary Report.

-
Choose the data source as Invoices.
-
Select the Invoice date field (group them by Year and Month) from Invoices under Column grouping and Country from the Customers data source under Row grouping.
-
Select the Total field from Invoices to aggregate the report and apply the Sum function on it.
-
By default, Show grand totals will be disabled in the Summary report. However, you may choose to enable it to display summary values for row and column groupings in your report.
Note
Grand totals are not available in the downloaded/scheduled report.
-
Click Build Report.
-
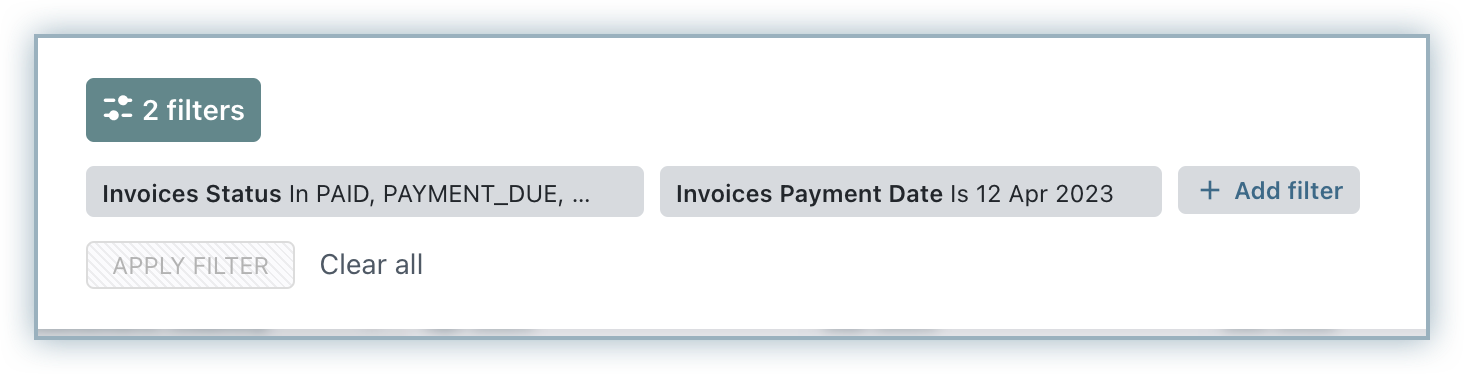
Next, let us add the Invoice Status (In Paid, Payment Due, Not Paid, or Posted Status) and Invoice Payment Date in the filter.
-
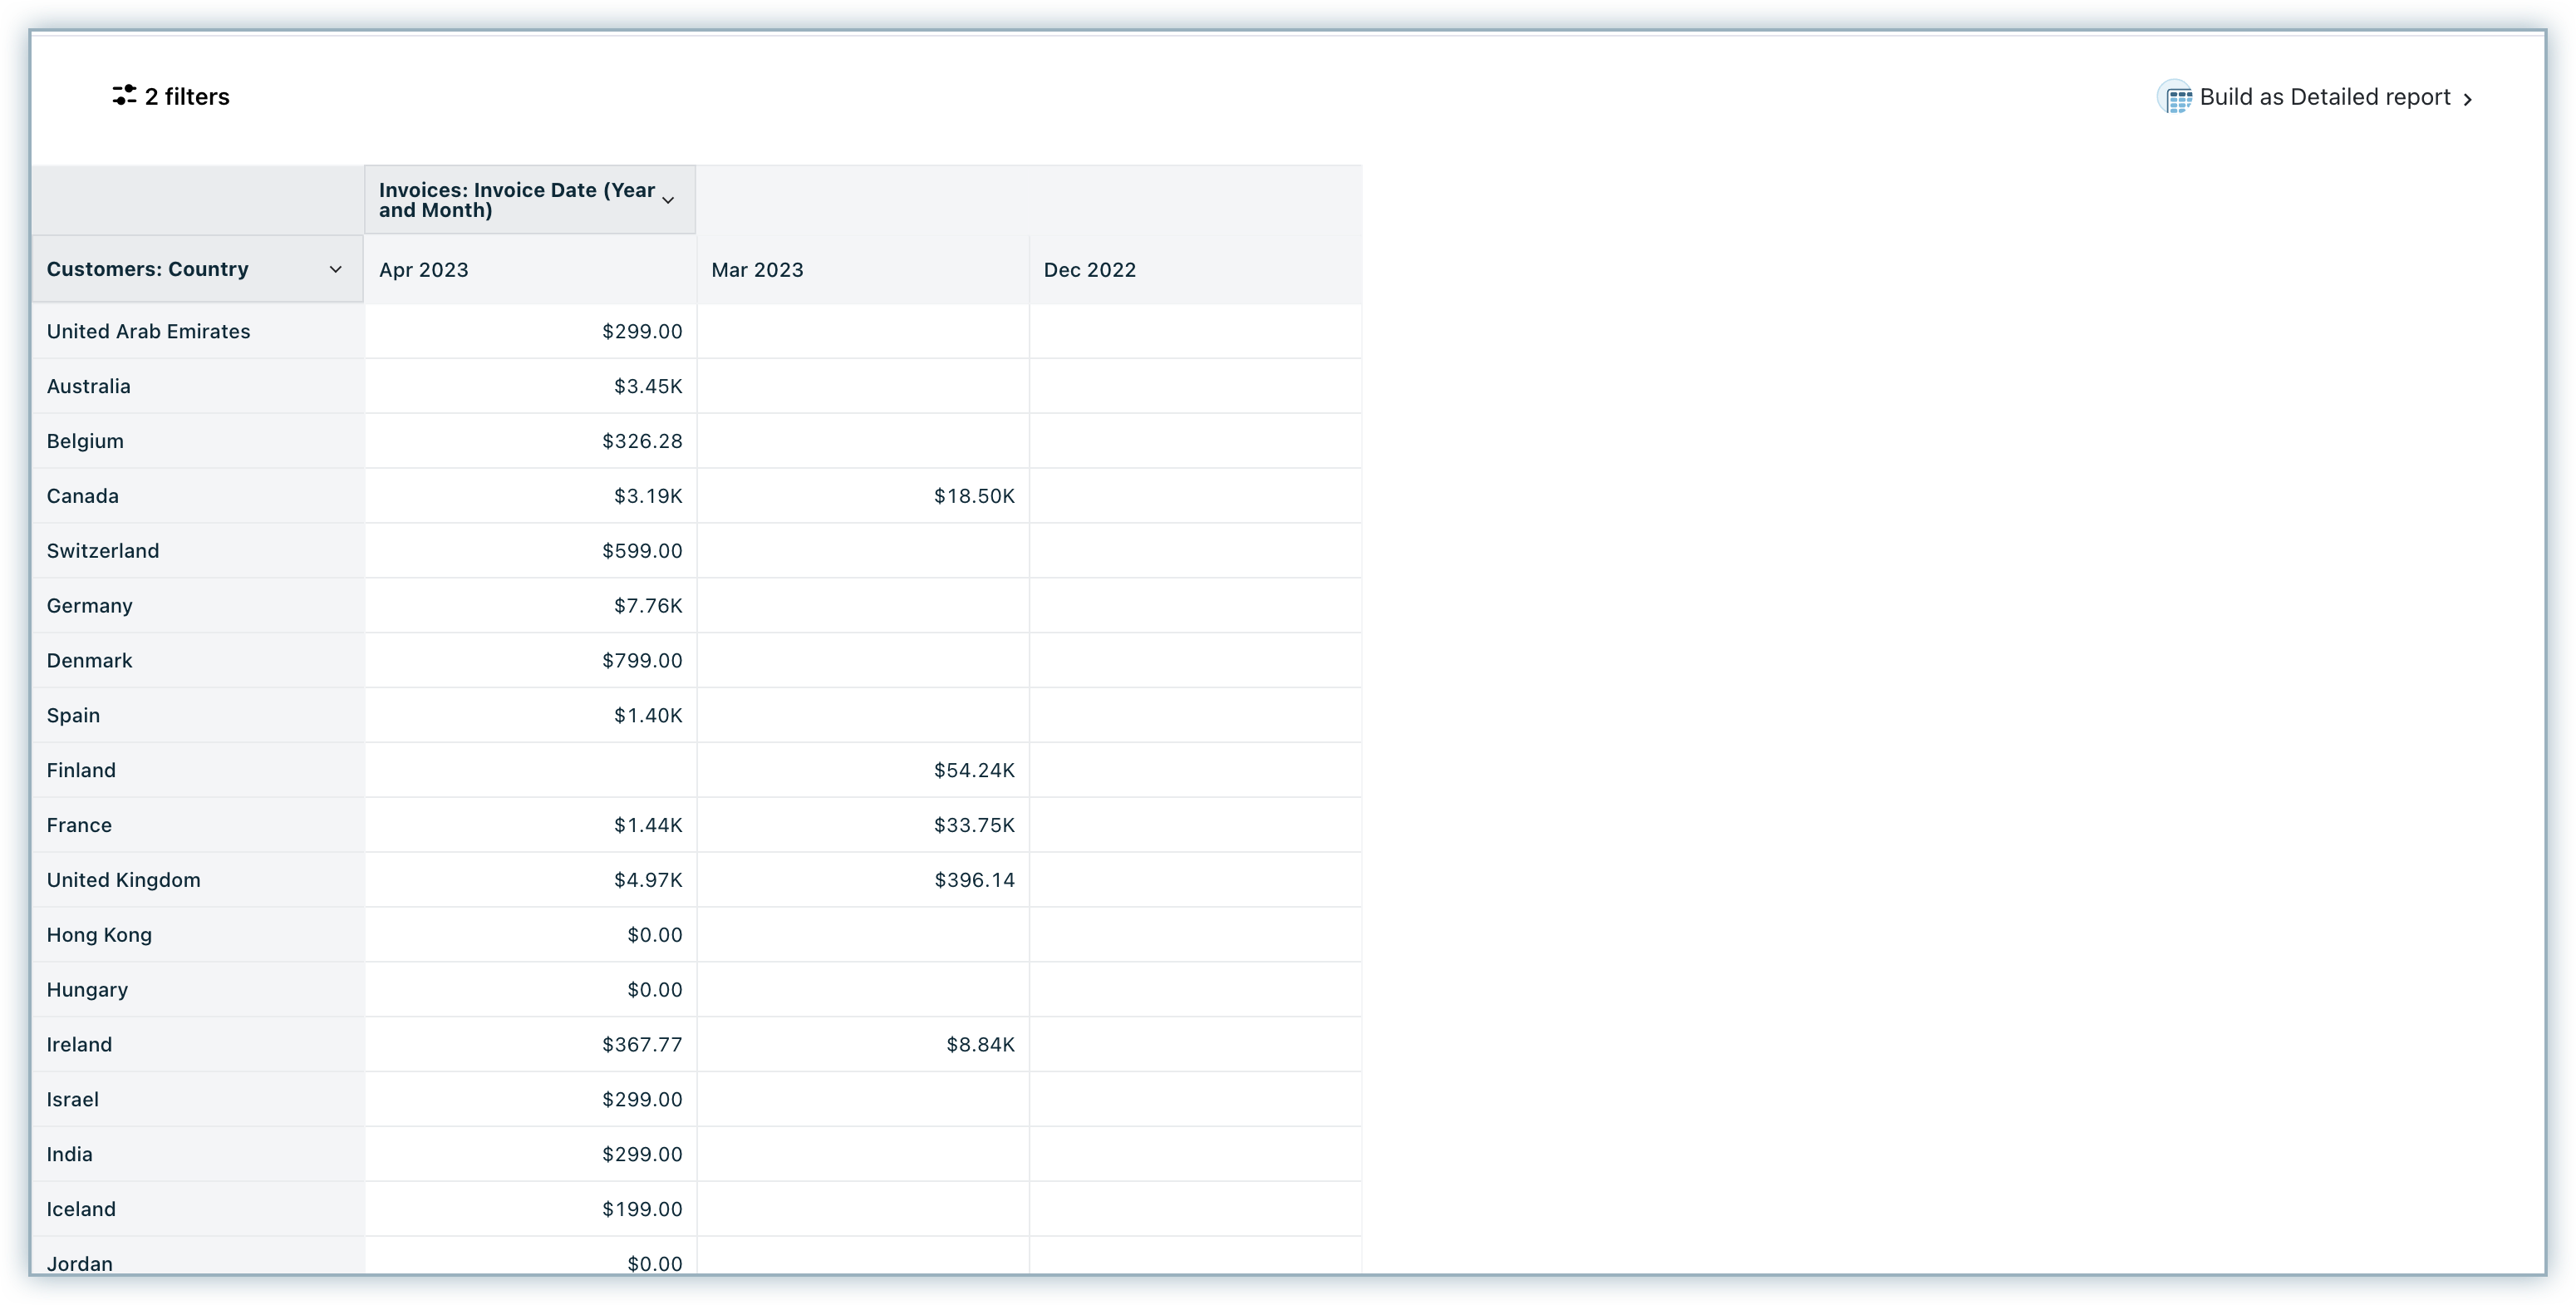
This is how the report will look.
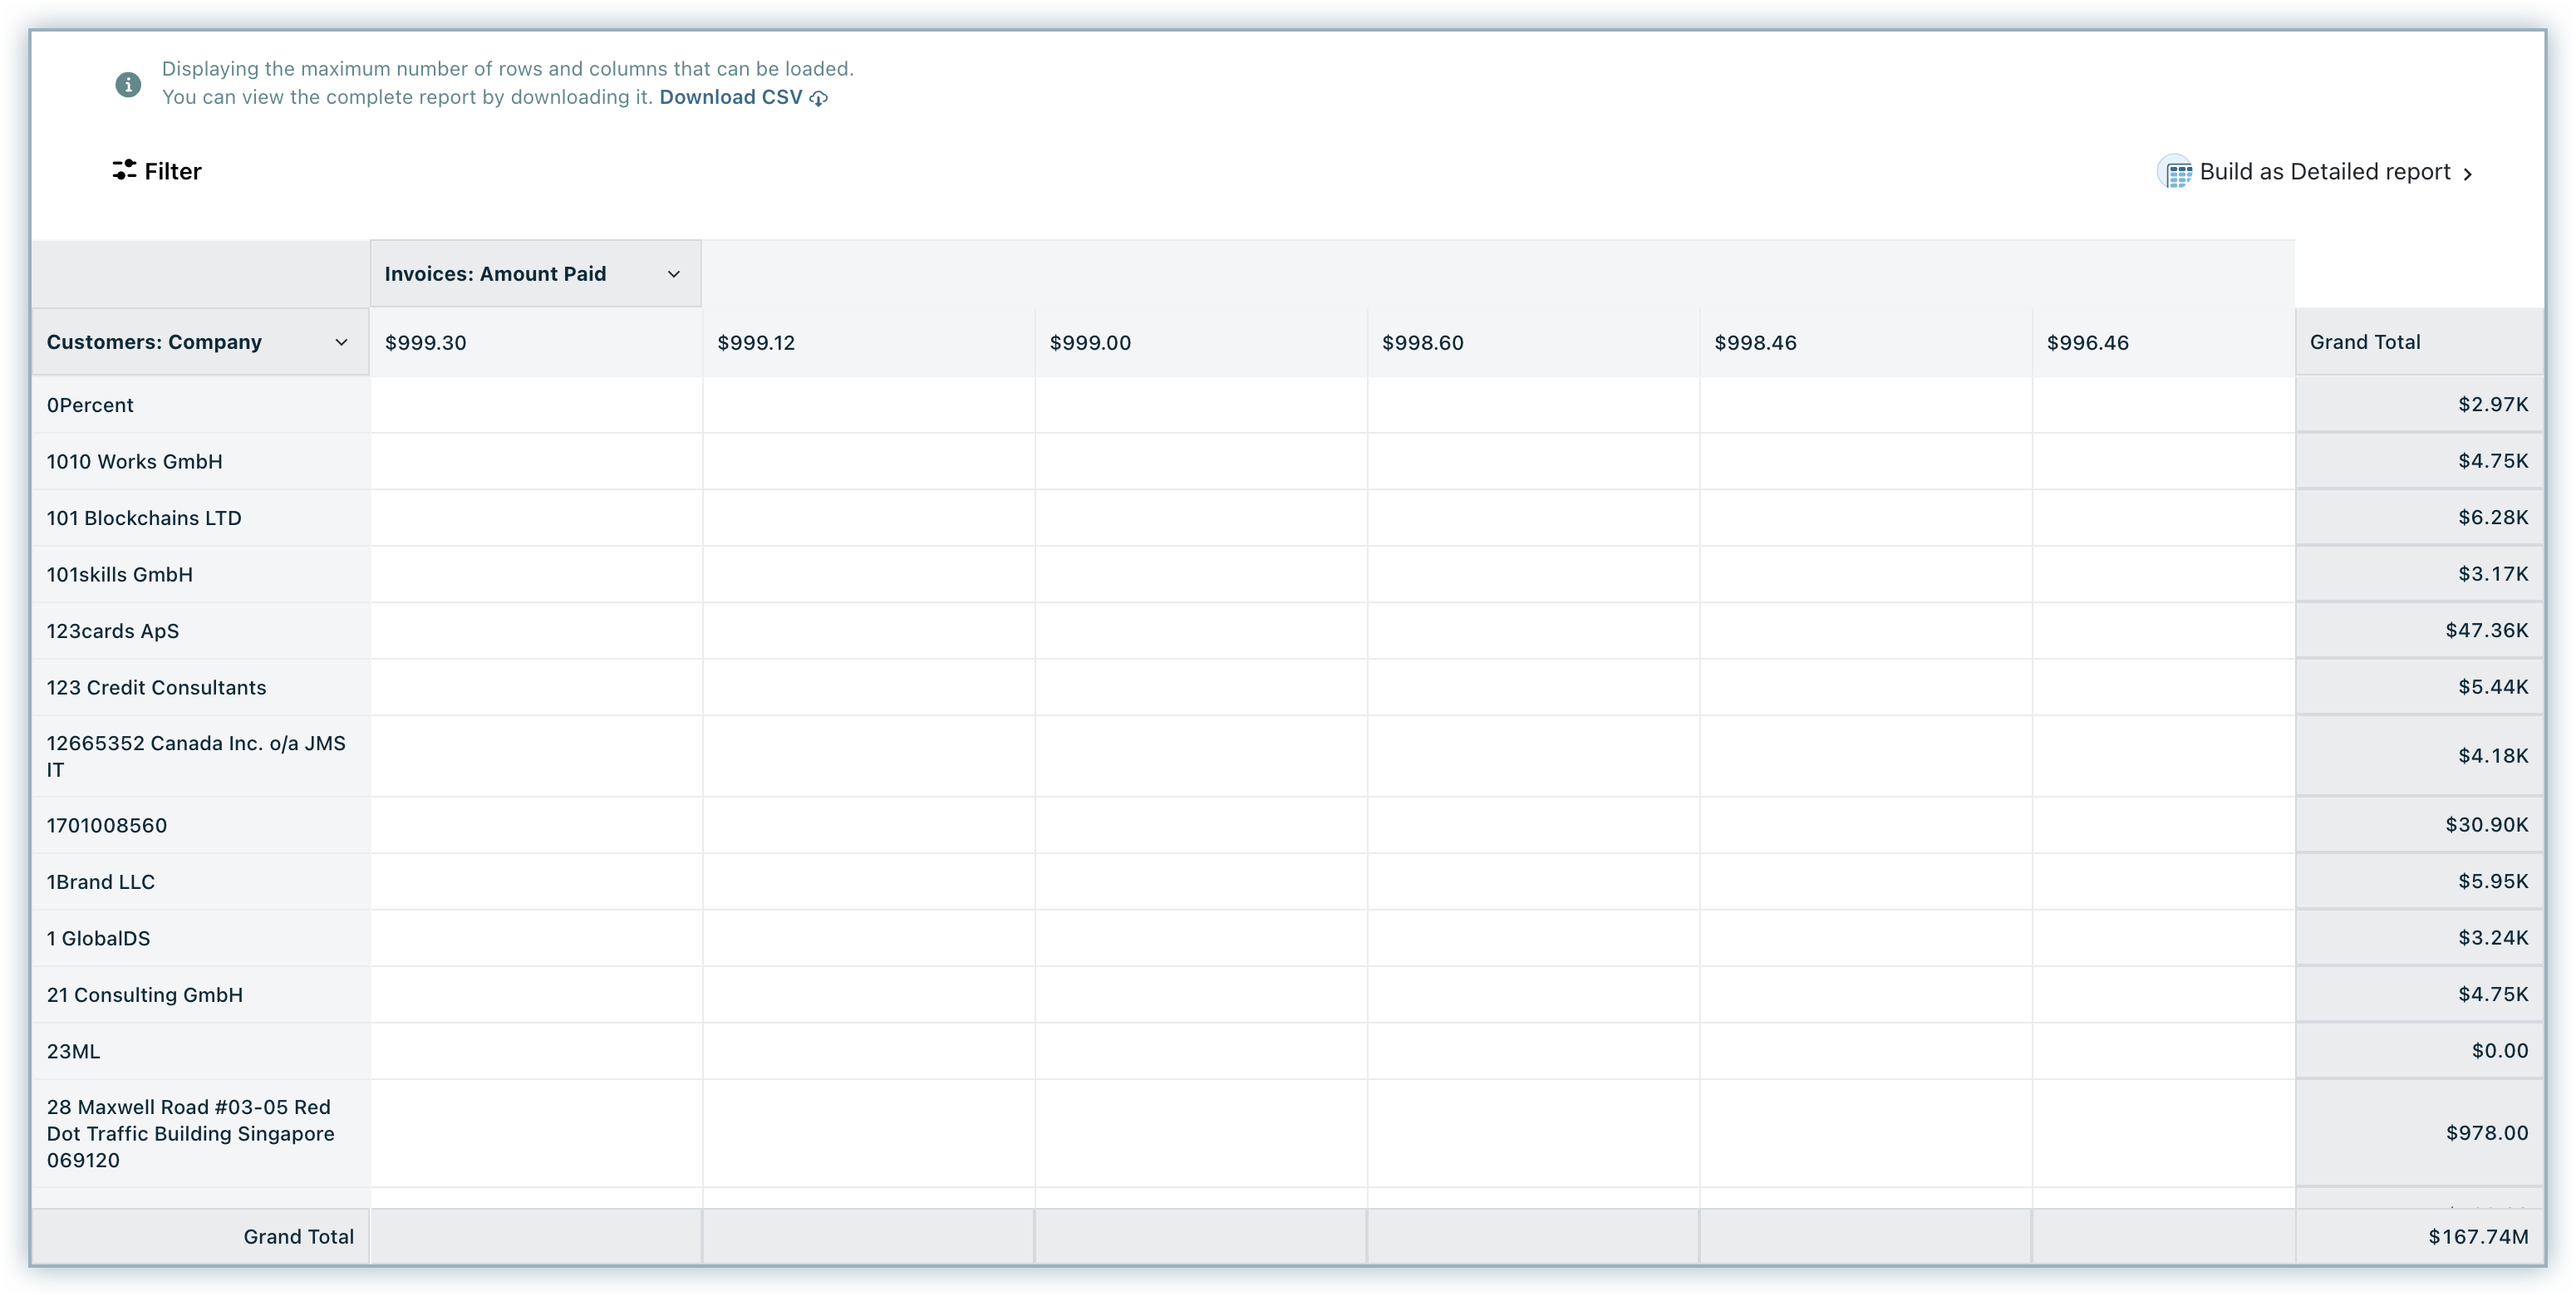
Invoice amount paid by Customer
As a business owner, you can view the invoice amount paid by each customer. Follow these steps to see how to build this report.
-
Click RevenueStory > Report Builder.
-
Select Create a Summary Report.
-
Select the data source as Invoices.
-
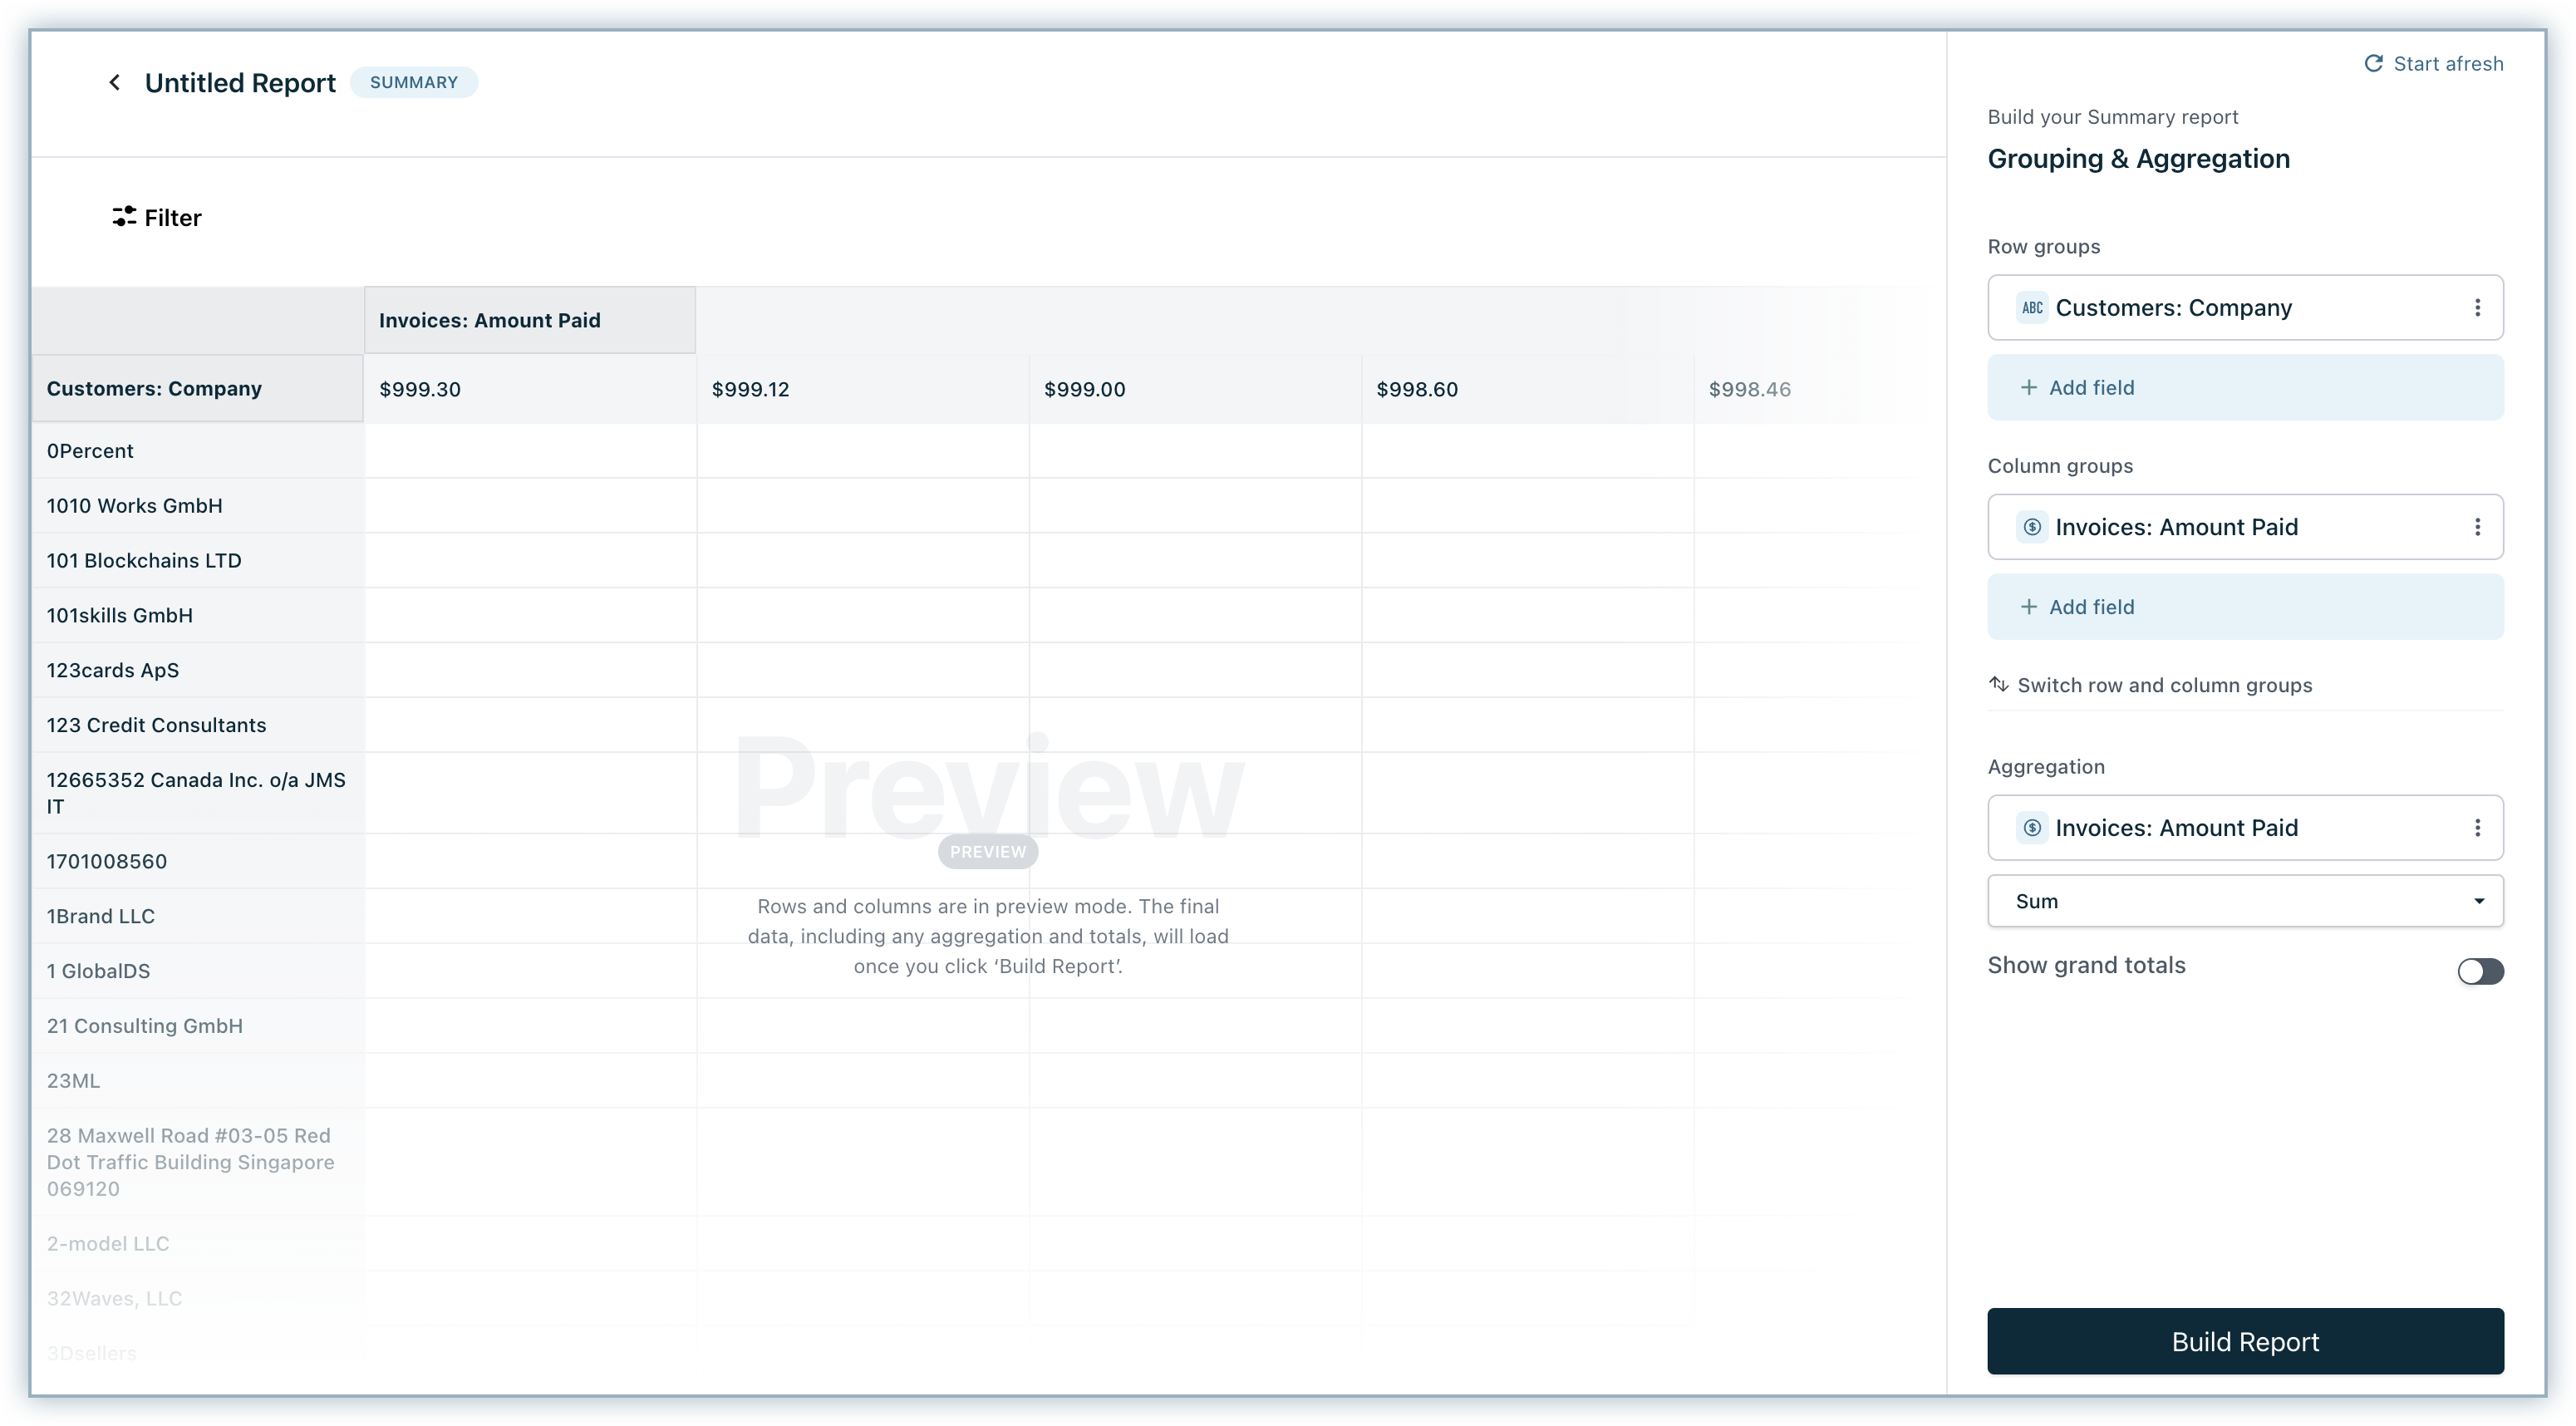
Select Company from the Customers data source under Row grouping.
-
Select the Amount Paid field from Invoices to aggregate the report and apply the Sum function on it.
-
By default, Show grand totals will be disabled in your Summary report. However, you may choose to enable it to show summary values for row and column groupings in your report.
-
Click Build Report. This is how the report will look.
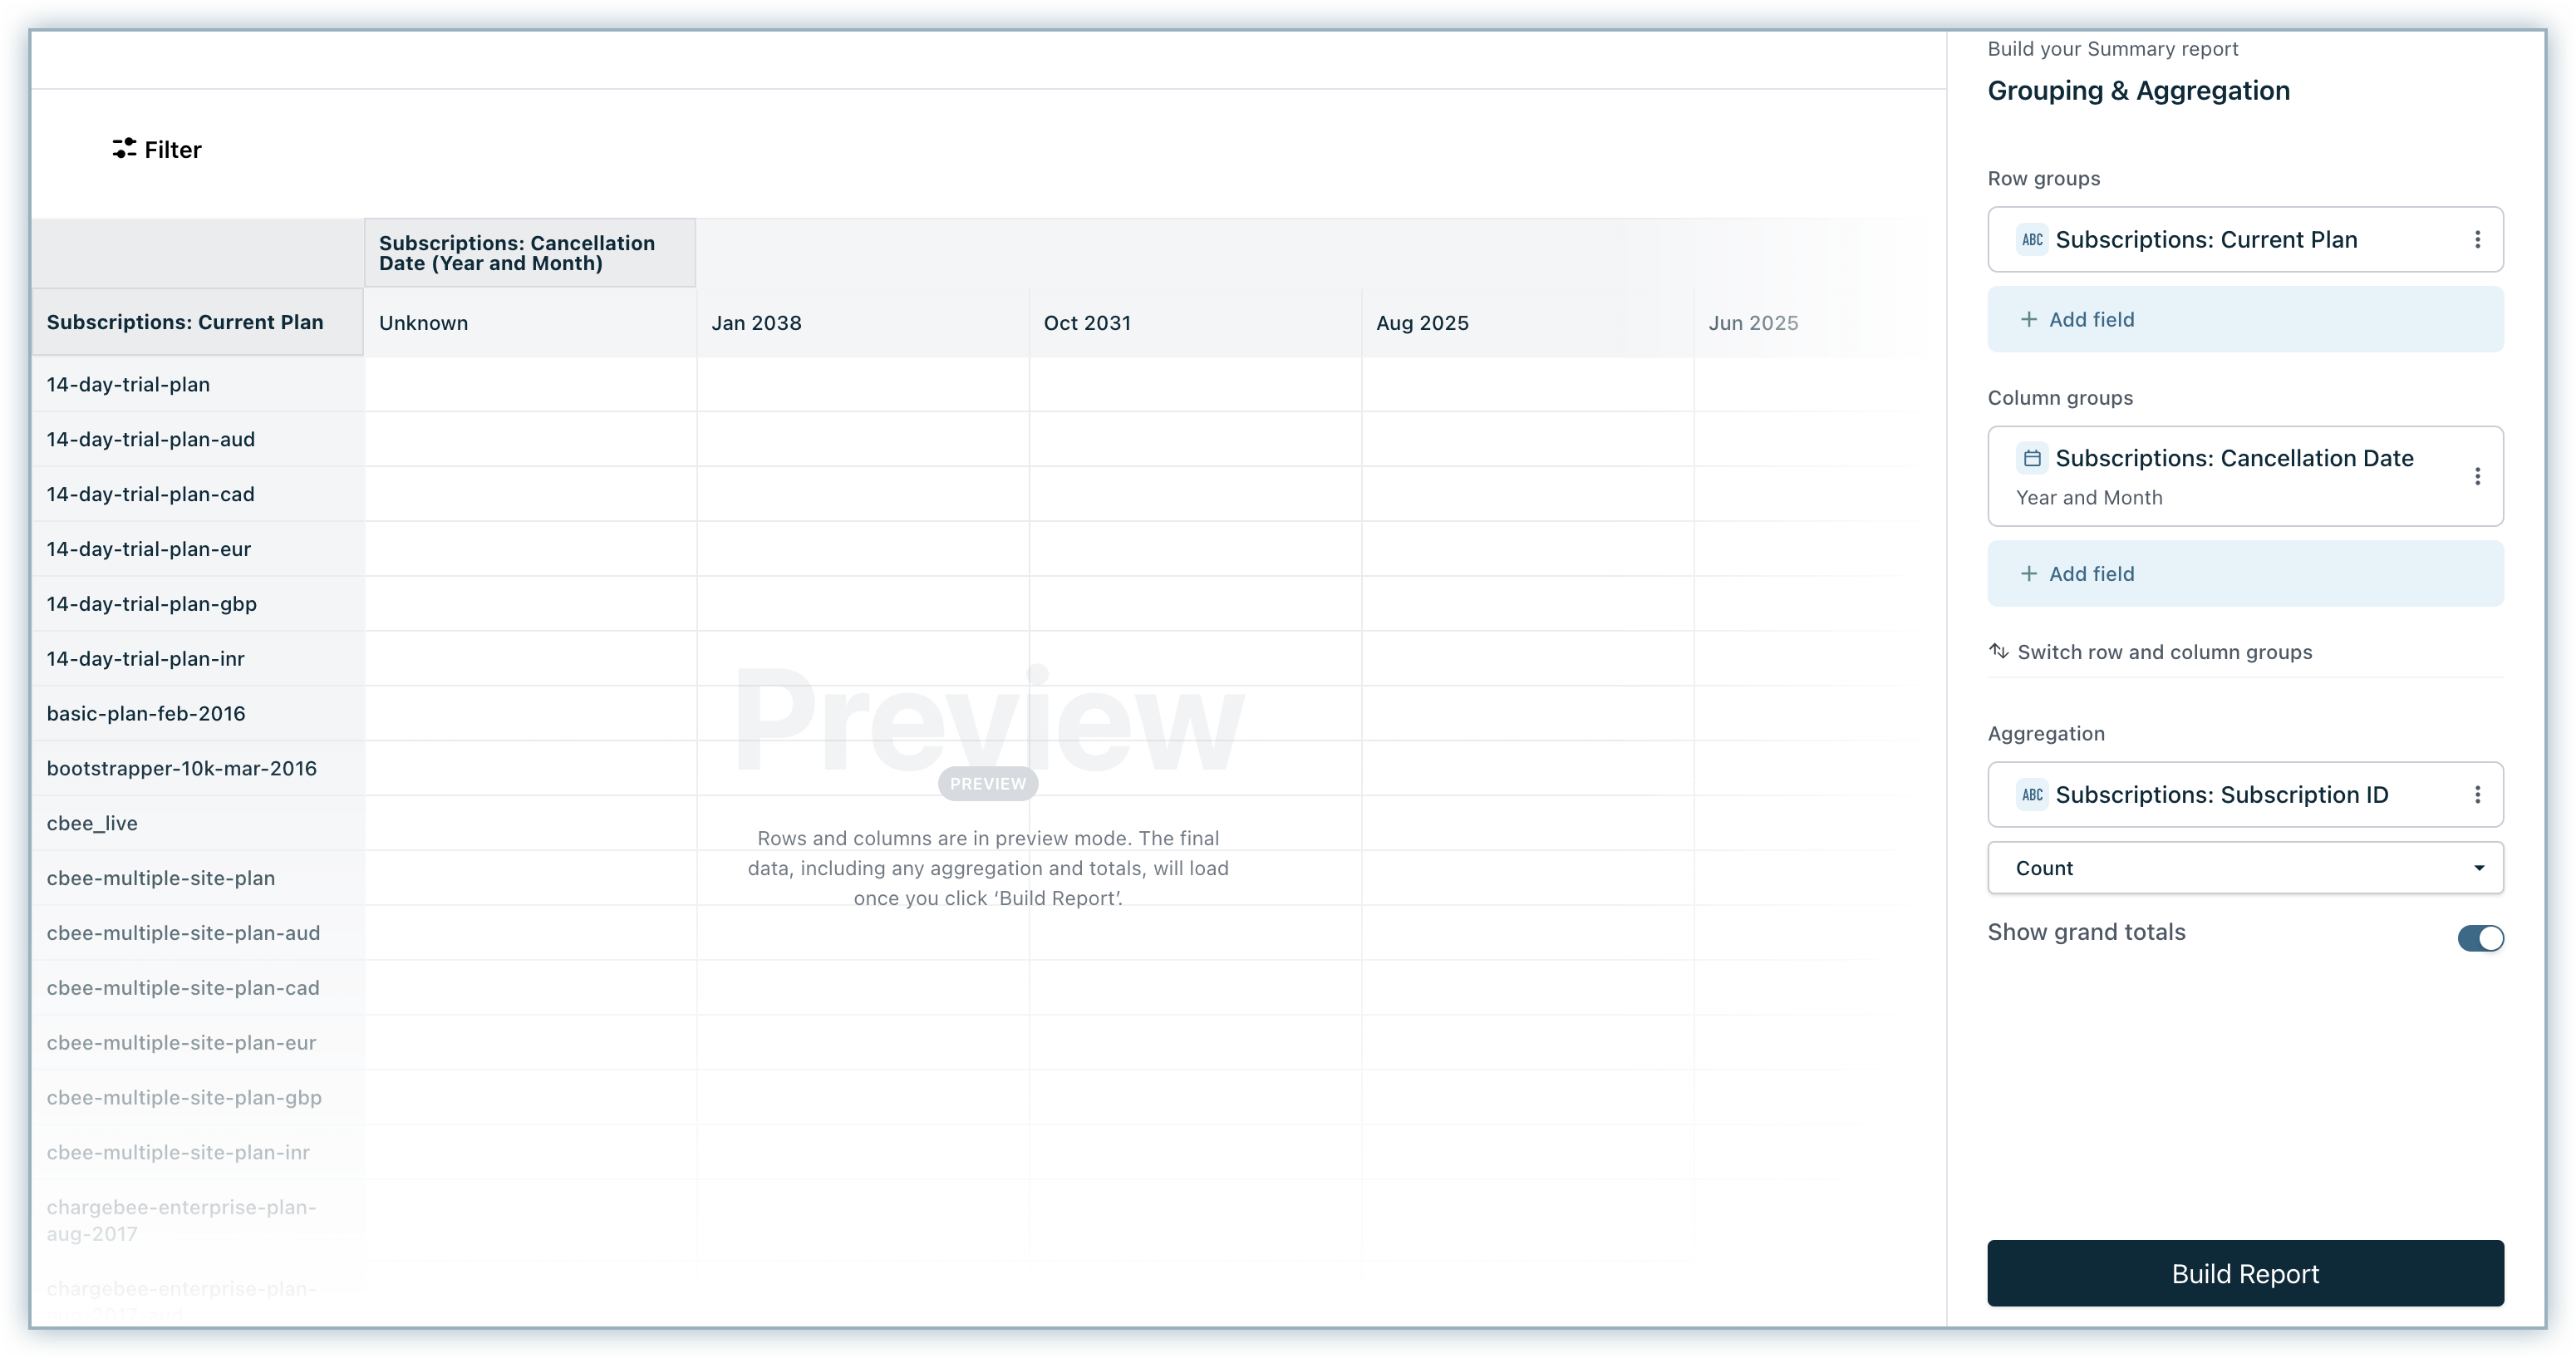
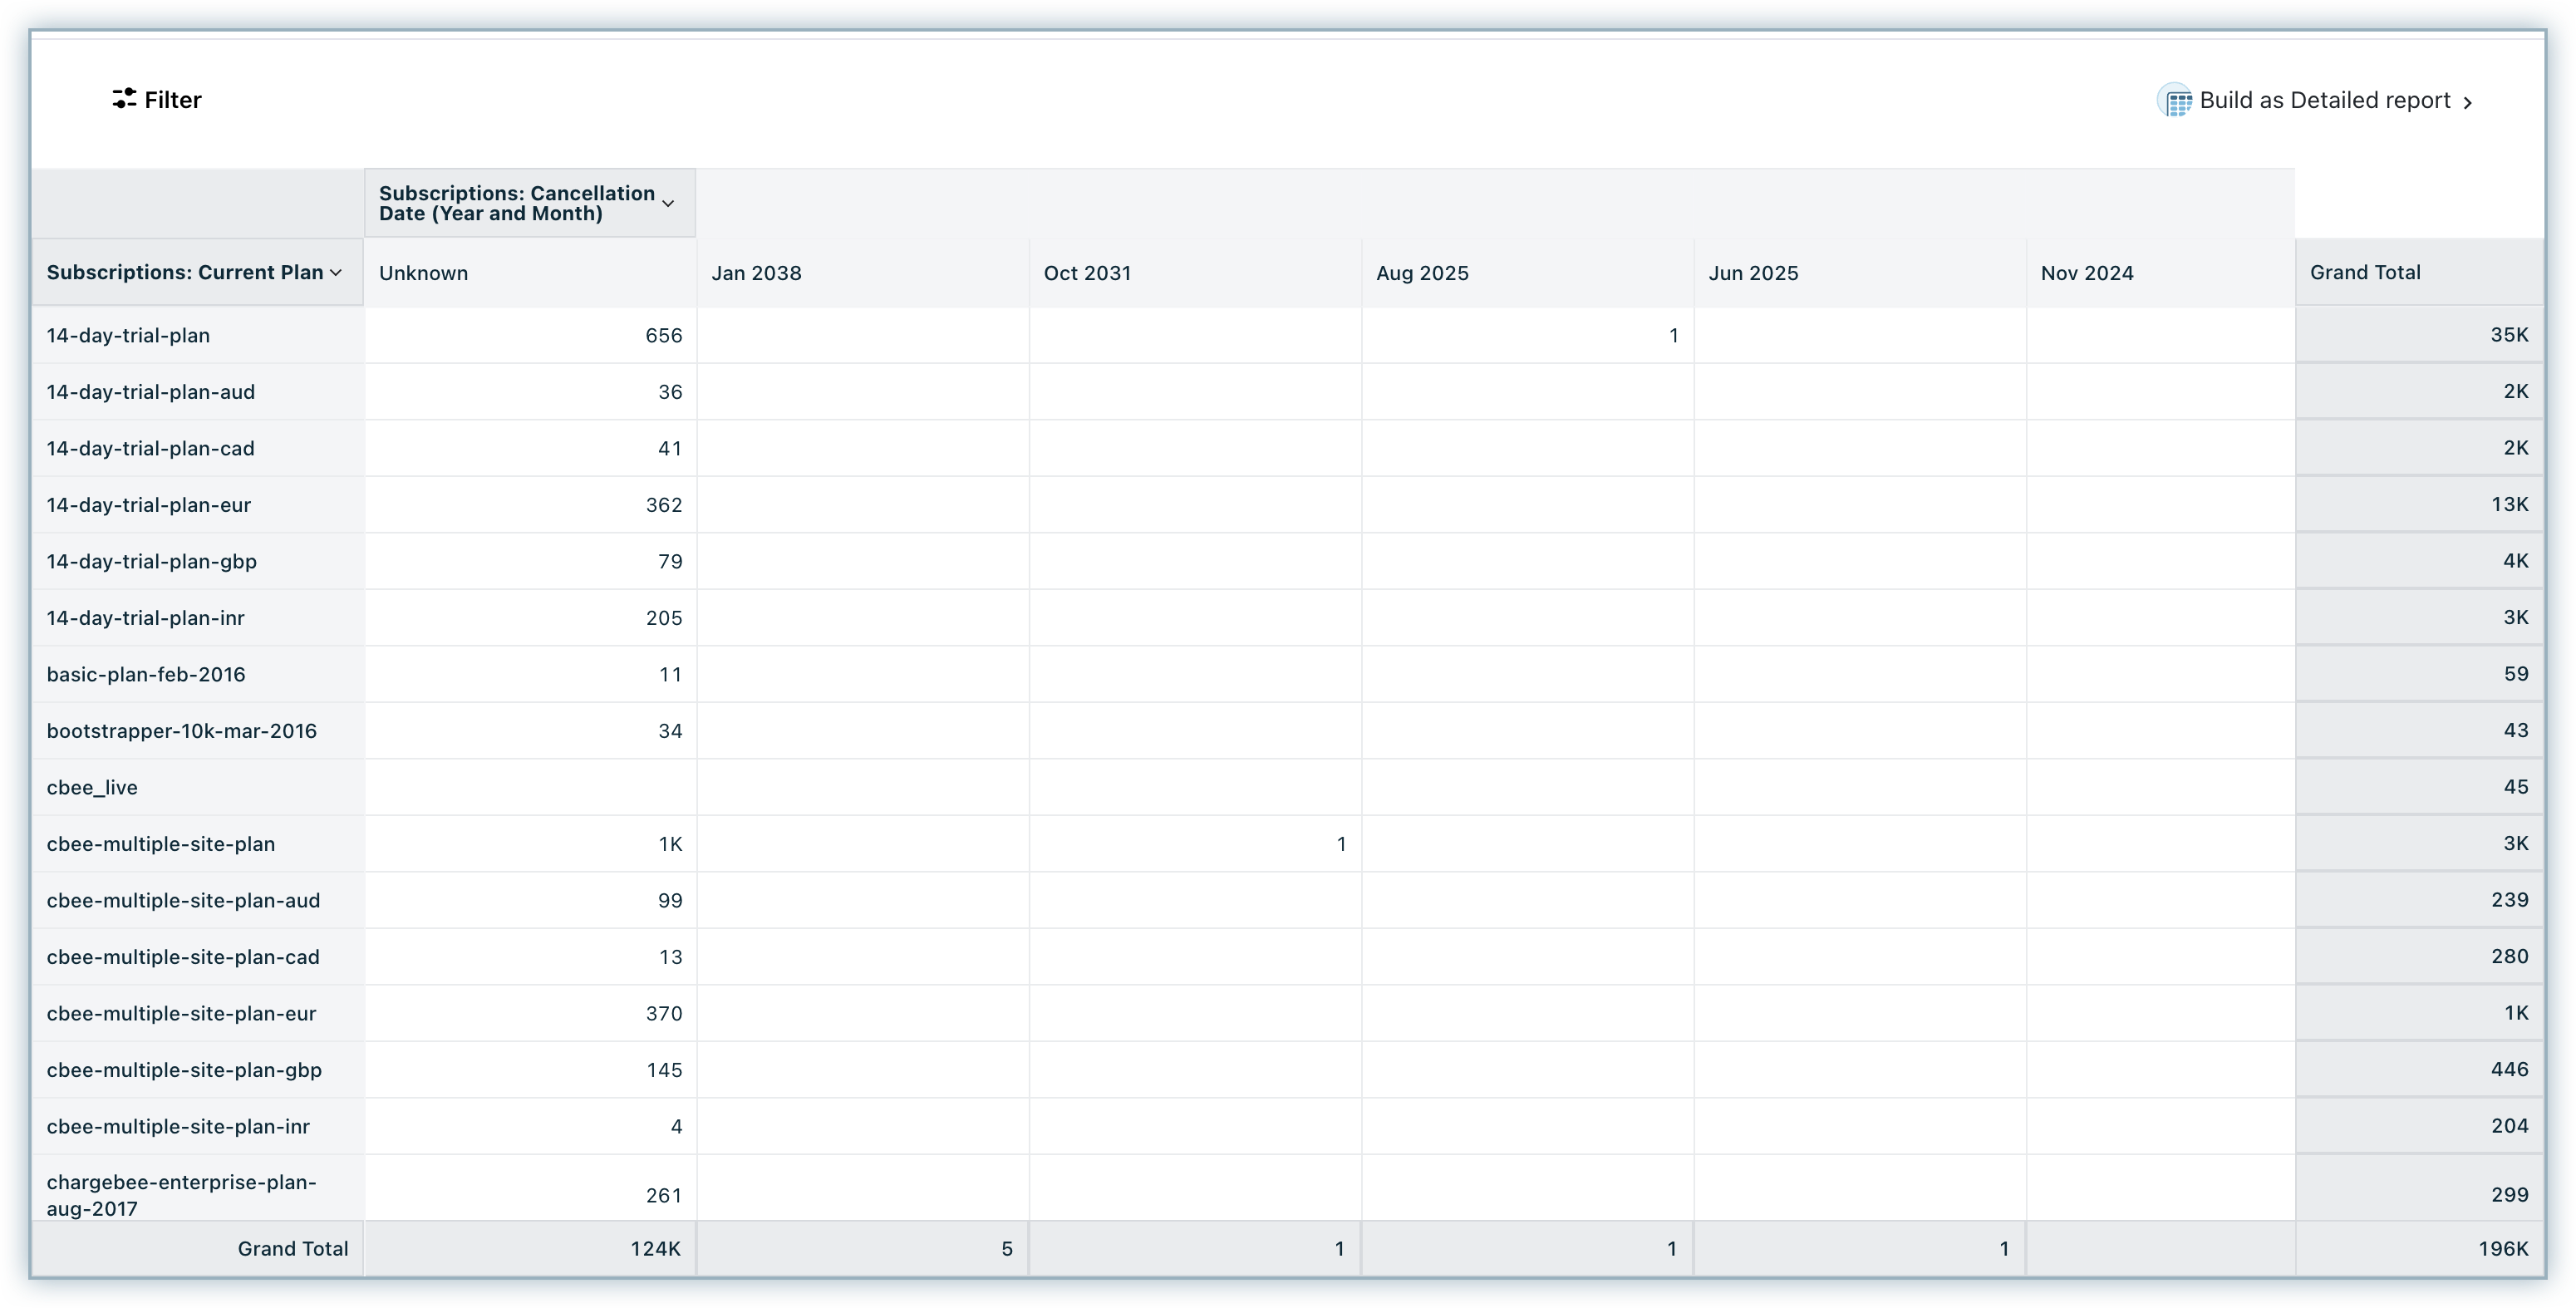
Planwise cancellations each month
This report will allow you to see the total number of cancellations month-wise from each plan.
-
Click RevenueStory > Report Builder.
-
Select Summary Report.
-
Select the data source as Subscriptions.
-
Select Cancellation Date field from Subscriptions (grouped them as Year and month) under Column grouping and Current Plan from the Subscriptions** data source under Row grouping.
-
By default, Show grand totals will be disabled in your Summary report. However, you may choose to enable it to show summary values for row and column groupings in your report.
-
Select the Subscription ID from the Subscriptions data source to aggregate the report and apply the Count function on it.
-
Click Build Report. This is how the report will look.
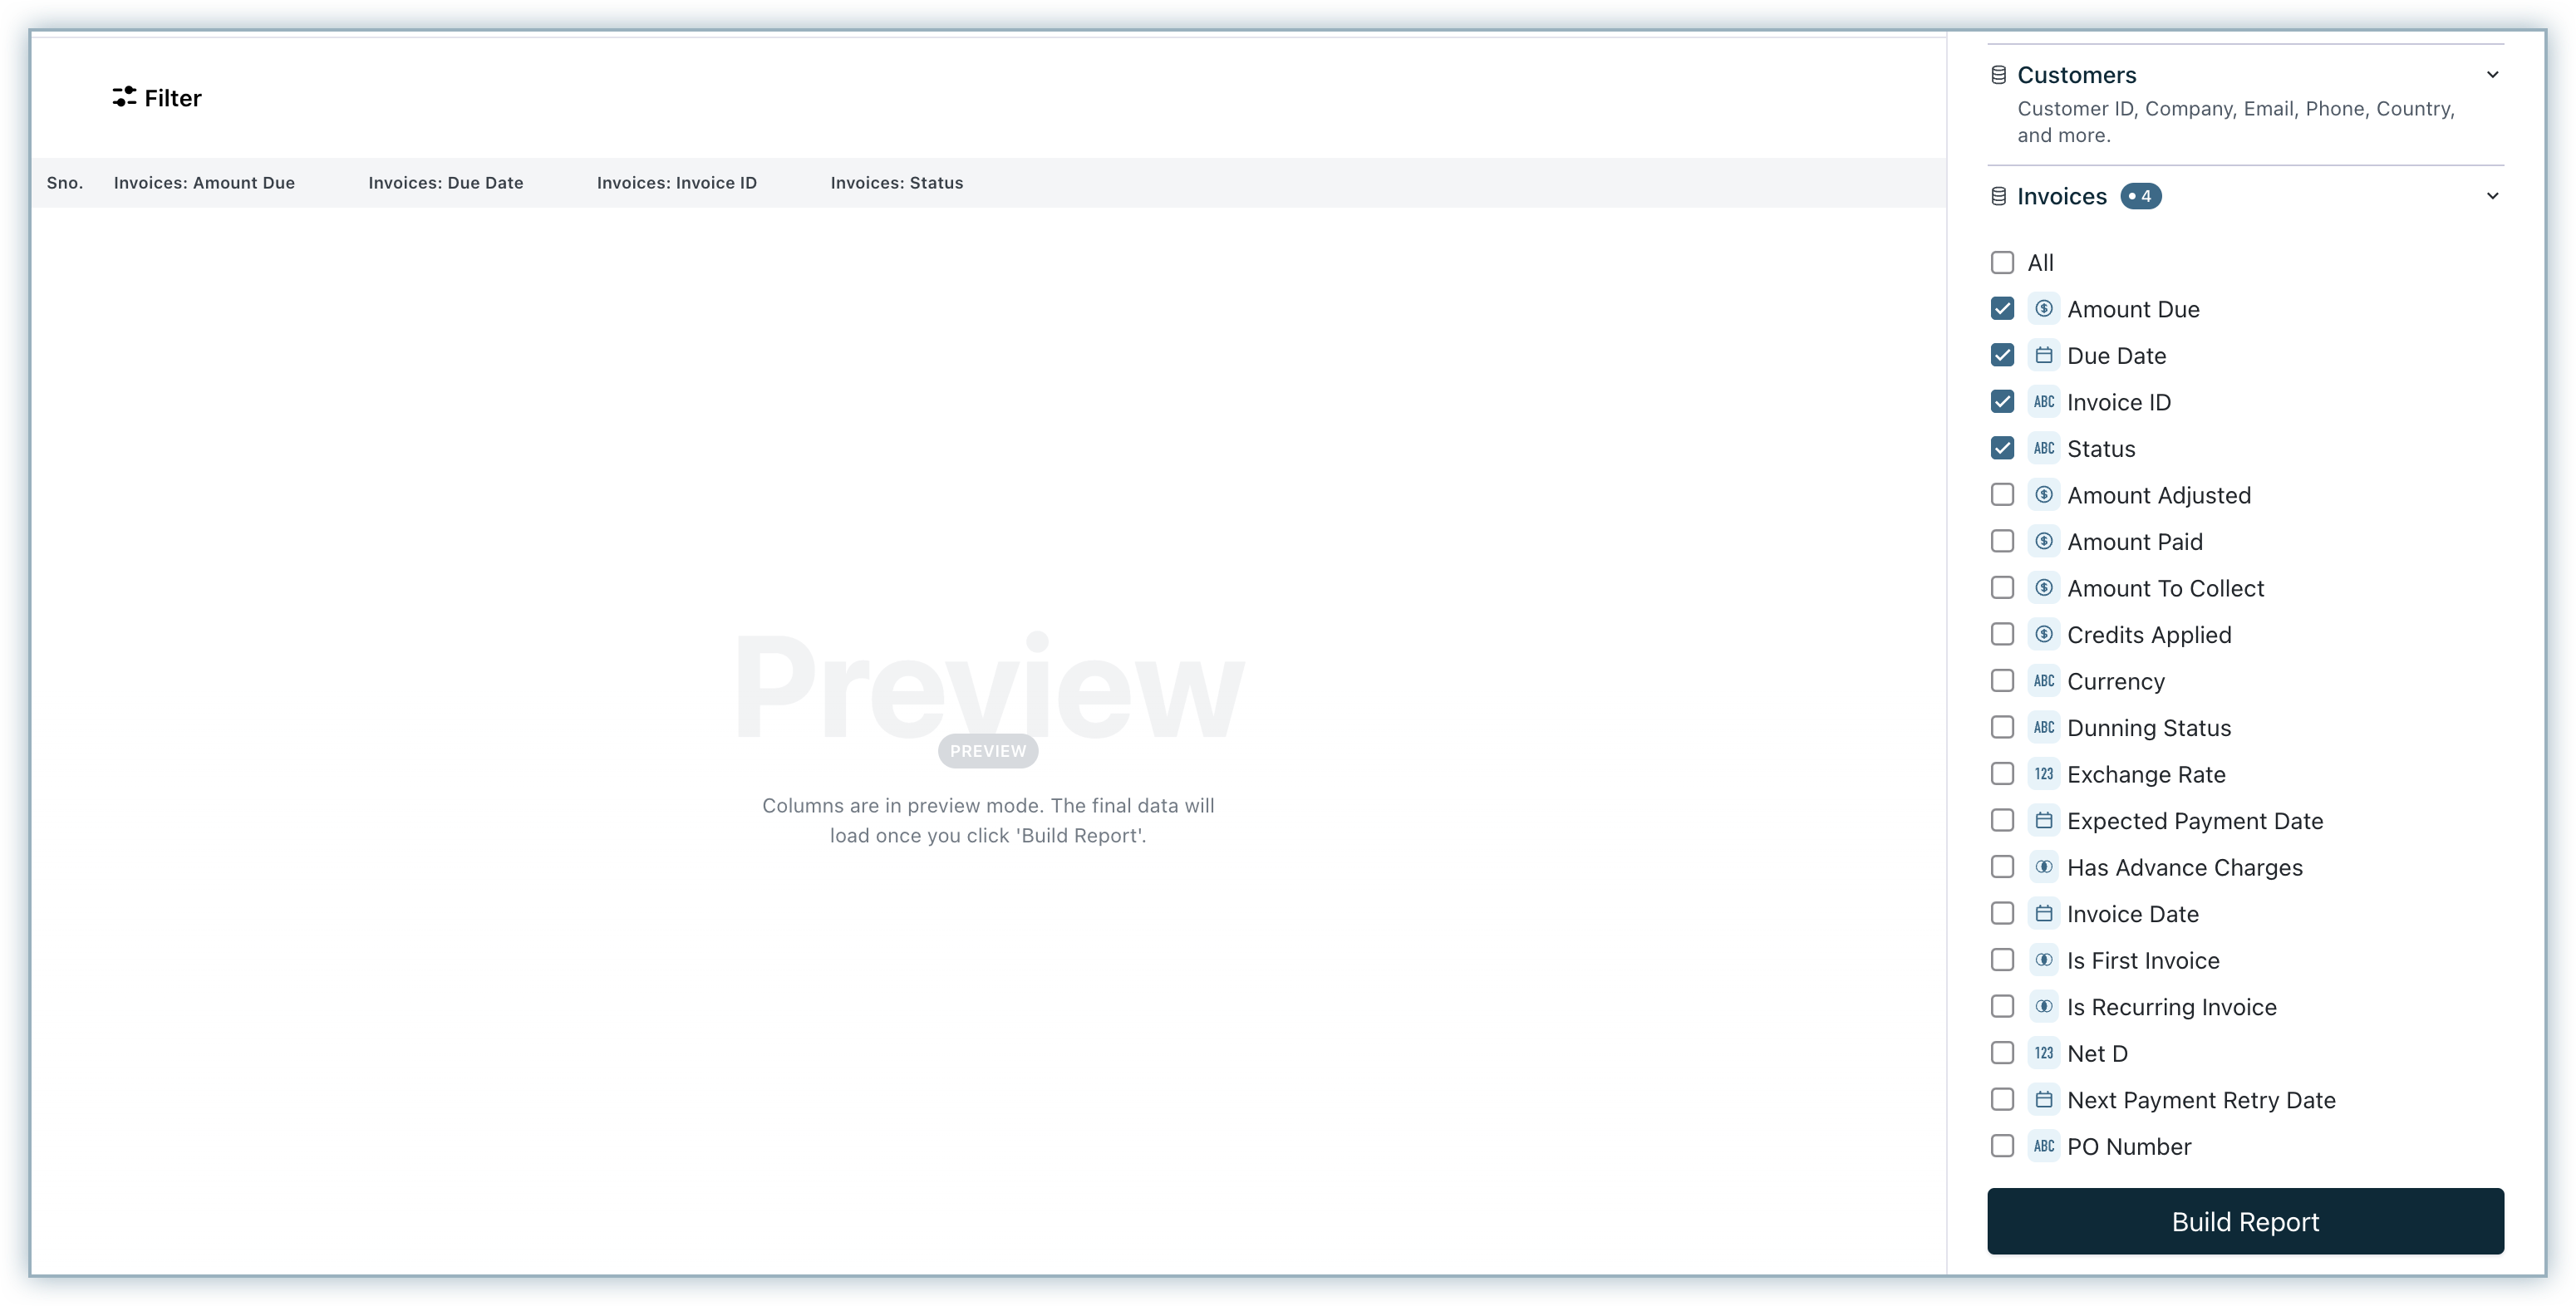
Due Invoices by Customer
The Due Invoices report allows you to view the invoices that are in Due State by the customer. Let us now see how to create this report.
-
Click RevenueStory > Report Builder.
-
Select Detailed Report.
-
Select Next Billing Date, Subscription Status, Subscription ID from the Subscriptions data source, Amount Due, Due Date, Invoice ID, Status from Invoices data source, Email from the Customers data source.
-
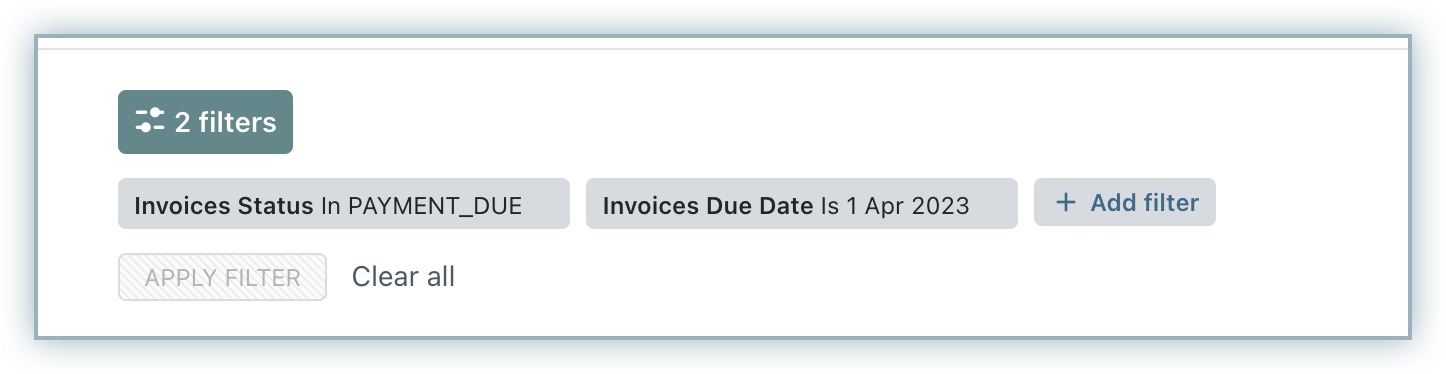
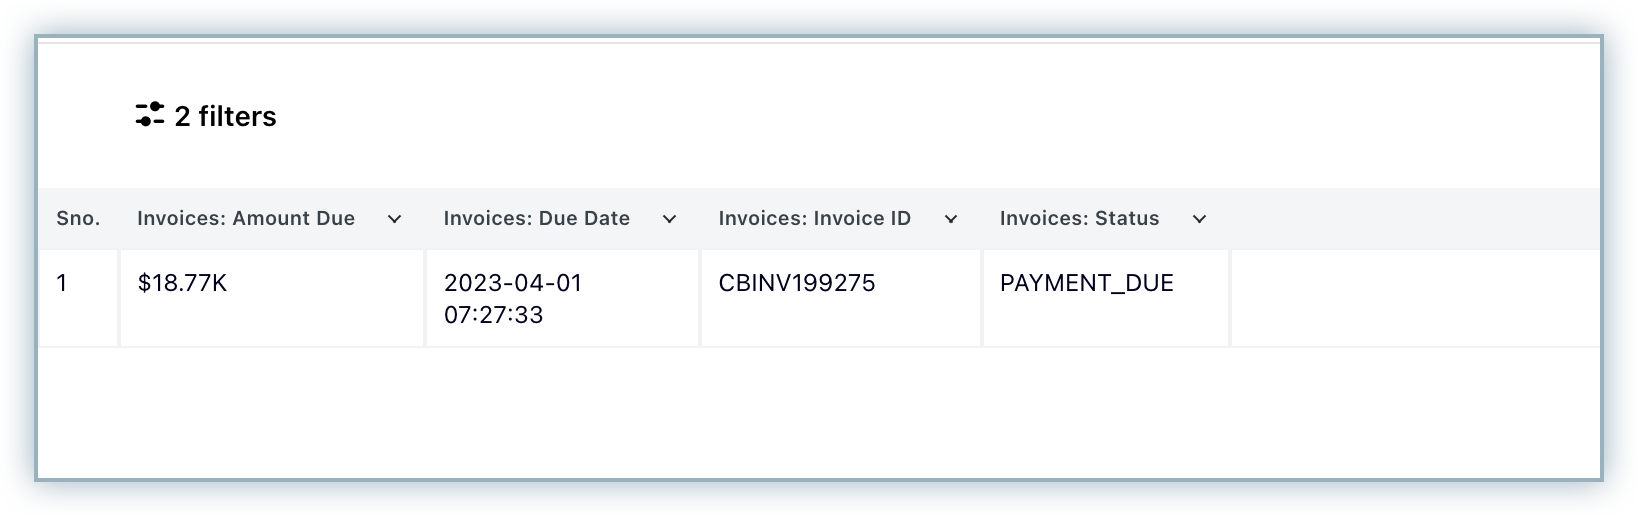
Select Build Report. Next, add the Invoice Status (PAYMENT_DUE), Invoices Due Date, Subscription Status In (ACTIVE) as filters.
-
This is how the final report will look.
MRR (Monthly Recurring Revenue) by Customer (Month-on-Month Trend)
This report displays the MRR trend across customers. To create this report:
-
Click RevenueStory > Report Builder.
-
Select Create a Summary Report.
-
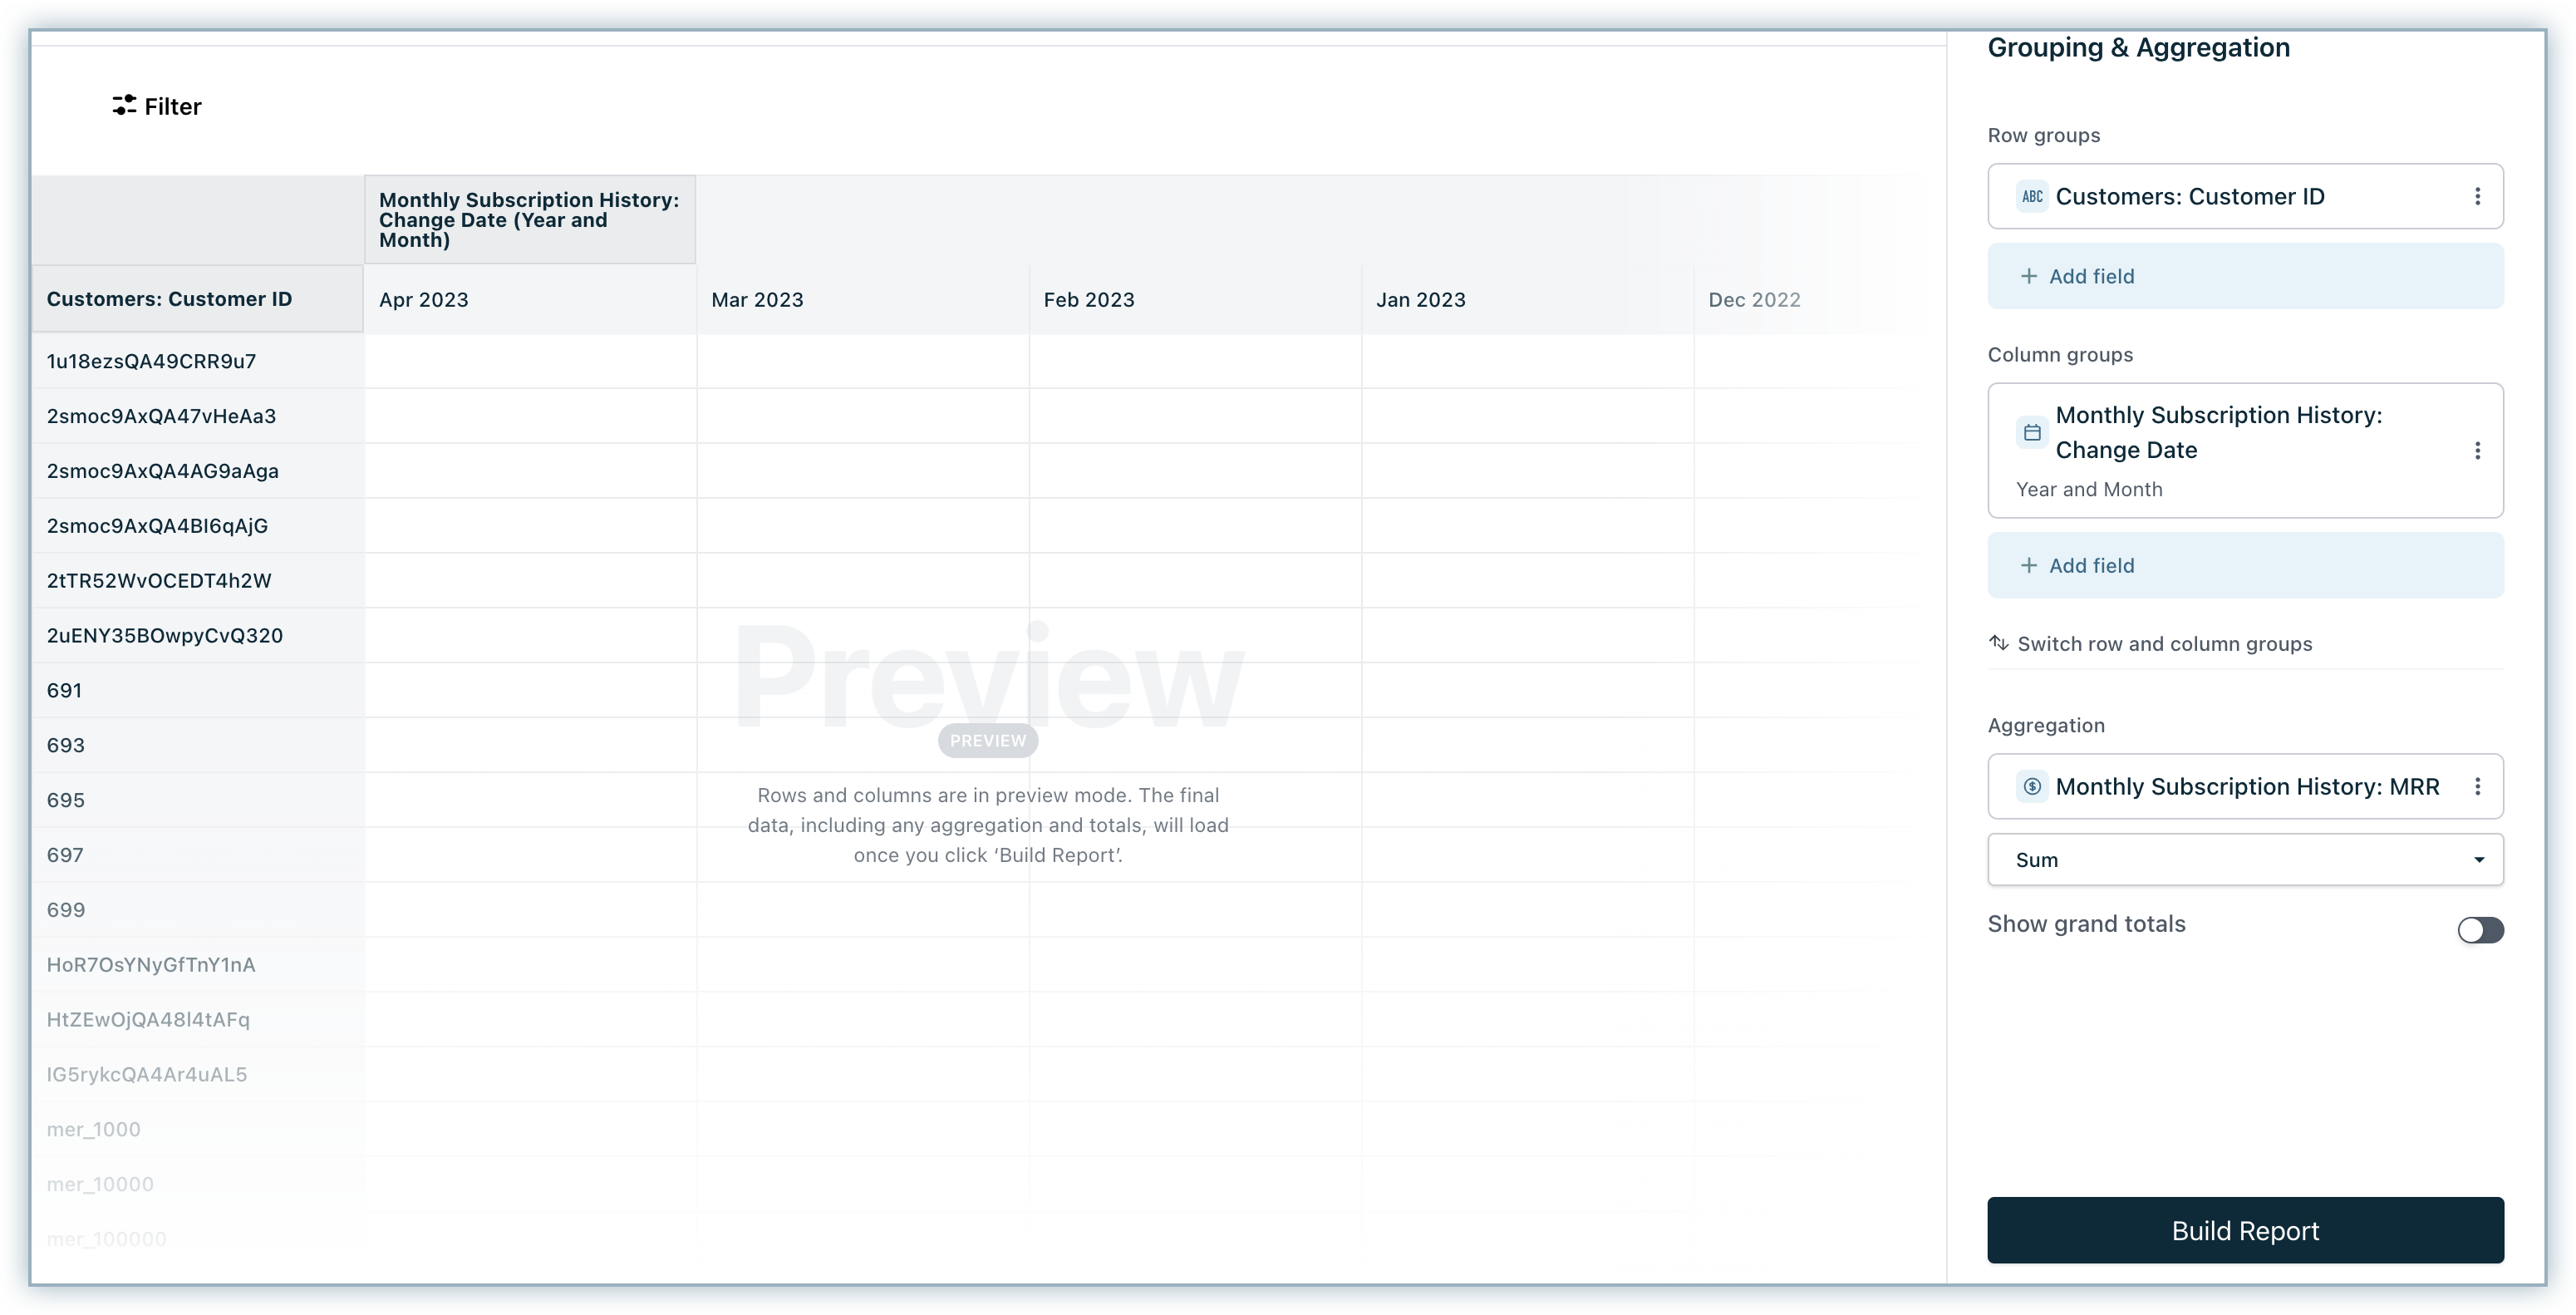
Select Monthly Subscription History as your base data source.
-
In Row grouping, add Customer ID/Company from the Customers data source.
-
In Column grouping, add MRR Changed Date from Monthly Subscription History and group by Month and Year.
-
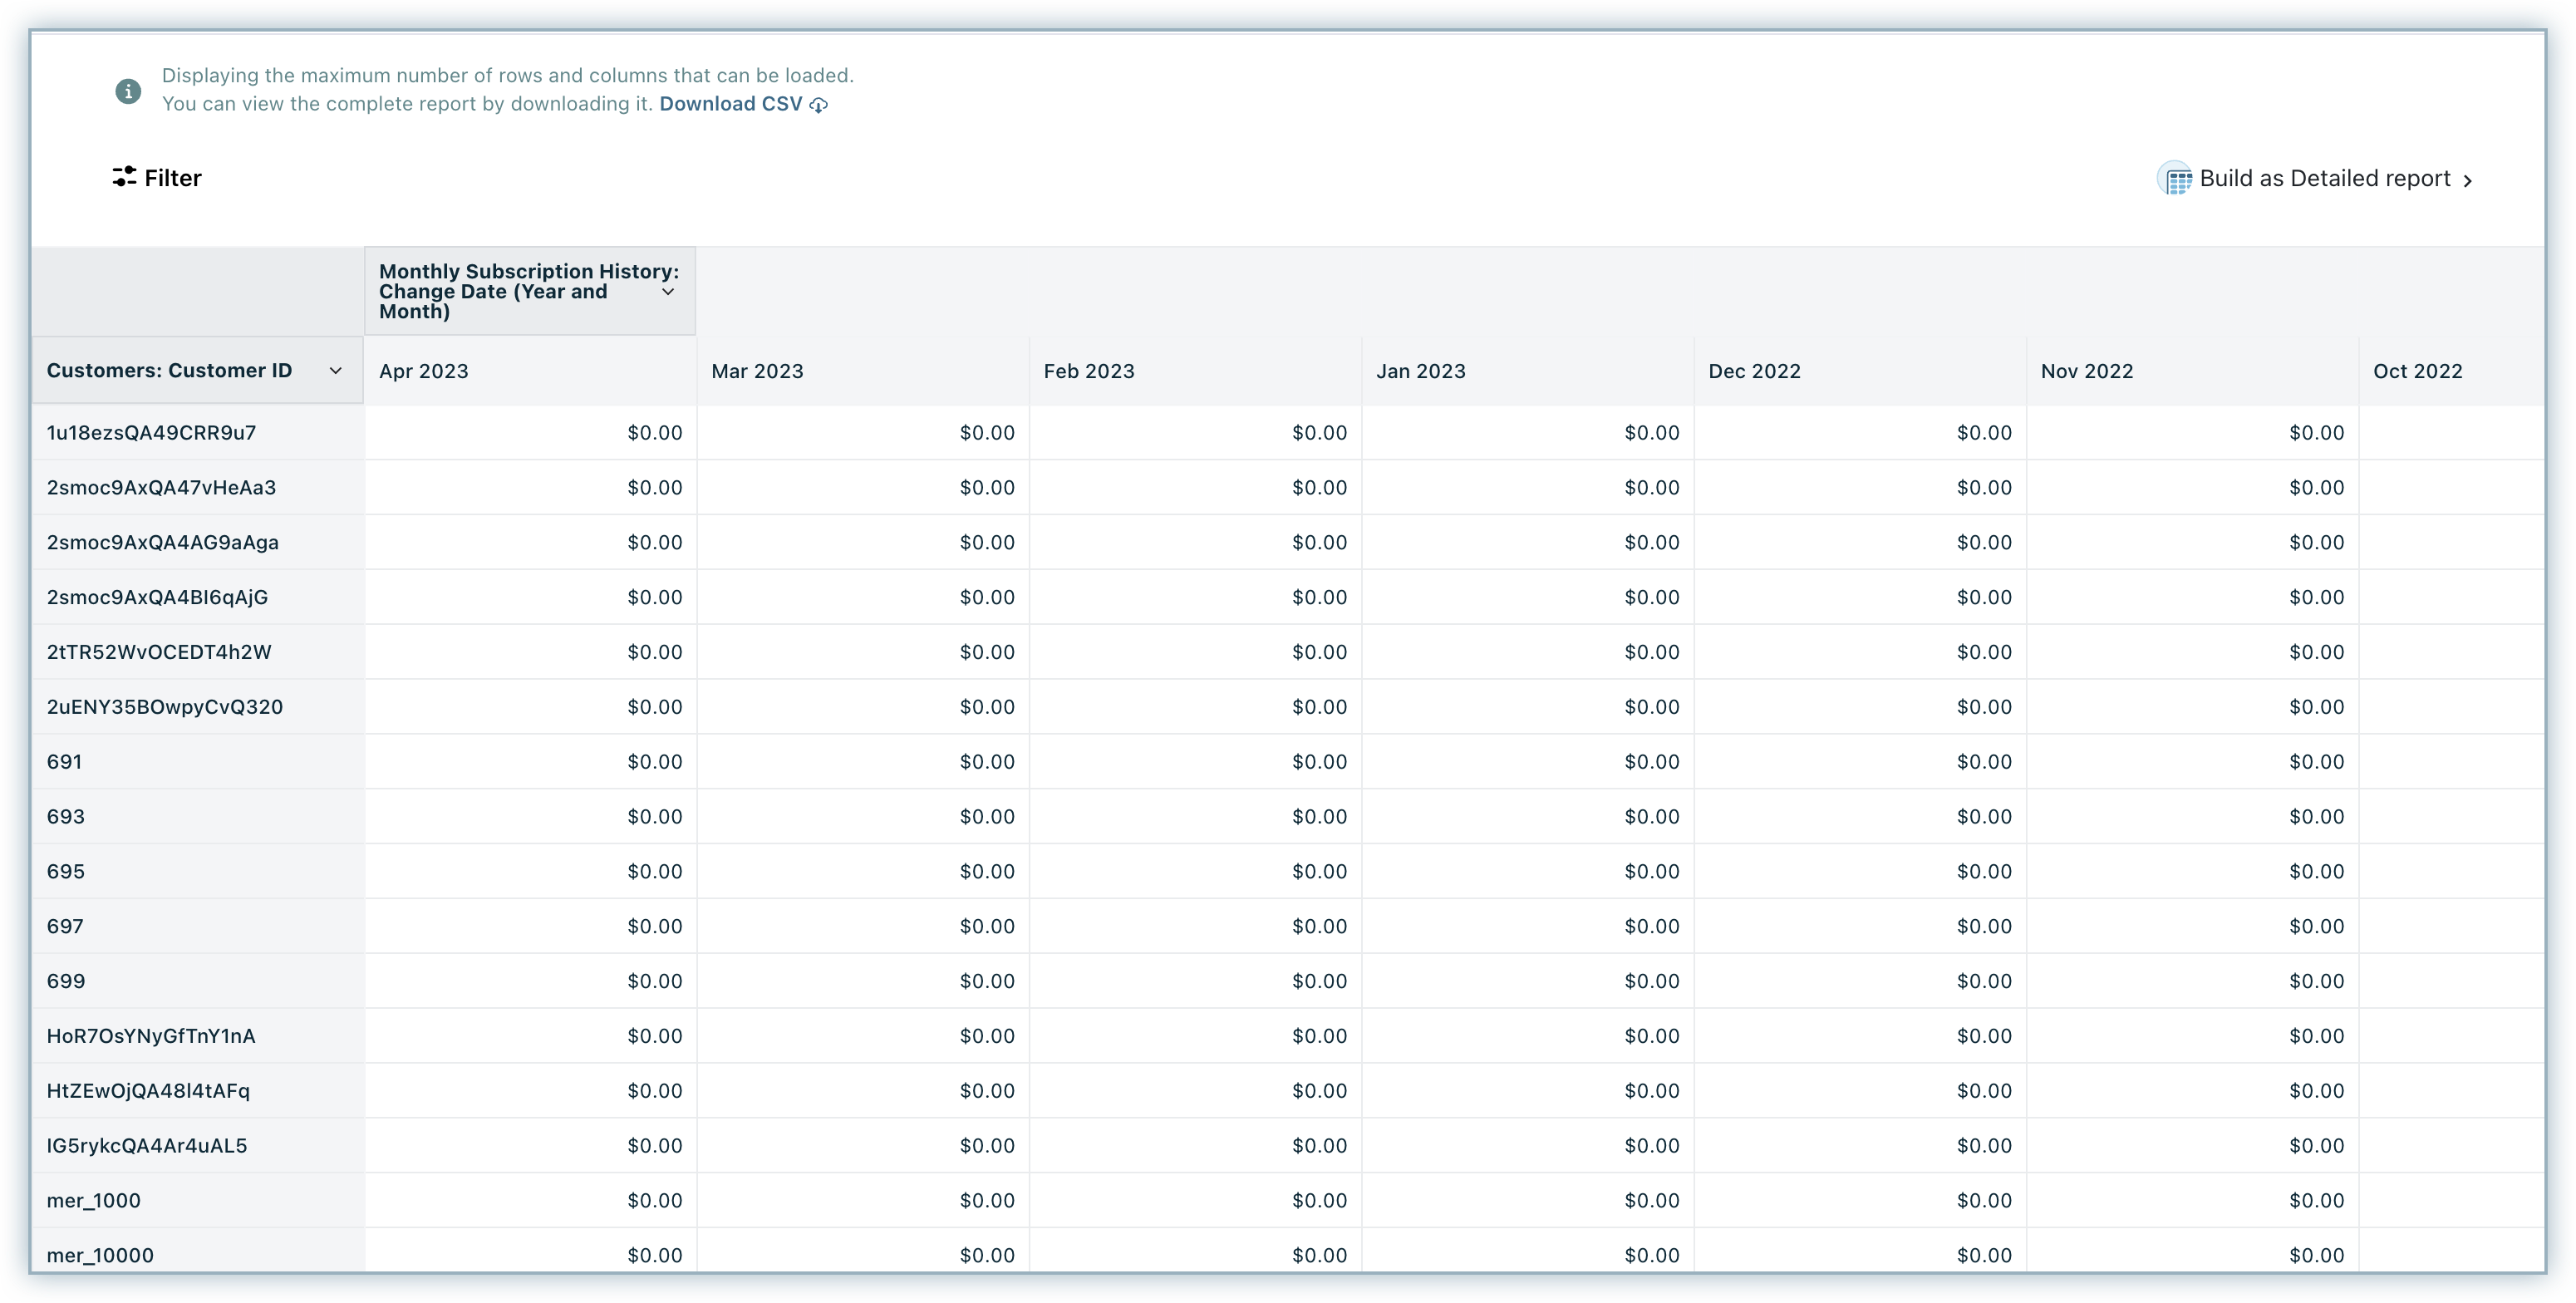
In Summarization (aggregation/measure), add MRR (Monthly) from Monthly Subscription History and aggregate using the Sum function.
-
Click Build Report.
Contraction MRR by subscription
This report displays the contraction or expansion MRR trend on a yearly basis. To create this report:
-
Click RevenueStory > Report Builder.
-
Select Summary Report.
-
Select Yearly Subscription History as your base data source.
-
In Row grouping, select Subscription ID from the Subscriptions data source.
-
In Column grouping, add MRR Changed Date from Yearly Subscription History and group by Year(this is the historical date associated with MRR).
-
In Aggregation add MRR (Yearly) from Yearly Subscription History and aggregate using the Sum function.
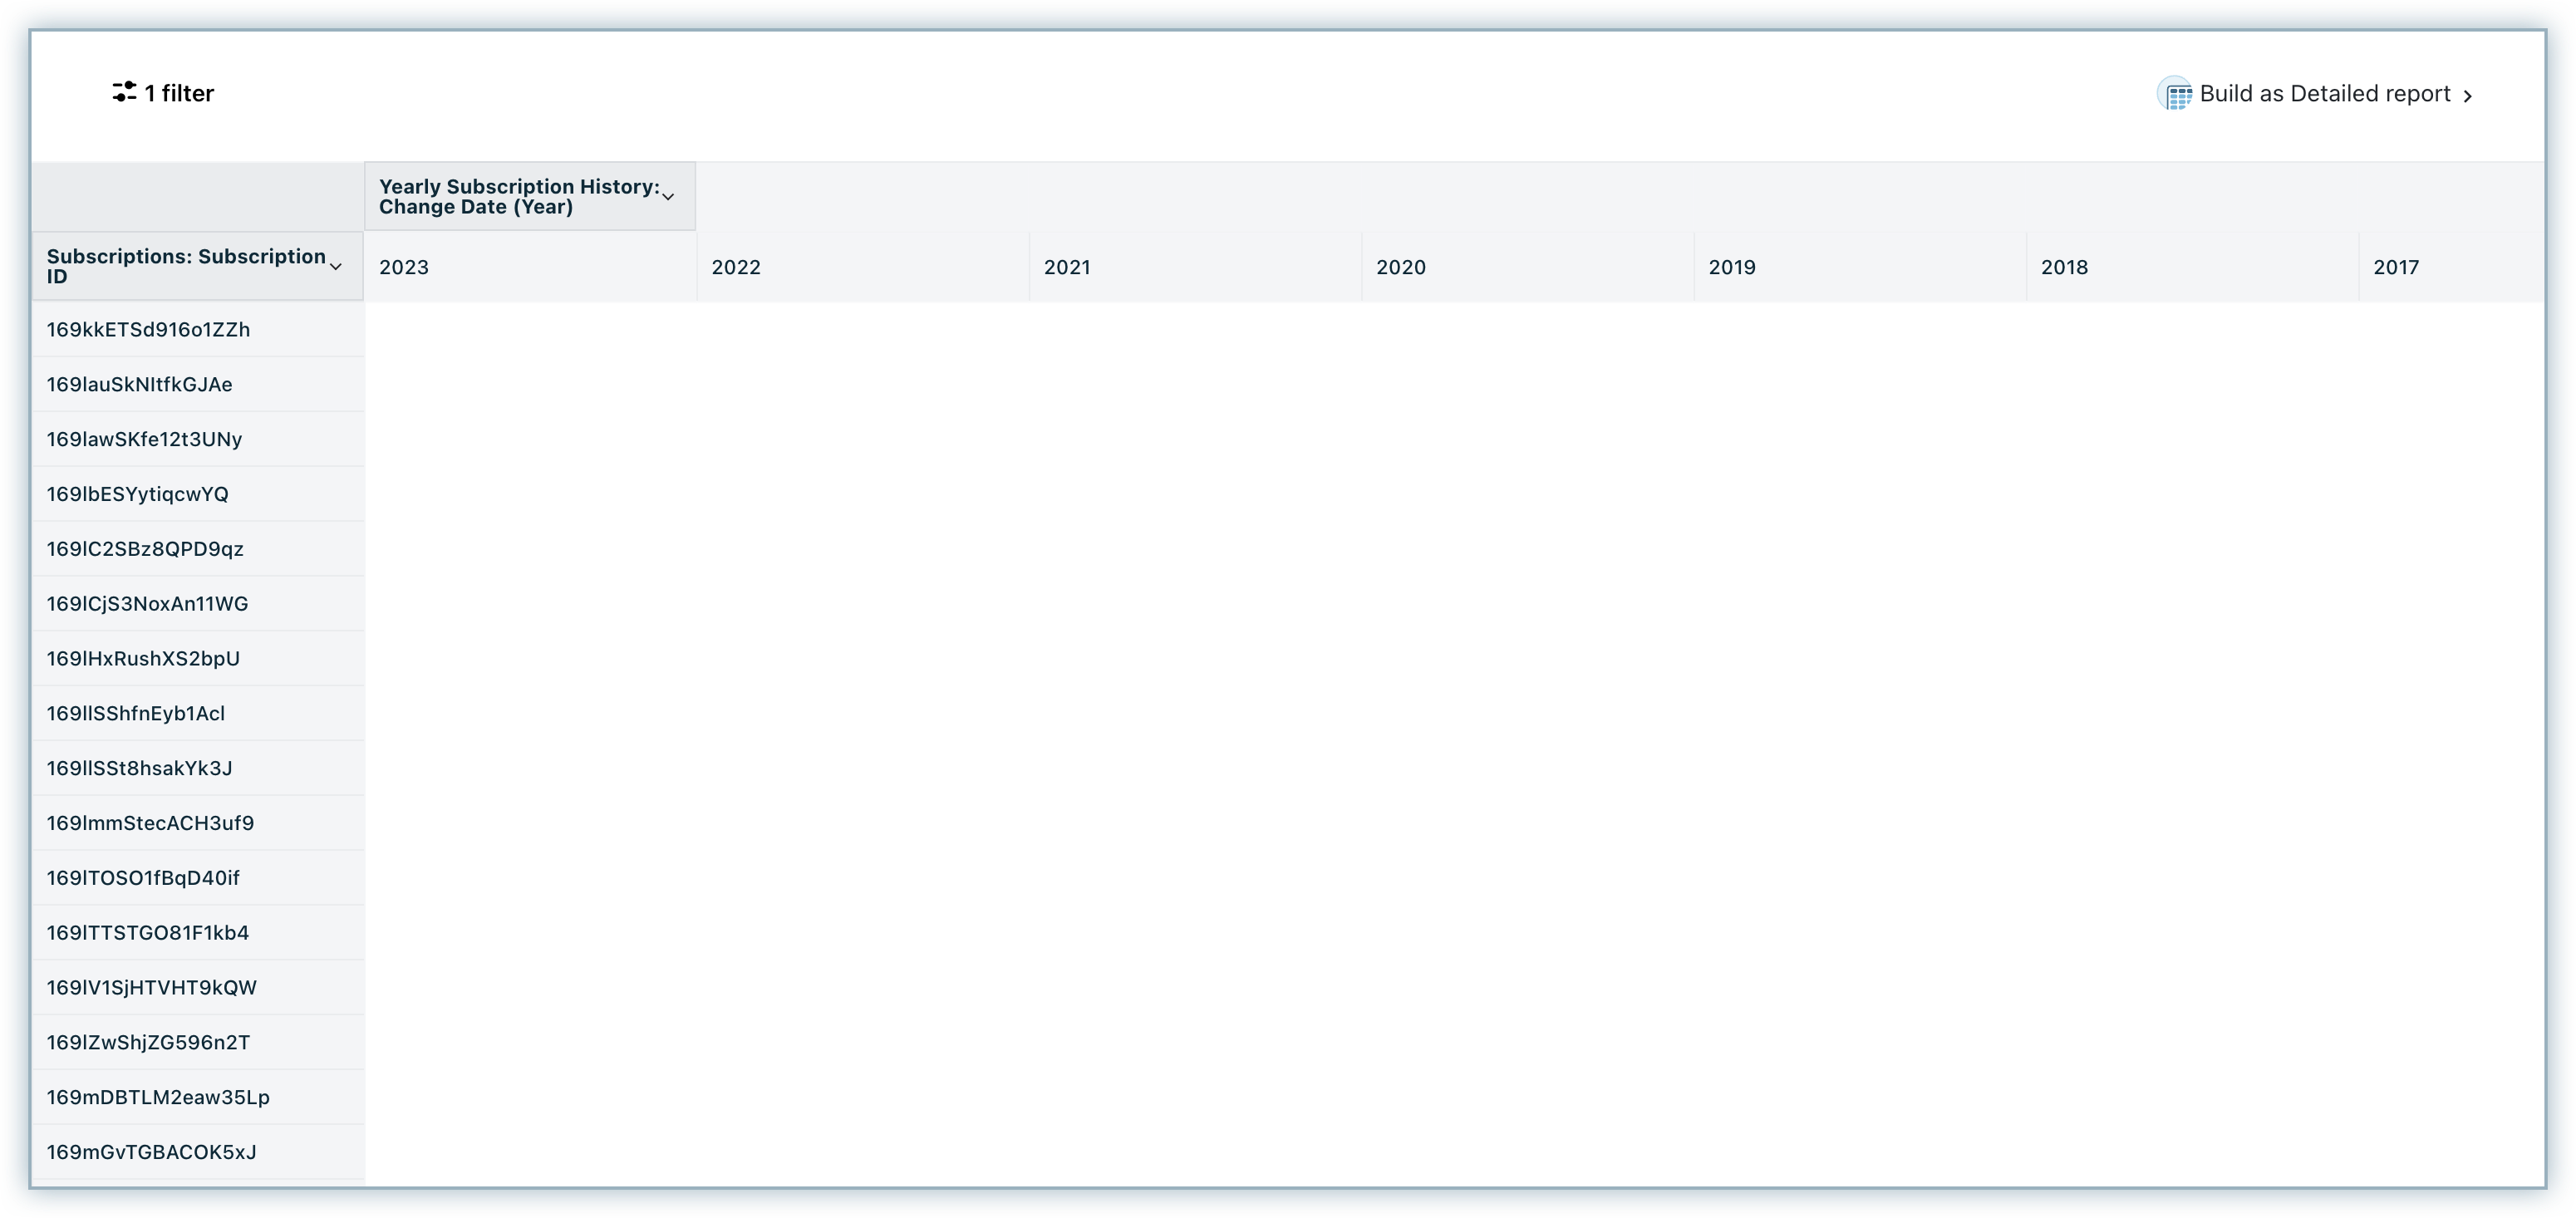
-
Click Build Report.

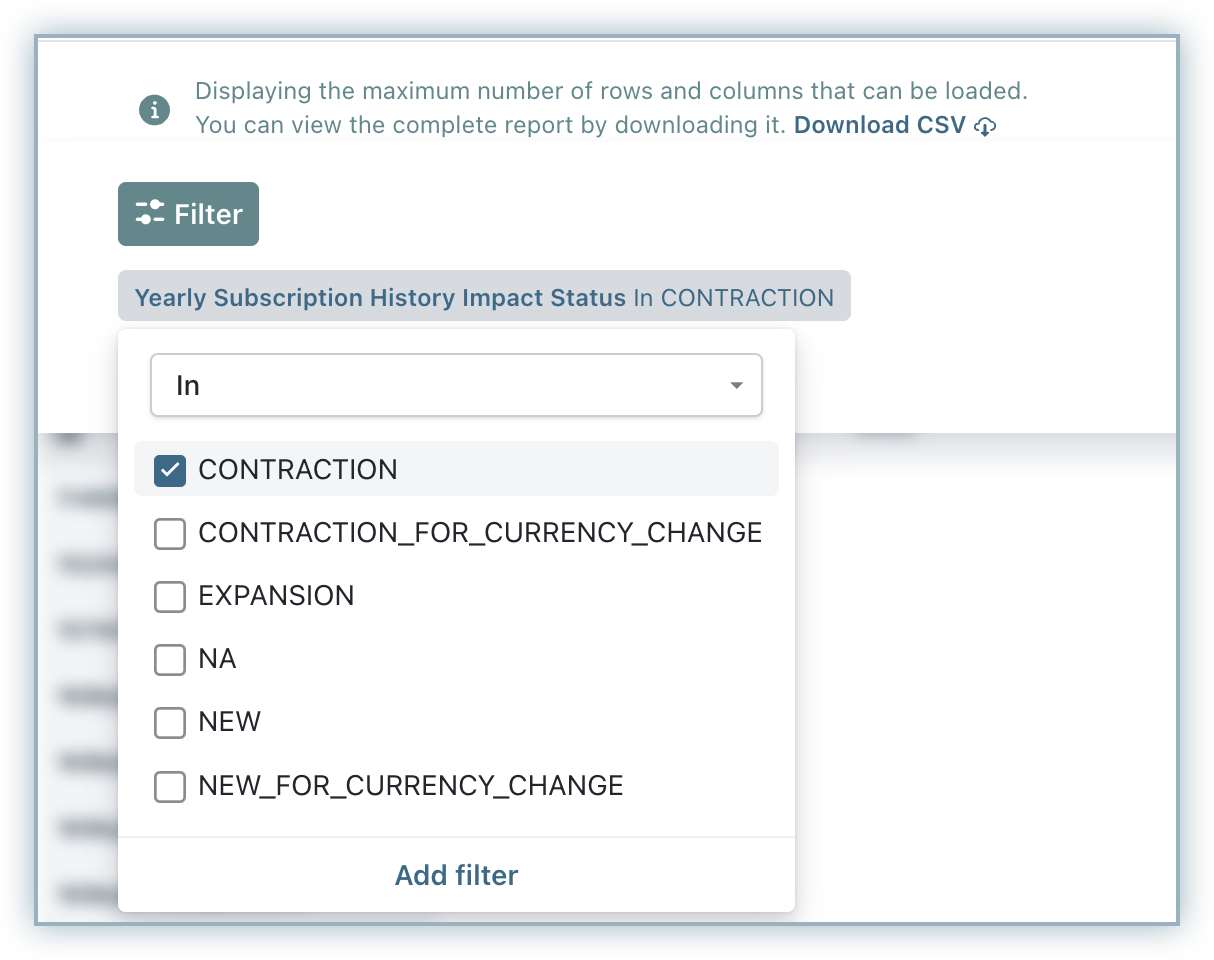
-
Select MRR Impact Status from Yearly Subscription History. You need to select Contraction from the drop-down and then apply the filter to display the Contraction MRR.
Was this article helpful?