


Building for observability

Audit-Ready Billing,Built on OpenTelemetry

Stop finding out about billing breaks after they've cost you. Get to every metric, log, and trace from anywhere, on any device, in any tool your team already trusts. It's powered end to end by OpenTelemetry, the open standard your engineers already know.

Trusted by Teams Who Don't Get Billing Wrong

Uptime, 90-day
6,500+
Businesses, across 150+ countries
60+
Integrations, every major APM included
2025 Gartner Magic Quadrant, Recurring Billing

Running billing on Chargebee

Your Billing Data, in Tools You Already Run

Chargebee streams every trace, log, and event through OpenTelemetry, so your billing data speaks the same language as New Relic, Datadog, Splunk, Honeycomb, or whatever backend your team has already invested in. That means you resolve incidents faster, stand behind the numbers at audit time, and close coverage gaps without adding another tool.

Built for OpenTelemetry

OpenTelemetry is the open standard most engineering teams already build around. Chargebee follows it, so your billing data fits into how you already work.

Streams into Your Existing Tools

New Relic, Datadog, Splunk, Honeycomb, and more. You don't adopt, train on, or pay for a new console just to see your billing data.

Opting in Doesn't Cost Performance

Turn on detailed tracing wherever you want it, and leave it off everywhere else. Either way, your billing calls run at the same speed, with the same result.

Answers Without the Exposure

You get what you need to explain a problem without touching personal or payment details. Nothing reaches a trace until someone reviews and approves it, so a new field can't slip in by accident.

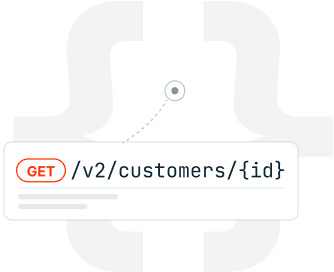
Every Chargebee API call shows up as a traceable step inside the tools you already use, connected to the rest of a request so you can follow it from start to finish. It stays light and safe by default, and never gets in the way of a live call.

Read the Chargebee OpenTelemetry integration docs →

Depth From Combining Every Signal

A billing system you can trust rests on multiple layers of data. No single data type explains a distributed billing stack: depth comes from combining metrics, events, logs, and traces, not from any one of them alone. That depth lets you attribute a discrepancy with confidence, assign it to the right owner, and evidence the resolution, turning hours of investigation into a single query.

Metrics

Capture a single number, in the moment

A metric has a name, a timestamp, and a value.

Examplepayment_success = 99.98% · 14:32:07

Why it matters: chart payment success rate or P95 gateway latency so a slow drift shows up before it becomes an outage.

In ChargebeeTiming on every gateway API call
Events

Capture what happened, all at once

An event carries several details at once: one thing that happened, captured whole.

Examplepayment.succeeded · gateway=stripe · $49.00 · 200 OK

Why it matters: a single payment.succeeded tells you gateway, amount, and status without opening a log.

In ChargebeeEvents, with delivery status and retries
Logs

See everything that led up to it

Where an event marks a trigger, a log captures everything that led up to it, structured or unstructured.

Example14:32:07 webhook.retry attempt=2 status=503 /hooks/invoice

Why it matters: replay the webhook retries and gateway responses that led to a failed invoice.

In ChargebeePayment, webhook, and email logs
Traces

Follow one request across every service

A trace follows one request as it moves across systems and ties all the related logs together.

Examplecheckout → invoice → payment → webhook · trace #a1f2c9

Why it matters: one Trace ID follows a subscription change from checkout to invoice to payment to webhook.

In ChargebeeTrace IDs that group a full operation

Know What Broke, Where, and Why

Every record, signal, and health check lives in one place. You operate from facts, not hunches. And you stay a step ahead of anything that could reach your customers.

Find your answer in one place, without digging across tabs

The records that matter are searchable inside Chargebee. Instead of stitching the story together from a dozen tools, you go straight to the one you need, and get to the root cause in minutes, not hours.

  • Search every record in one place, with no jumping across a dozen tools.
  • Filter to the view you need: API, gateway, payment, webhook, and email.
  • Reach the root cause, without stitching tools together.
POST /subscriptions
201 Created · 118ms · Trace #a1f2c9
GET /invoices
200 OK · 74ms · 42 records
POST /payment_sources
422 · card_declined · error surfaced with trace

Surface the signals that matter, not the noise

Chargebee watches the signals that matter, around the clock. Set thresholds on failed payments, webhook retries, or latency, and Chargebee correlates and prioritizes what fires, so you act on what's real instead of hunting through dashboards.

  • Cut the false alarms, and focus on what's real.
  • Spot issues proactively, before they reach your customers.
  • Resolve faster, without the guesswork.

Know the ground you're standing on

Track availability, latency, and uptime live across every Chargebee module. When something needs attention, you see exactly where it is and why, so you act on facts instead of guesswork.

  • Live availability and latency across every module.
  • One live timeline for every module and integration.
  • A clear ownership line between what's ours to fix and a third party's.
  • Catch it before it hits revenue, not after the close.
  • Settings and configuration change audit, tracking who changed what and when.
  • Anomaly detection, flagging unusual patterns before they become incidents.

What Monitoring Costs You

Most billing systems offer monitoring that's reactive, keeping you informed when something has broken. But knowing that something broke isn't the same as knowing why, or catching it before it spreads, and in a distributed billing stack that gap drives up both resolution time and revenue exposure.

Chargebee closes that gap by connecting metrics, events, logs, and traces into one system, and pinning third-party latency on the right owner, so you reach the cause, not just the symptom.

Here's what Chargebee surfaces

A customer's card gets declined, the retry succeeds four days later, and the revenue lands after your dunning window has already closed.

Monitoring: shows you the retry succeeded.

Chargebee Observability: shows you why it took four days, which gateway stalled, which webhook retried late, and which step to fix so the next one doesn't slip past the window.

Frequently Asked Questions About Observability

Monitoring tells you that something broke. Observability tells you why, tracing a problem across the services, requests, and changes in your billing flow, so you move from "an alert fired" to "here's the root cause" before it reaches your customers.

Every team with a stake in billing. Engineering owns uptime and fast resolution, Finance and RevOps guard against revenue leakage and audit risk, and Support needs clear answers for customers. Observability gives them one trusted source of truth, so decisions are made on evidence instead of guesswork.

Chargebee turns billing into something you can watch and explain. You can search API, gateway, payment, webhook, and email logs, follow metrics and events, and trace any request end to end, each with status, latency, and a trace ID.

Yes. Chargebee emits standardized OpenTelemetry spans that stream into the tools you already run, such as New Relic, Datadog, Splunk, or Honeycomb, with no proprietary agent to install.

Each SDK call opens one client span named chargebee.{resource}.{operation}. When your telemetry adapter injects a W3C trace context, that span nests inside your existing traces; it also reuses the same span across retries and stays fail-safe so telemetry never breaks a call. See the industry-standard OpenTelemetry documentation and Chargebee's own OpenTelemetry integration docs.

It sits alongside. Chargebee isn't an APM and doesn't replace New Relic, Datadog, Splunk, or Honeycomb. It makes billing a first-class part of the observability you already run, feeding standardized spans and logs into whatever backend you already trust.

Chargebee's telemetry feeds directly into the centralized security tooling your team already governs, such as your SIEM or APM, so billing stays inside your existing controls and audit trail. And Chargebee continuously monitors its own platform health, with live availability published on the public status page so you can hold the service to its commitments.

Chargebee draws a clear ownership line between incidents under its control and those caused by third parties such as payment gateways. Real-time platform health and the status page separate Chargebee-controlled issues from vendor and PSP issues, so you can see who owns a problem and how it's being tracked.

No. A governed allowlist defines which attributes are safe to record, and PII and payment-sensitive fields never appear in span data. Sensitive request headers are excluded by default.

Observability is available on all Chargebee plans. Logs need no setup, they're already inside Chargebee. For distributed tracing, install the OpenTelemetry packages and configure your tracer, and Chargebee emits spans automatically.

Bill With Confidence You Can Prove

Every payment, invoice, and webhook stays traceable long after it happens, so when Finance asks what changed, you already have the answer, and the confidence to put your name on the numbers.