RevenueStory
Overview
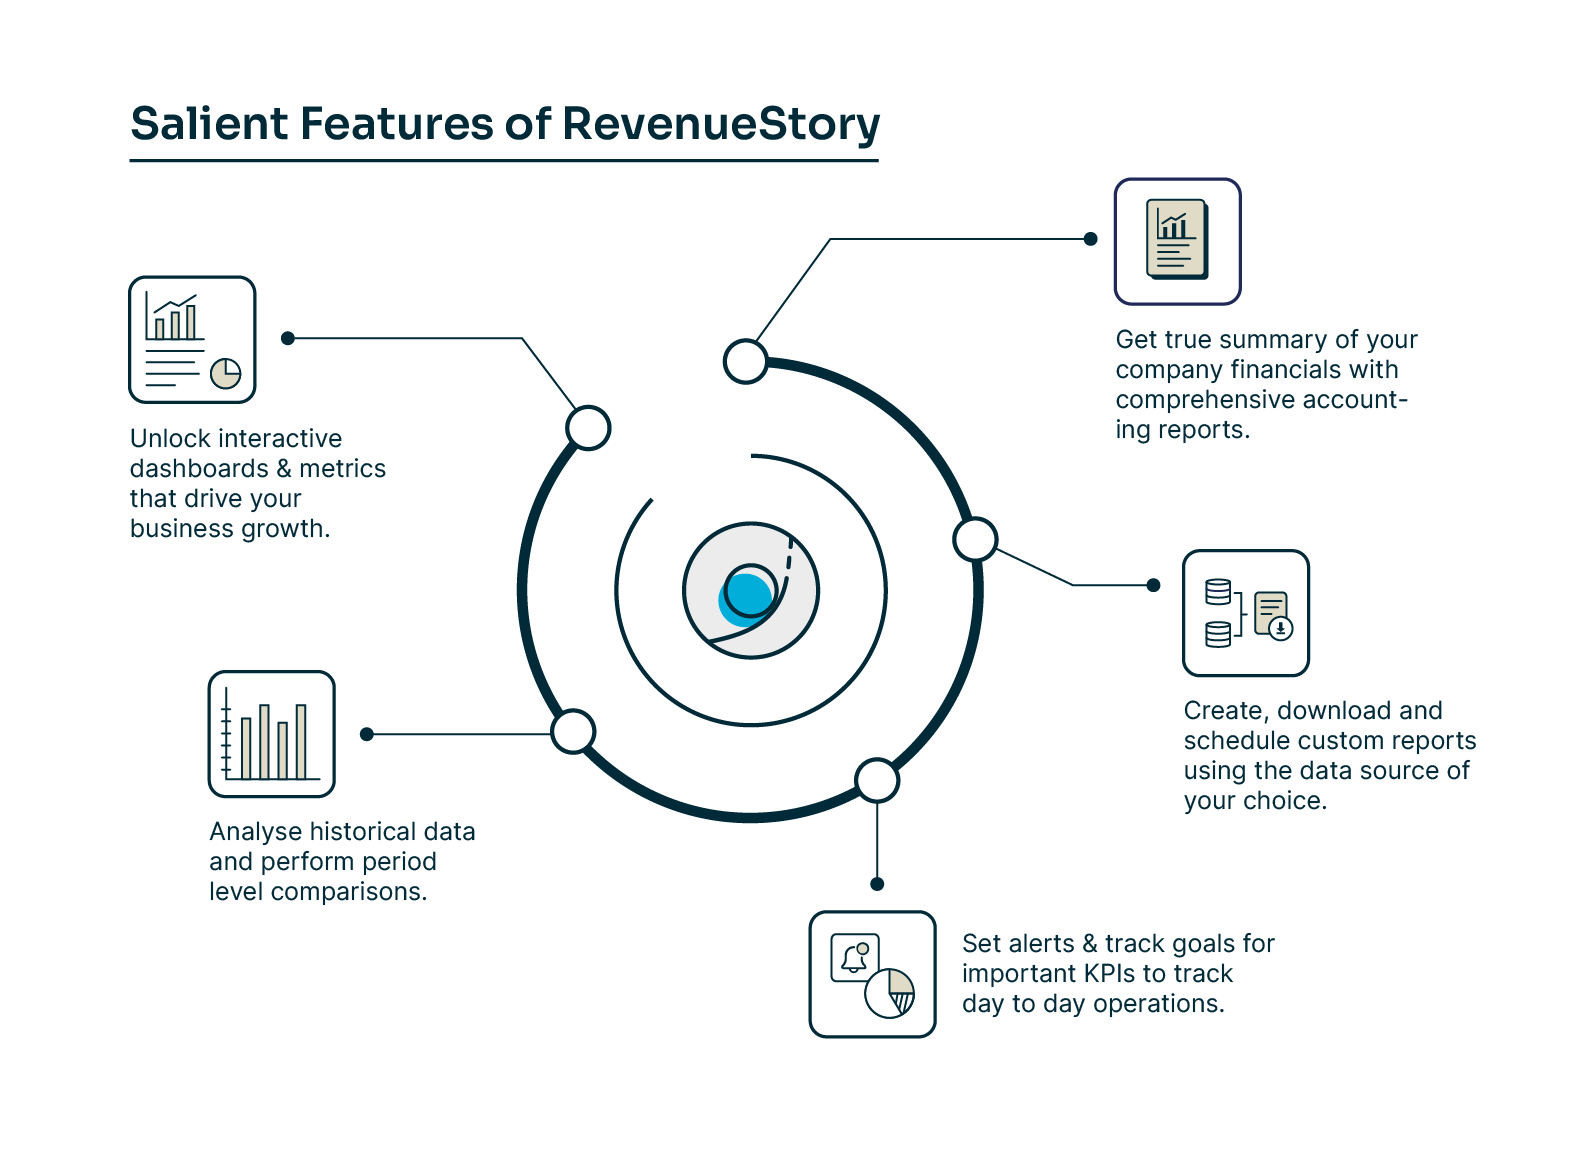
RevenueStory gives you a 360° business visibility on subscription analytics. It helps you identify the key performance indicators driving revenue, subscriptions, signups, activations, churn and a host of other metrics that you need to make effective decisions. RevenueStory associates your product metrics with revenue metrics and customer behavior thereby facilitating the growth of your business.
The RevenueStory module has more than 150+ ready-made reports that helps you derive actionable insights on new sales, payments collected, monthly recurring revenue (MRR), activations, churn and so on. You can access these reports from the RevenueStory tab.
Note
- To know more about the availability of this feature, visit our plans and pricing page.
Dashboards
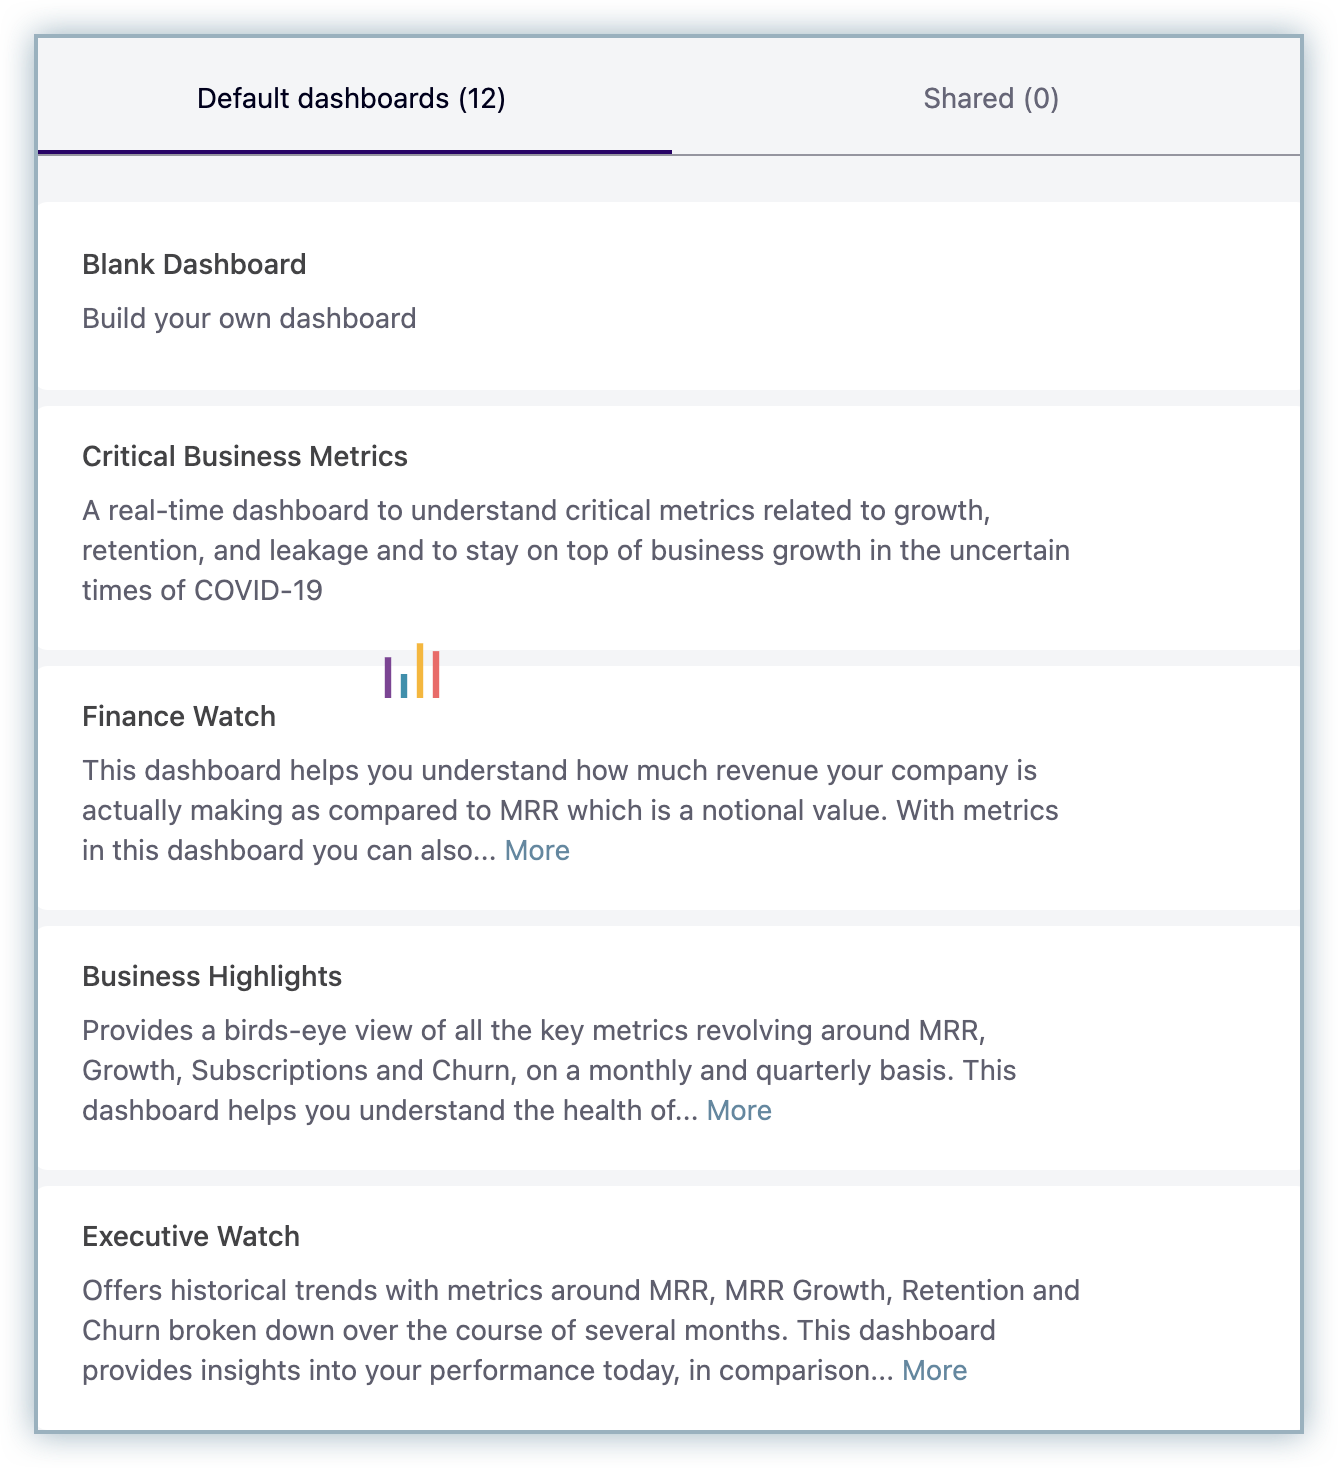
Dashboards provide a consolidated way to view all your reports and key performance indicators in a single page. RevenueStory has 10 default dashboards that will help you derive actionable insights. They are:
Critical Business Metrics: A real-time dashboard to understand critical metrics related to growth, retention, and leakage and to stay on top of business growth.
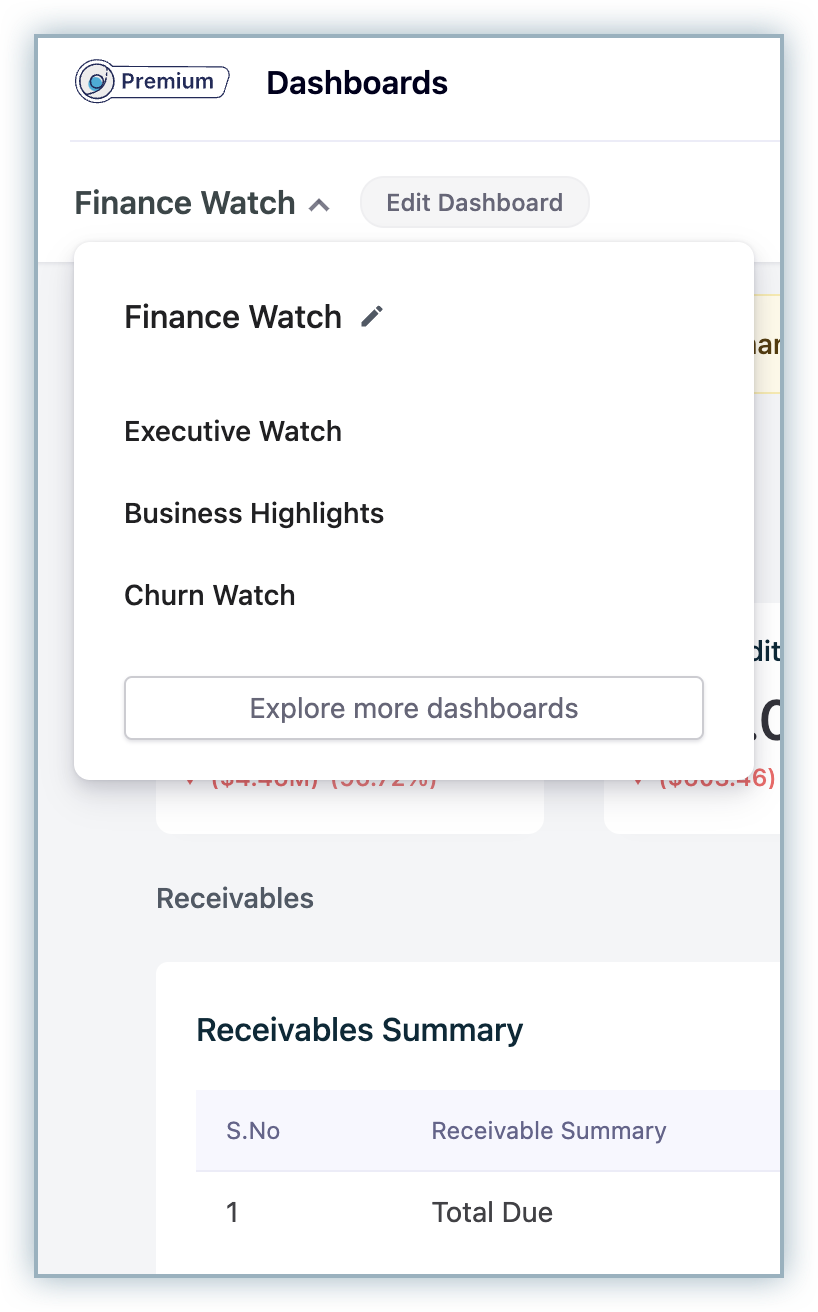
Finance Watch: This dashboard helps you understand how much revenue your company is actually making as compared to monthly recurring revenue (MRR) which is a notional value. By using the metrics in this dashboard you can also get visibility into your cashflow, payments and refunds, and credit card expiry.
Business Highlights: Provides a birds-eye view of all the key metrics revolving around MRR, growth, subscriptions and churn, on a monthly and quarterly basis. This dashboard helps you understand the health of your business and see if you are on track.
Executive Watch: You can view historical trends with metrics around MRR, MRR growth, retention and Churn broken down over the course of several months. This dashboard provides insights into your performance today, in comparison with the same metrics from the previous month. Use this for a detailed view of your growth for stakeholders and investors.
Marketing Watch: This dashboard displays the metrics that impact the top of the funnel, like signups, activations, and new revenue. This dashboard also includes insights about more long-term activities like subscription retention and MRR growth cohorts, and net dollar expansion that allow marketing teams to see the impact of their acquisition strategies over a longer time frame, and identify emerging markets.
Sales Watch: Consists of top revenue metrics like New MRR, Expansion MRR, Upgrade MRR, and ARR, segmented by plans, geographical territories and verticals. This dashboard allows the Sales team to identify which industries, geographies, plans and even sales reps contribute to the most revenue.
Customer Success Watch: You can use this dashboard to monitor and track your customer success initiatives. It displays the subscription and revenue churn, upgrade and downgrade MRR, net churn rate and a cohort view of customer churn, in addition to a time-based breakdown of when customers churn.
Monthly Watch: It displays all the components that affect your MRR on a month-on-month basis, like New MRR, MRR from free to paid conversions, expansions, and the loss of revenue due to Cancellations, Downgrades, and Scheduled Cancellations. This dashboard also gives you an insight into your Metered Charges, LTV and CAC, and monthly churn both in terms of customer count and lost dollar value.
Subscription Watch: Shows a collection of all the core KPIs to provide a holistic perspective into your subscription lifecycle, like signups, activations, churn, and so on. Use this dashboard to understand how your business metrics have evolved on a weekly or monthly basis. This dashboard is useful when you have to compare the dynamic and long-term trends in your subscriptions simultaneously.
Churn Watch: This dashboard displays all the metrics and trends you need to track with respect to churn.
Weekly Watch: Shows the more dynamic KPIs that you would need to track on a week-on-week basis, like signups, activations, MRR addition, and churn. This dashboard shows if you are on the right track to meeting your monthly targets.
You can view any of default dashboards by clicking on them. If you wish to import these dashboards and make changes to them, click Save. These dashboards can be customized at a user level. You can add or delete a metric in these dashboards. The changes that you make here will be visible only for you.
Creating a new dashboard
In addition to the 10 default dashboards, you can create a blank dashboard and add the metrics you want. The dashboards that you create will be visible only to you, by default.
If you'd like your colleagues to view the dashboards that you create, you can share it with them. Users who have access to RevenueStory (Admin, Owners and Finance Executives) will only be able to view them.
To create your own dashboard:
-
Click RevenueStory > Dashboards
-
Select Explore more dashboards from the toggle
-
Select Blank Dashboard
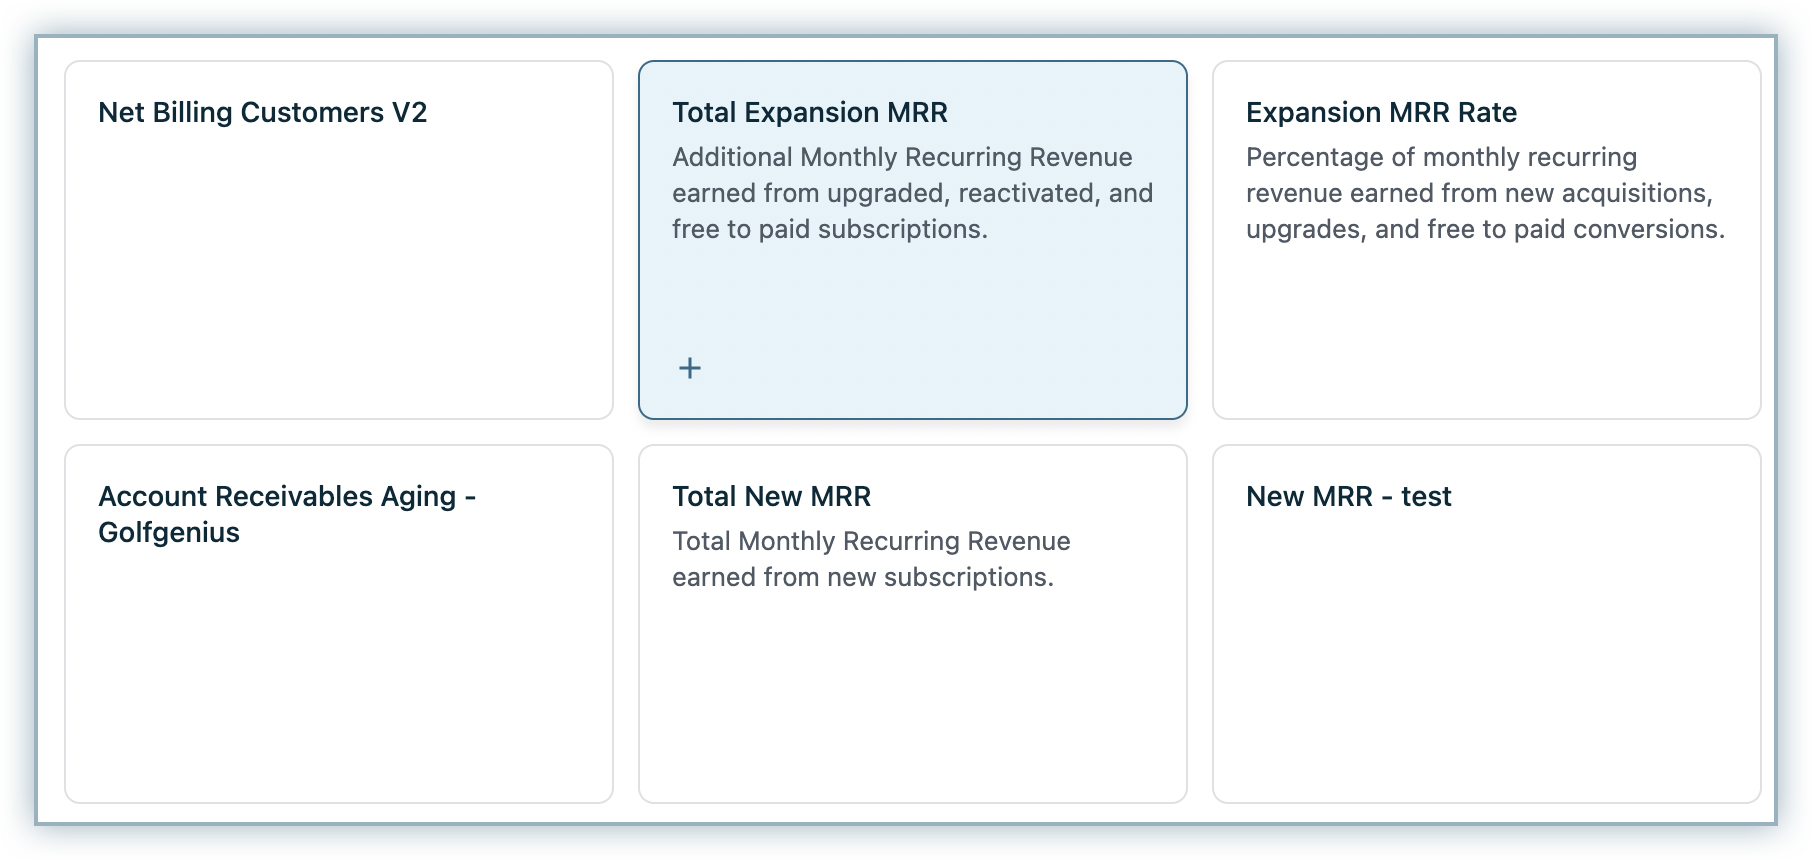
Adding metrics to a dashboard
Chargebee has various in-built metrics that you can add to your dashboard. These metrics are available in the form of a KPI, Chart, Table or a Cohort.
To view the complete list of metrics, click RevenueStory > Reports Explorer.
Update as of May 12, 2023, certain report names and their descriptions have been updated for easier search and discovery. Please refer to the link to review the old and new names and descriptions.
The metrics that you can add are grouped into the following categories:
- Acquisitions
- Billing and Taxes
- Churn
- Collections
- Customer
- Leakage
- Order
- Premium
- Receivable
- Recurring Revenue
- Subscriptions
- Transactions
You can choose to add a metric from the dashboard settings or from the Reports Explorer.
To add a metric to your dashboard:
-
Open the dashboard
-
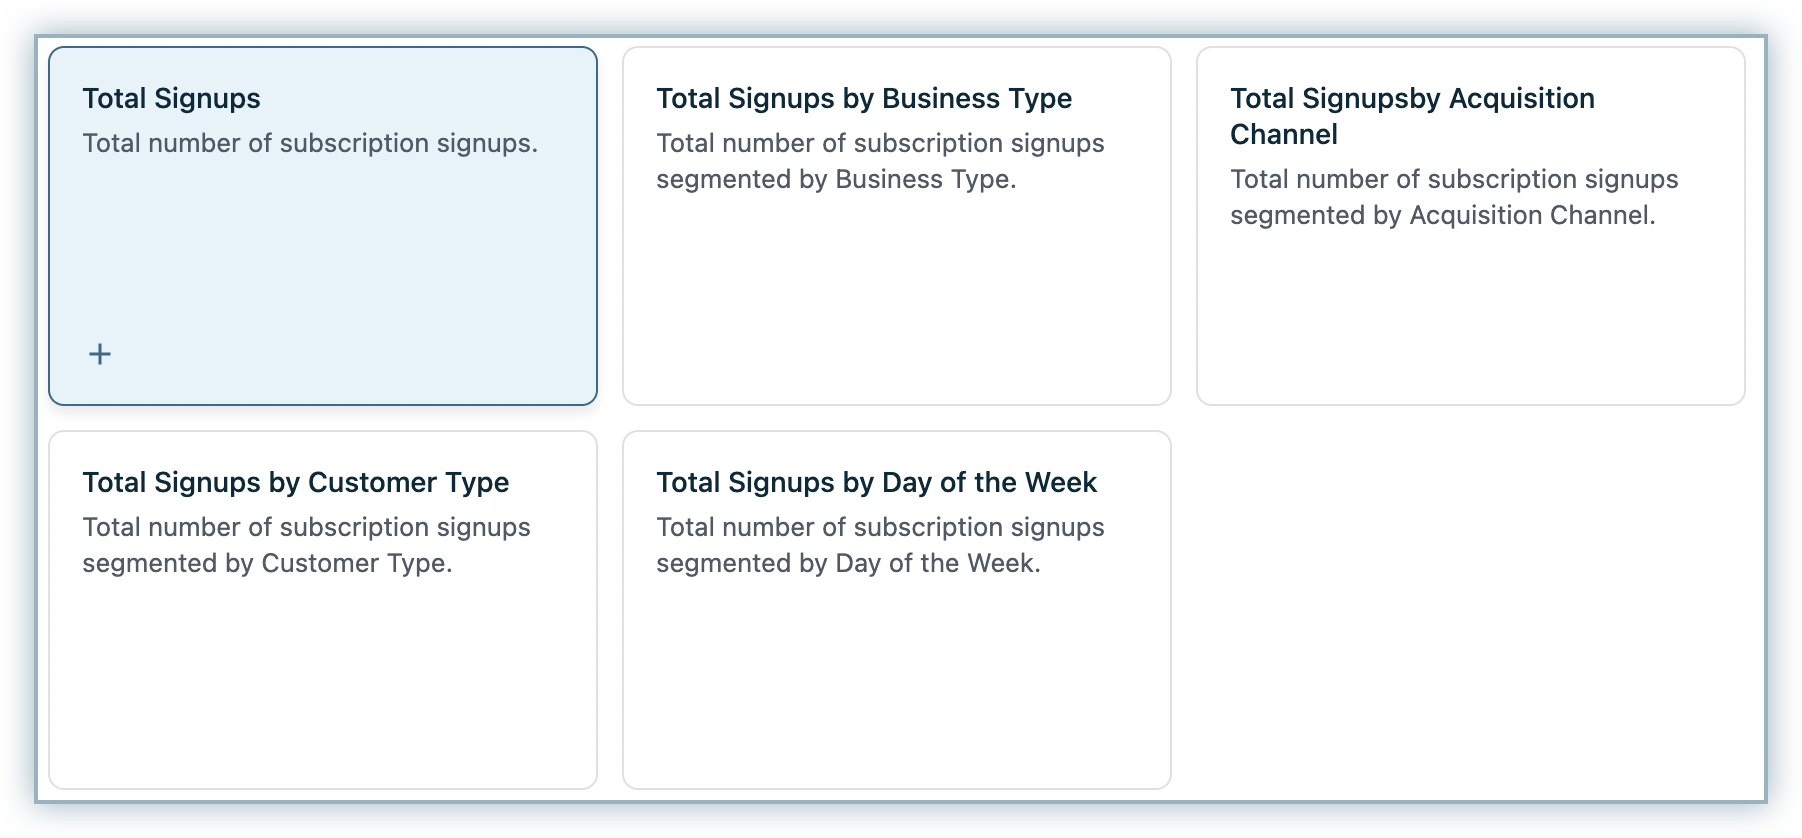
Click Add Metric and you will be taken to the Reports Explorer page.
-
Select the metric that you want to add from the Reports Explorer and select Add to Dashboard to add it to your dashboard of interest.
-
Choose the time period for the KPI/Chart that you want to add.
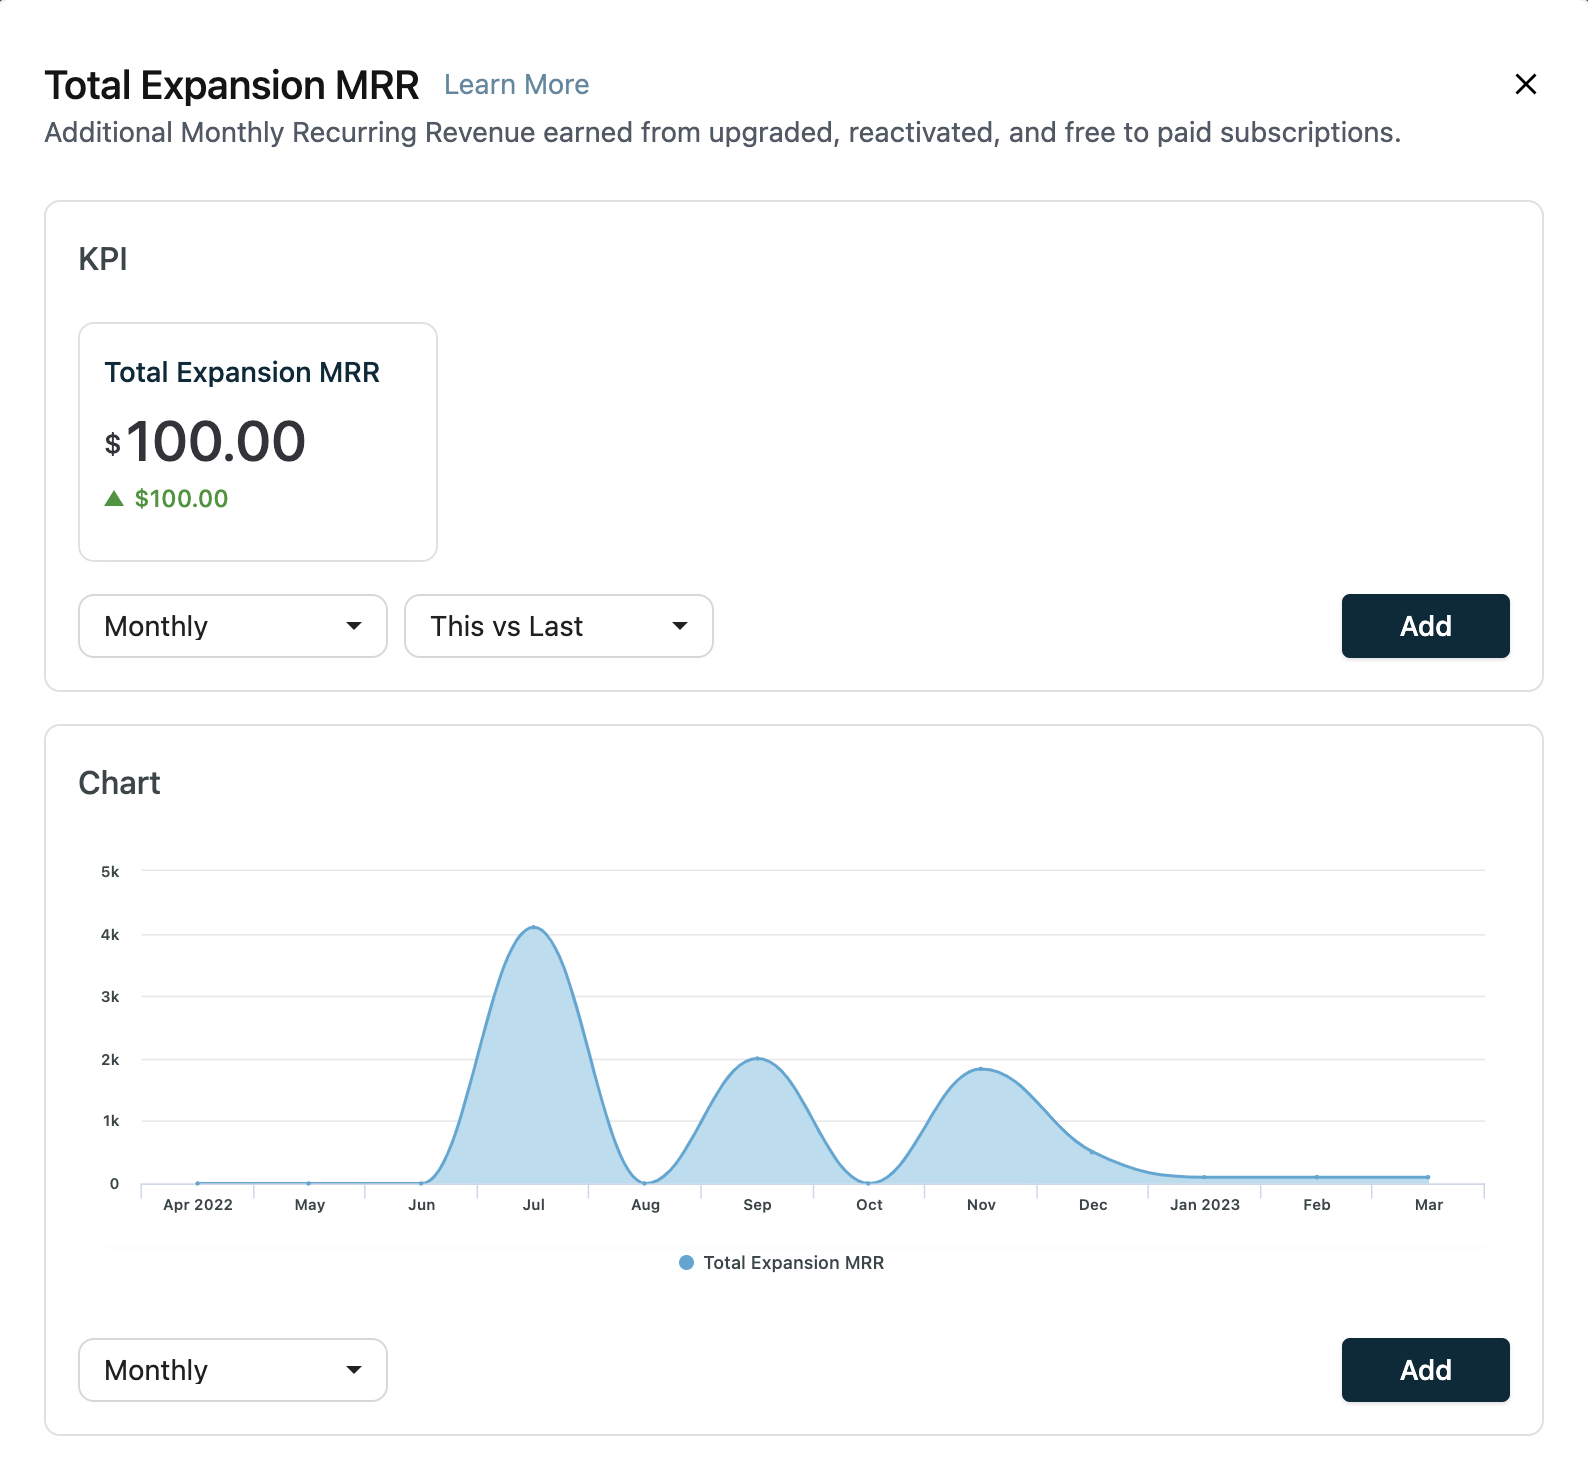
-
Click Add
The metric is added to the dashboard. You can re-position the metric by dragging and dropping it. Click here to view Chargebee's metric manual.
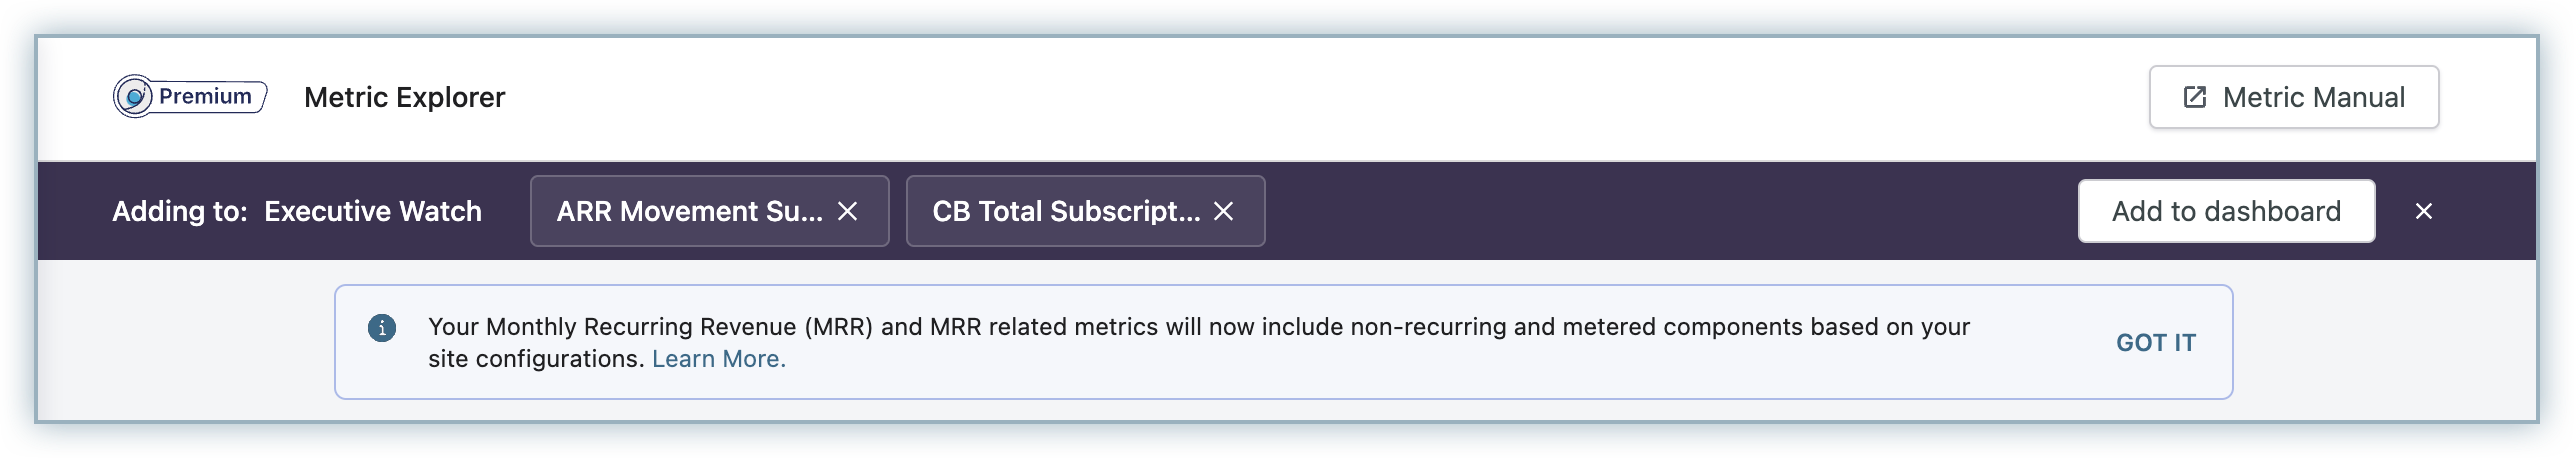
Alternatively, you can select and add the metric that you want into your dashboard from the Reports Explorer tab.
To do this:
- Click RevenueStory > Reports Explorer
- Select the Metric
- Choose the time period for the KPI/Chart that you want to add.
- Click Add
You can select any number of metrics that you want to add. Once done, click Add to dashboard.
Metric description page provides an overview of the key out of the box reports available within Chargebee to help you quickly understand and optimize your subscription business performance. It includes detailed descriptions and calculation logics of essential business metrics such as Monthly Recurring Revenue (MRR), Annual Recurring Revenue (ARR), Average Revenue Per Account (ARPA), and Lifetime value of a paid subscription (LTV) etc. It also includes guidance on calculating and interpreting these metrics and best practices for using them to drive business growth.
Overall, the page is an essential resource for anyone looking to understand their subscription business revenue better. Whether you are a startup looking to scale your business, or an established company seeking to optimize your revenue streams, the metric descriptions provides the insights and guidance you need to succeed.
Working with dashboards
Chargebee offers a wide range of interactive options for the dashboards. You can apply filters, share, and download underlying data.
Applying Filters: You can filter your dashboard using the fields from Customer, Subscription or Product resources.
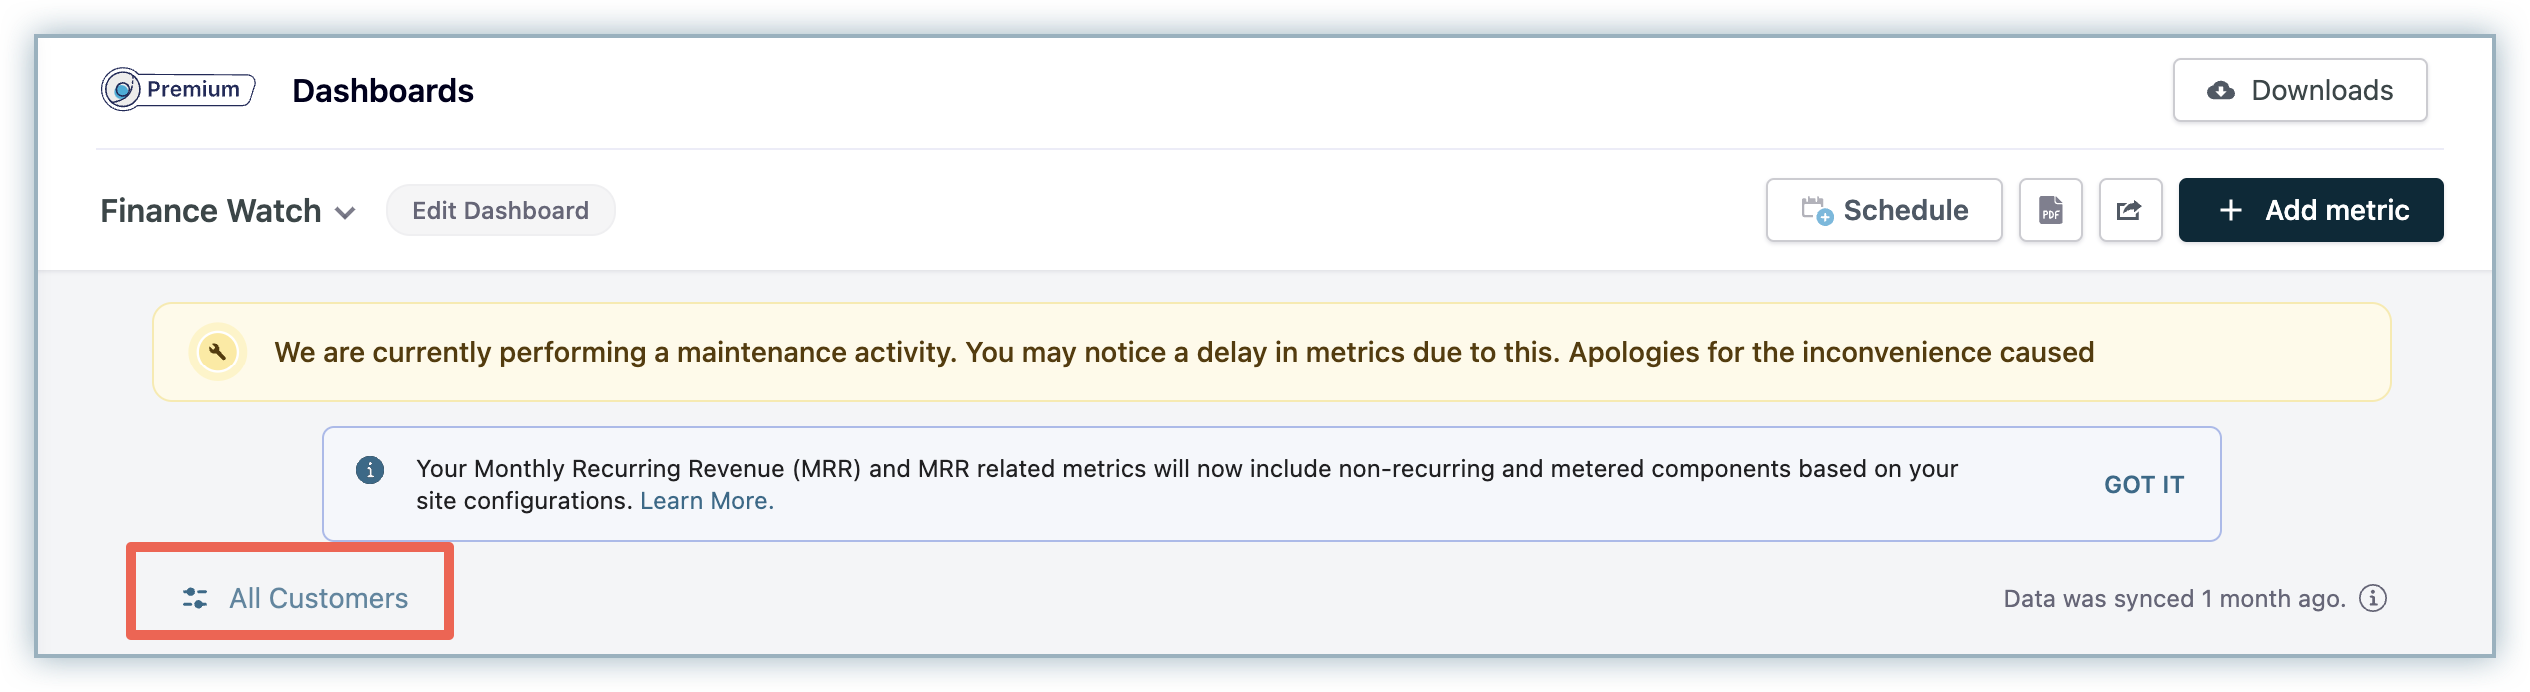
To filter your dashboard:
- Click the filter icon.
- Select the Resource and the corresponding field.
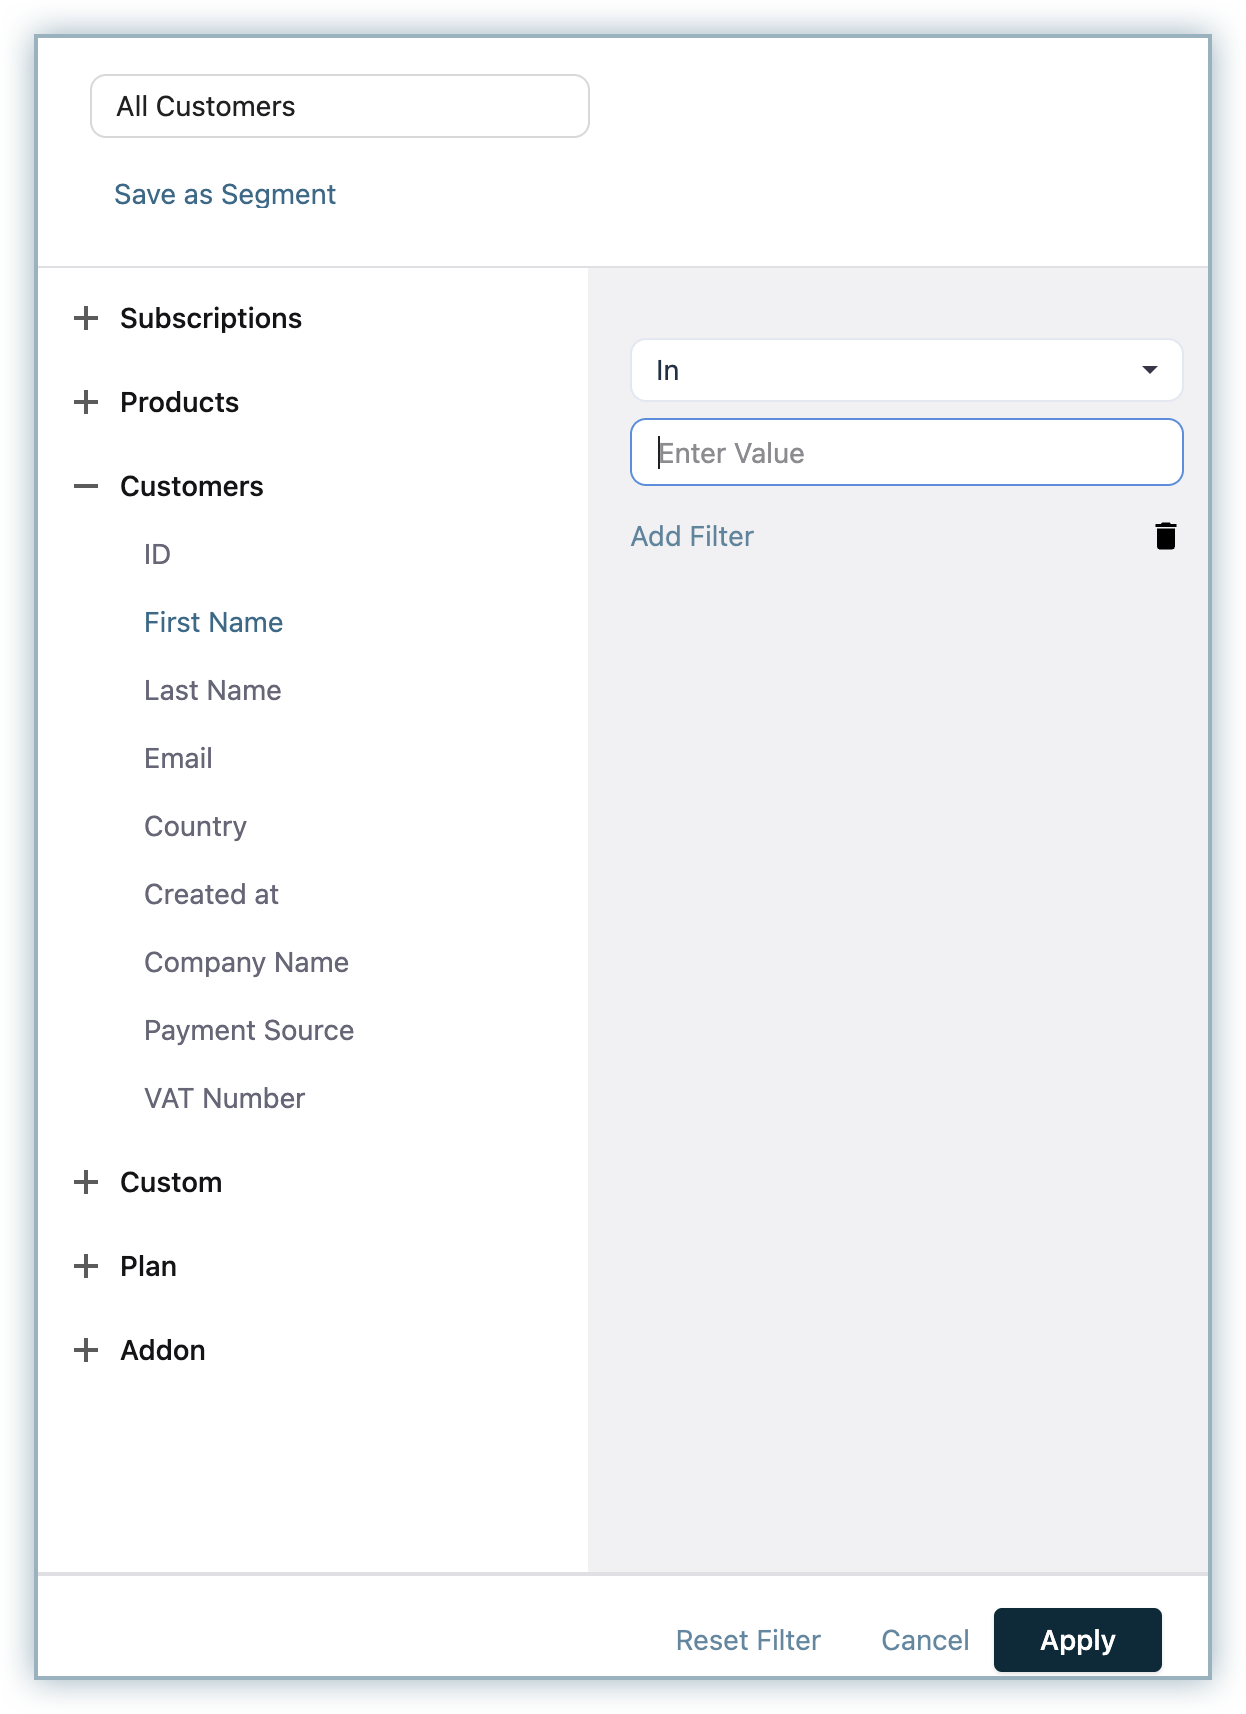
- Select the filter criteria and click Add Filter.
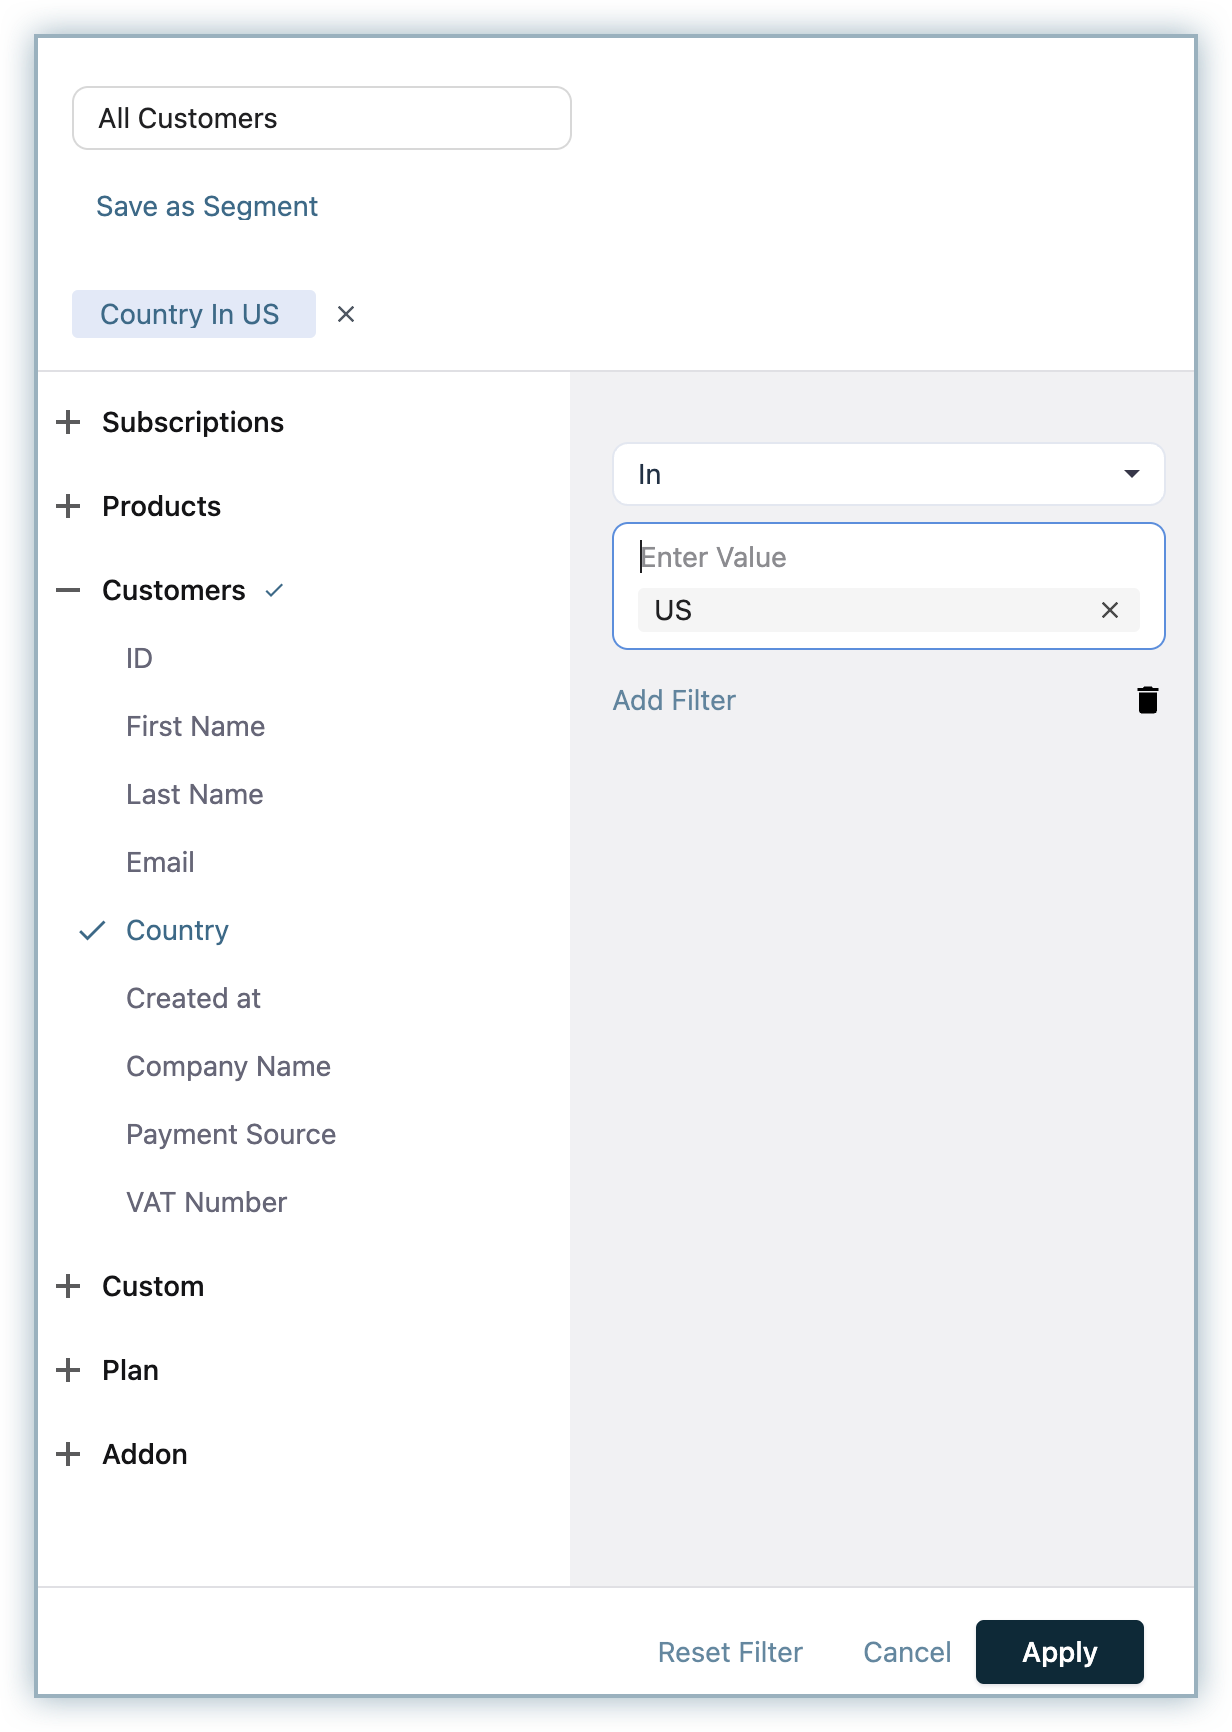
- After adding all the intended filters, click Apply.
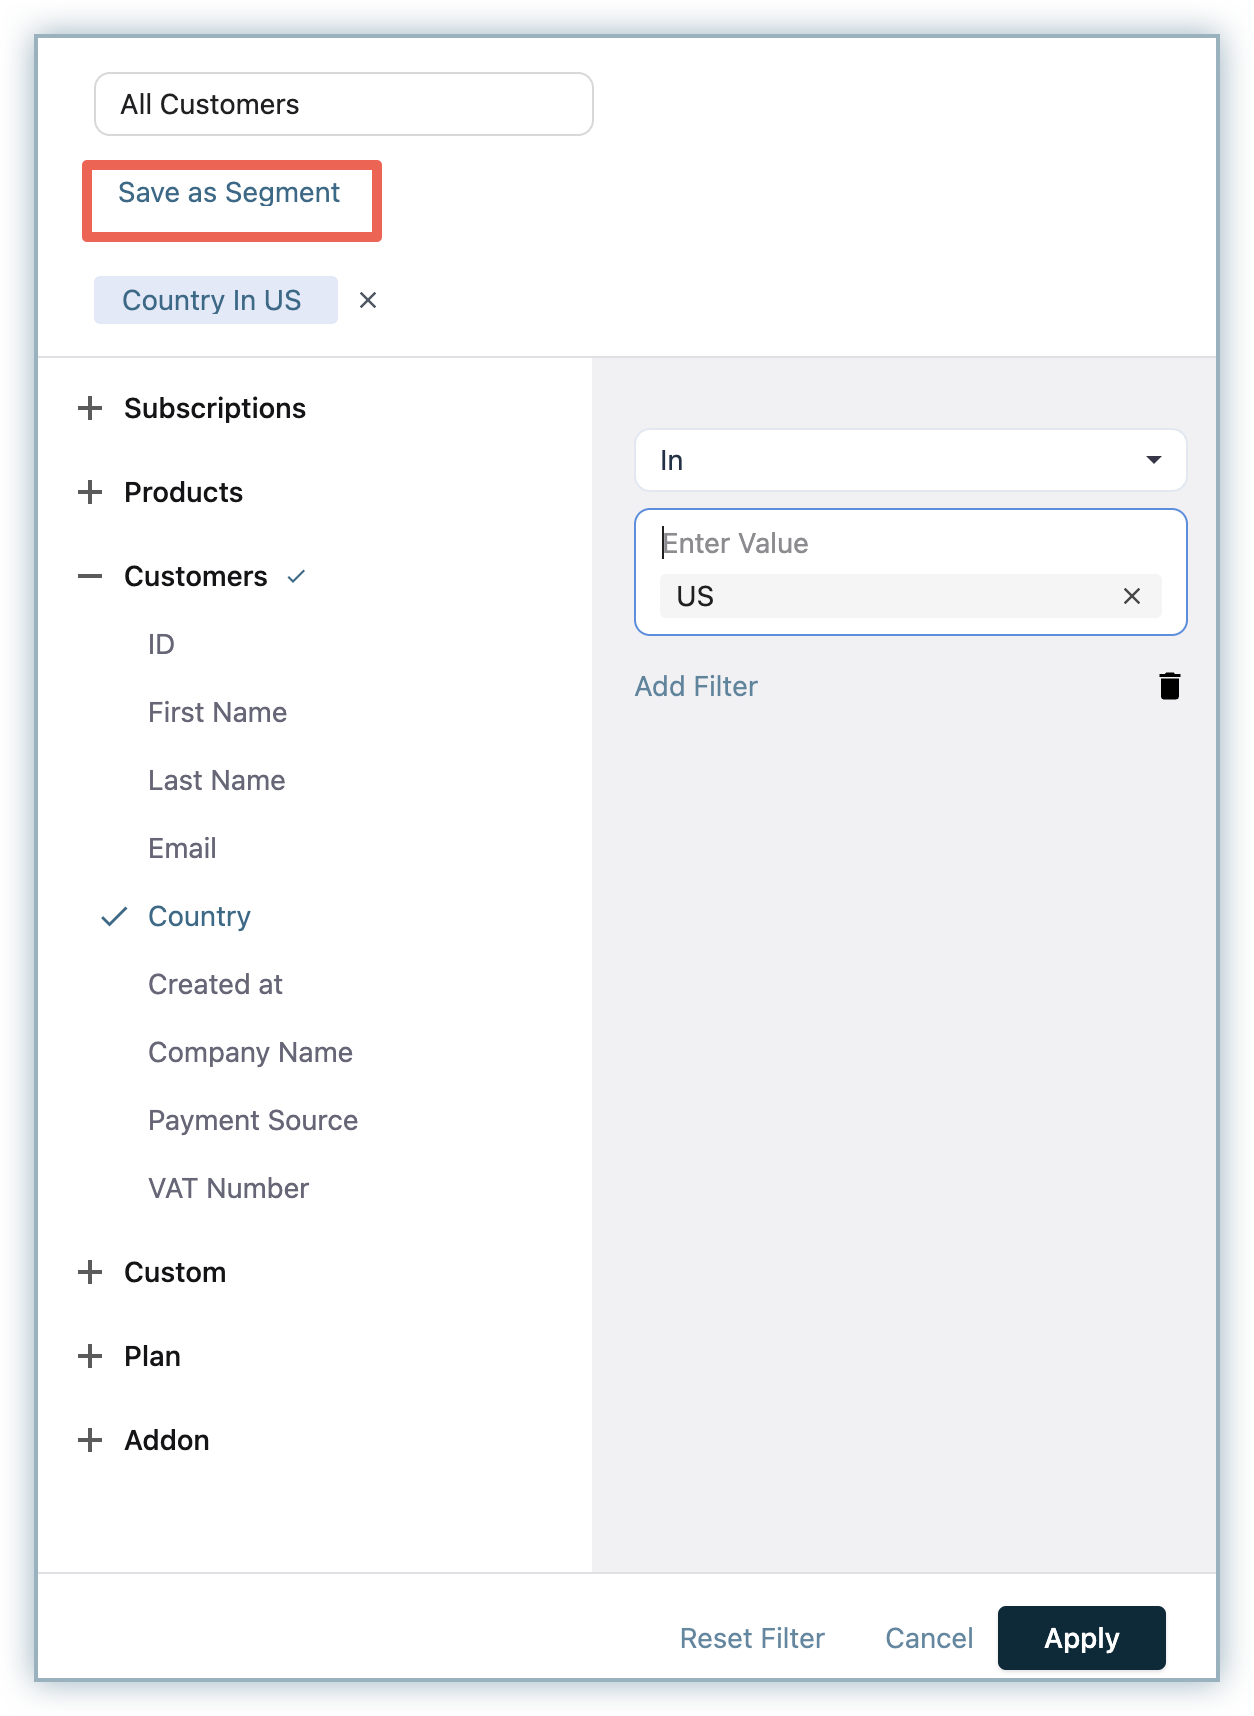
The filters will get instantly applied to the dashboard. If you want to save these filters for future use, click Save as Segment.
Email scheduling
You can use the Scheduling option to email the dashboard to your users automatically on a regular basis.
If you are a Premium user, you can set unlimited schedules. If you are not a Premium user, you can schedule a maximum of 3 dashboards per site.
Note
The schedule option is not available on test sites that don't have a data source on RevenueStory.
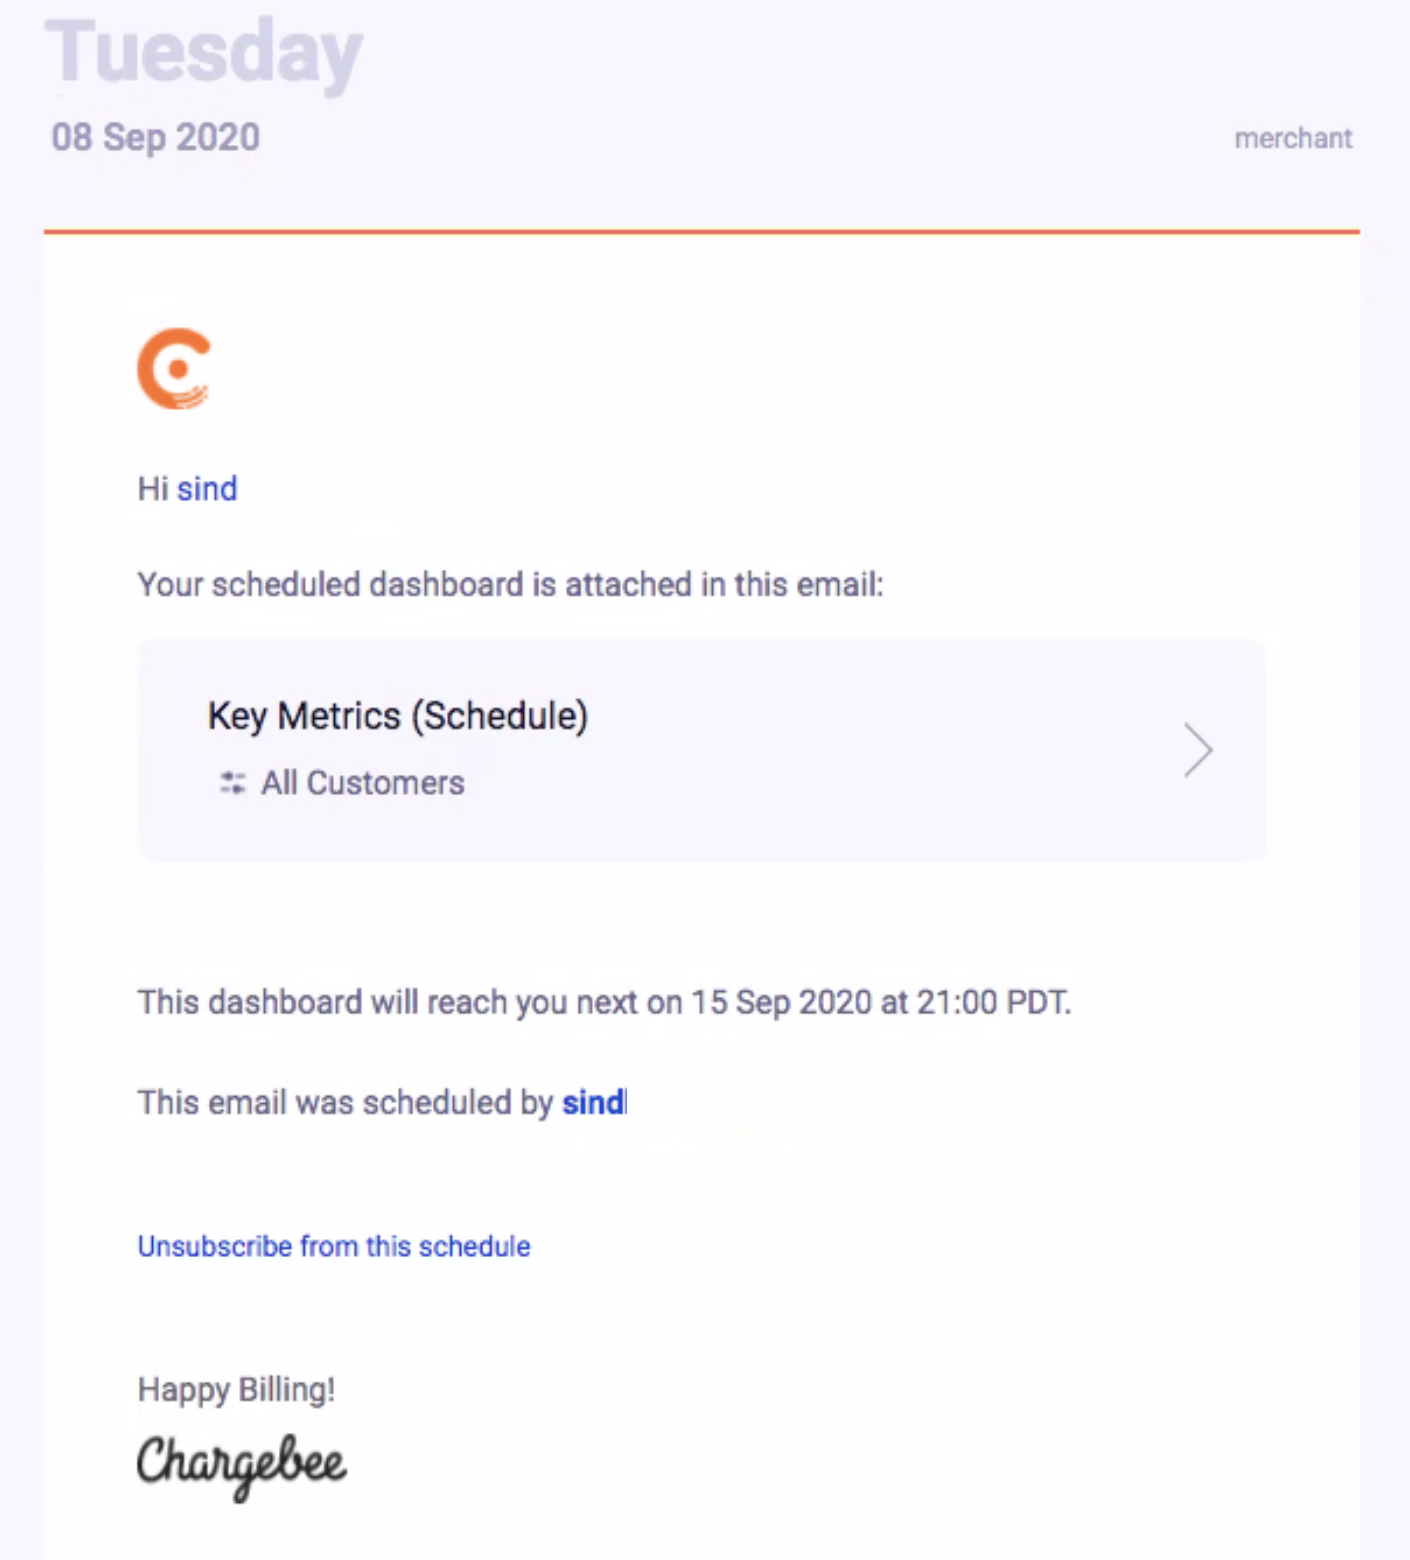
Your users will receive an email with a PDF attachment.
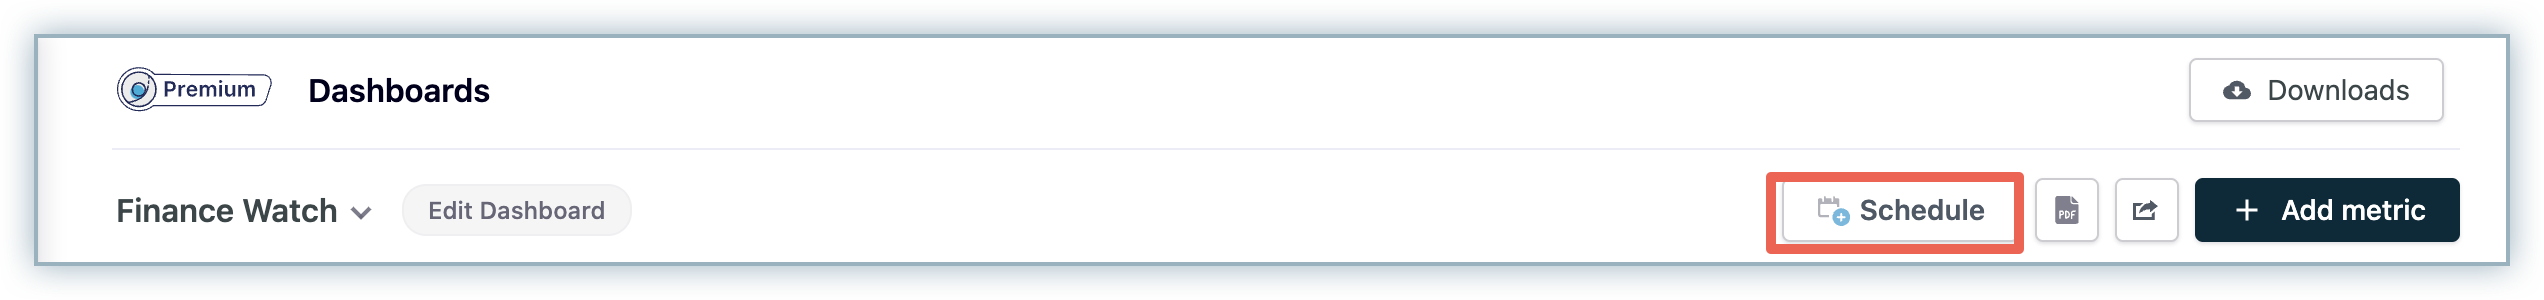
To schedule a dashboard,
- Select the dashboard that you wish to schedule and click Schedule.
- Select the segment from the drop-down.
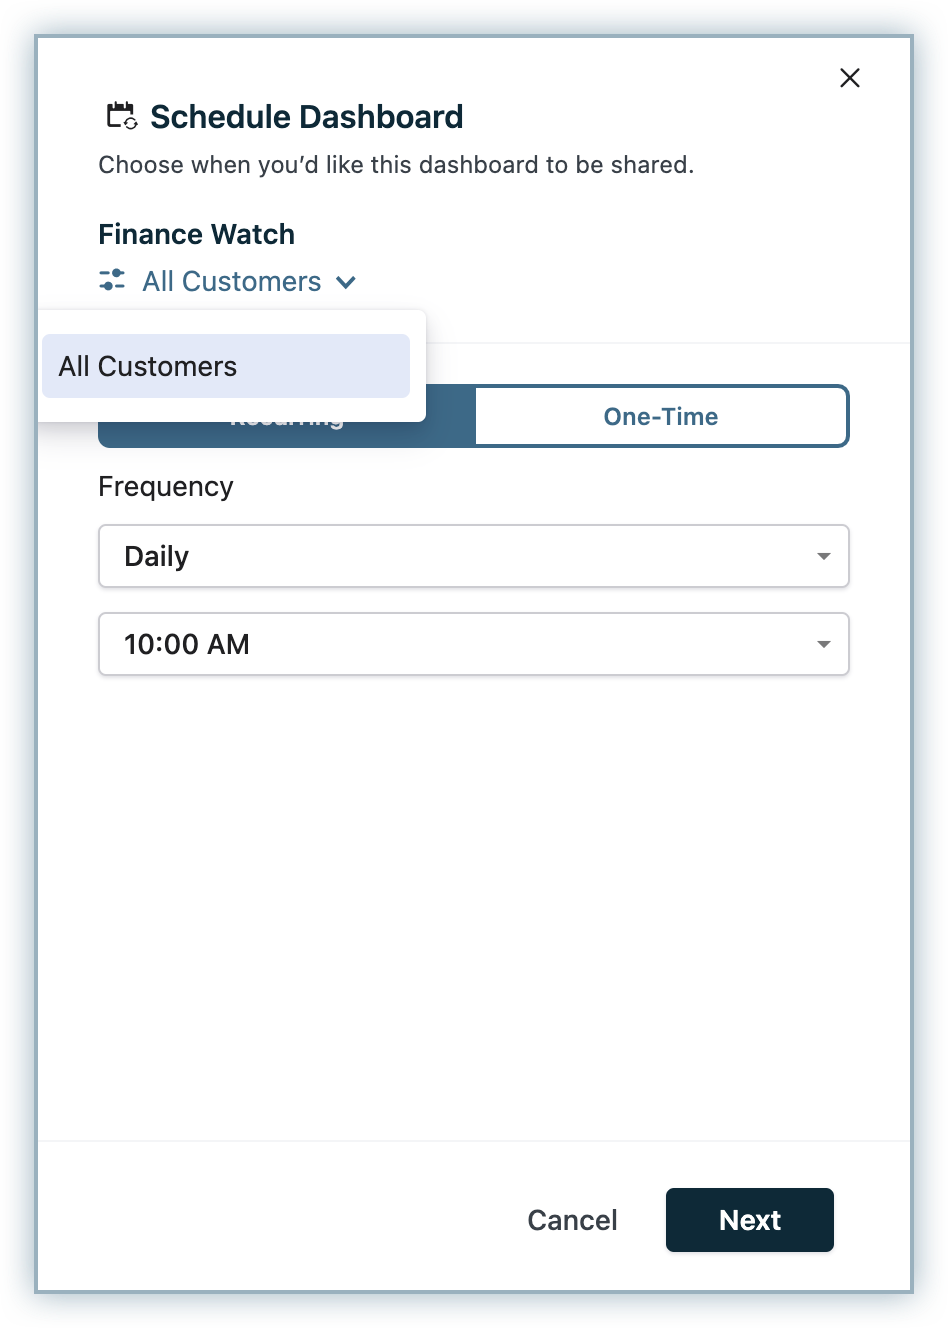
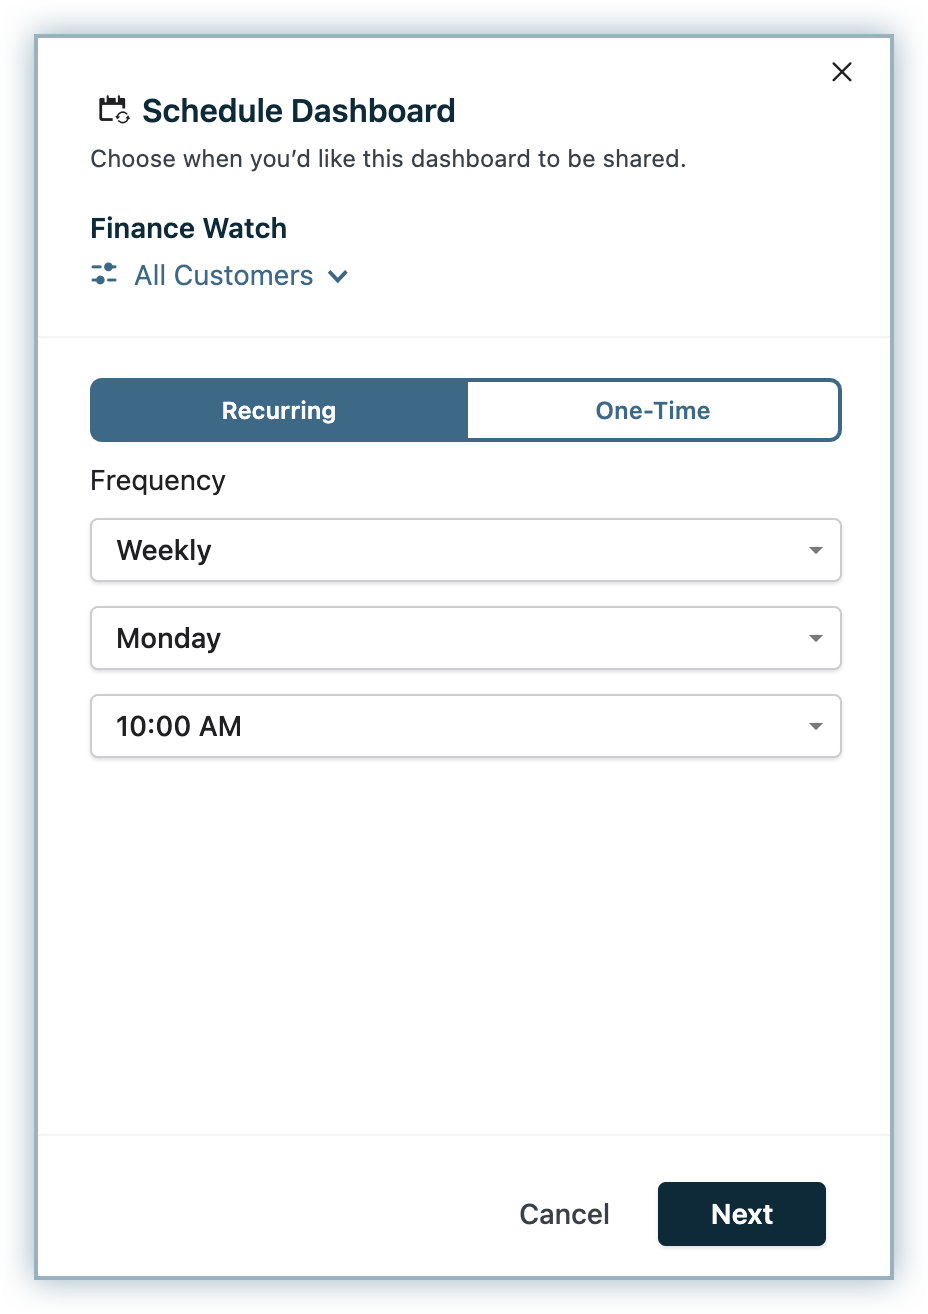
- Select how often you would like to send the email. You can choose to email the dashboard on a recurring basis or do it one time. In case you select Recurring, enter the Frequency. Click Next
- Select the Users. You can choose to select individual Users added to your Chargebee site or click the Roles tab and select a particular role. When you select a role, the email is sent to all the users assigned to that role.
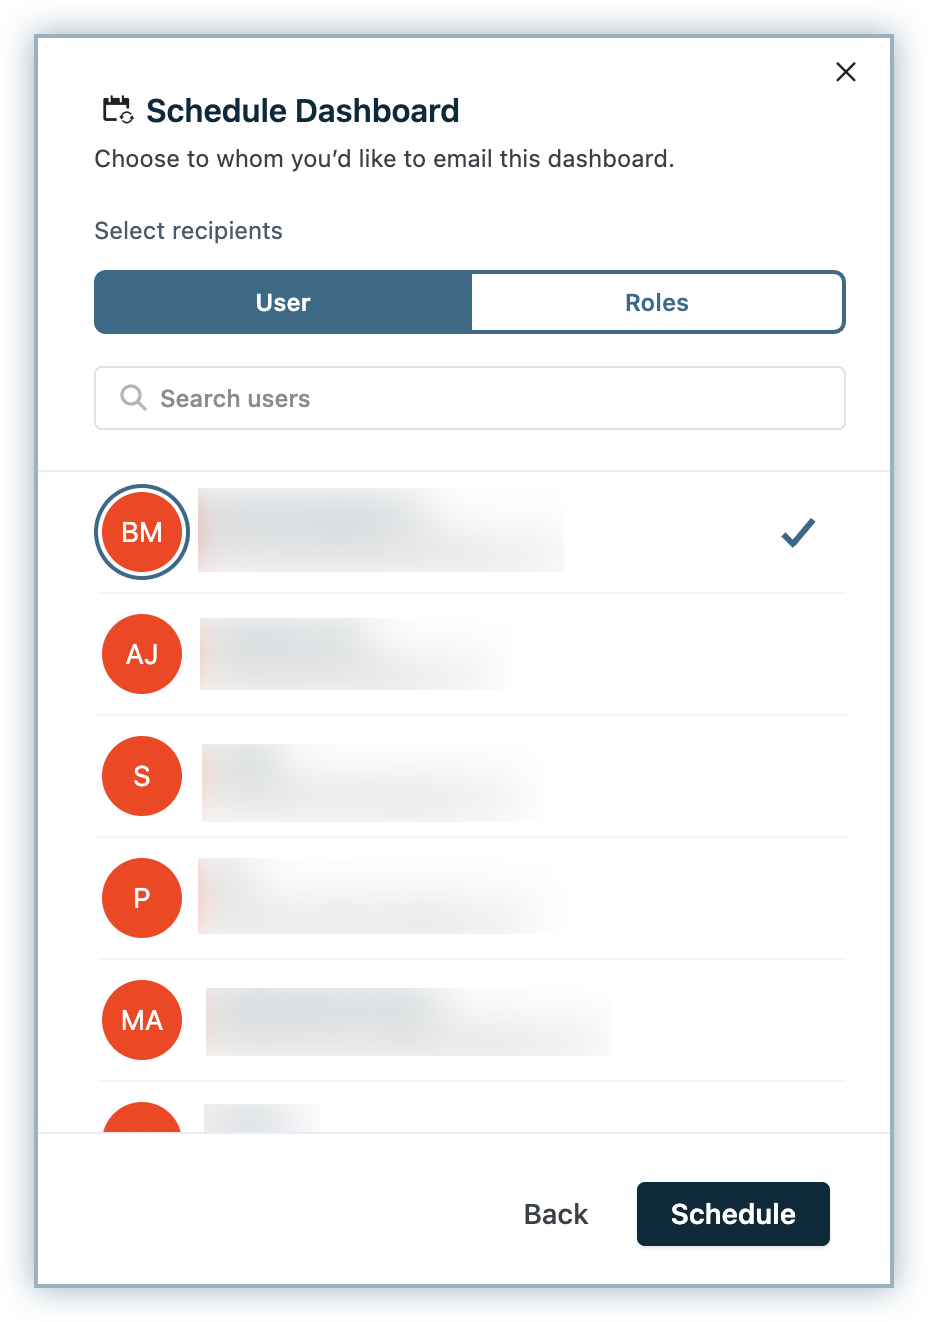
- Click Schedule.
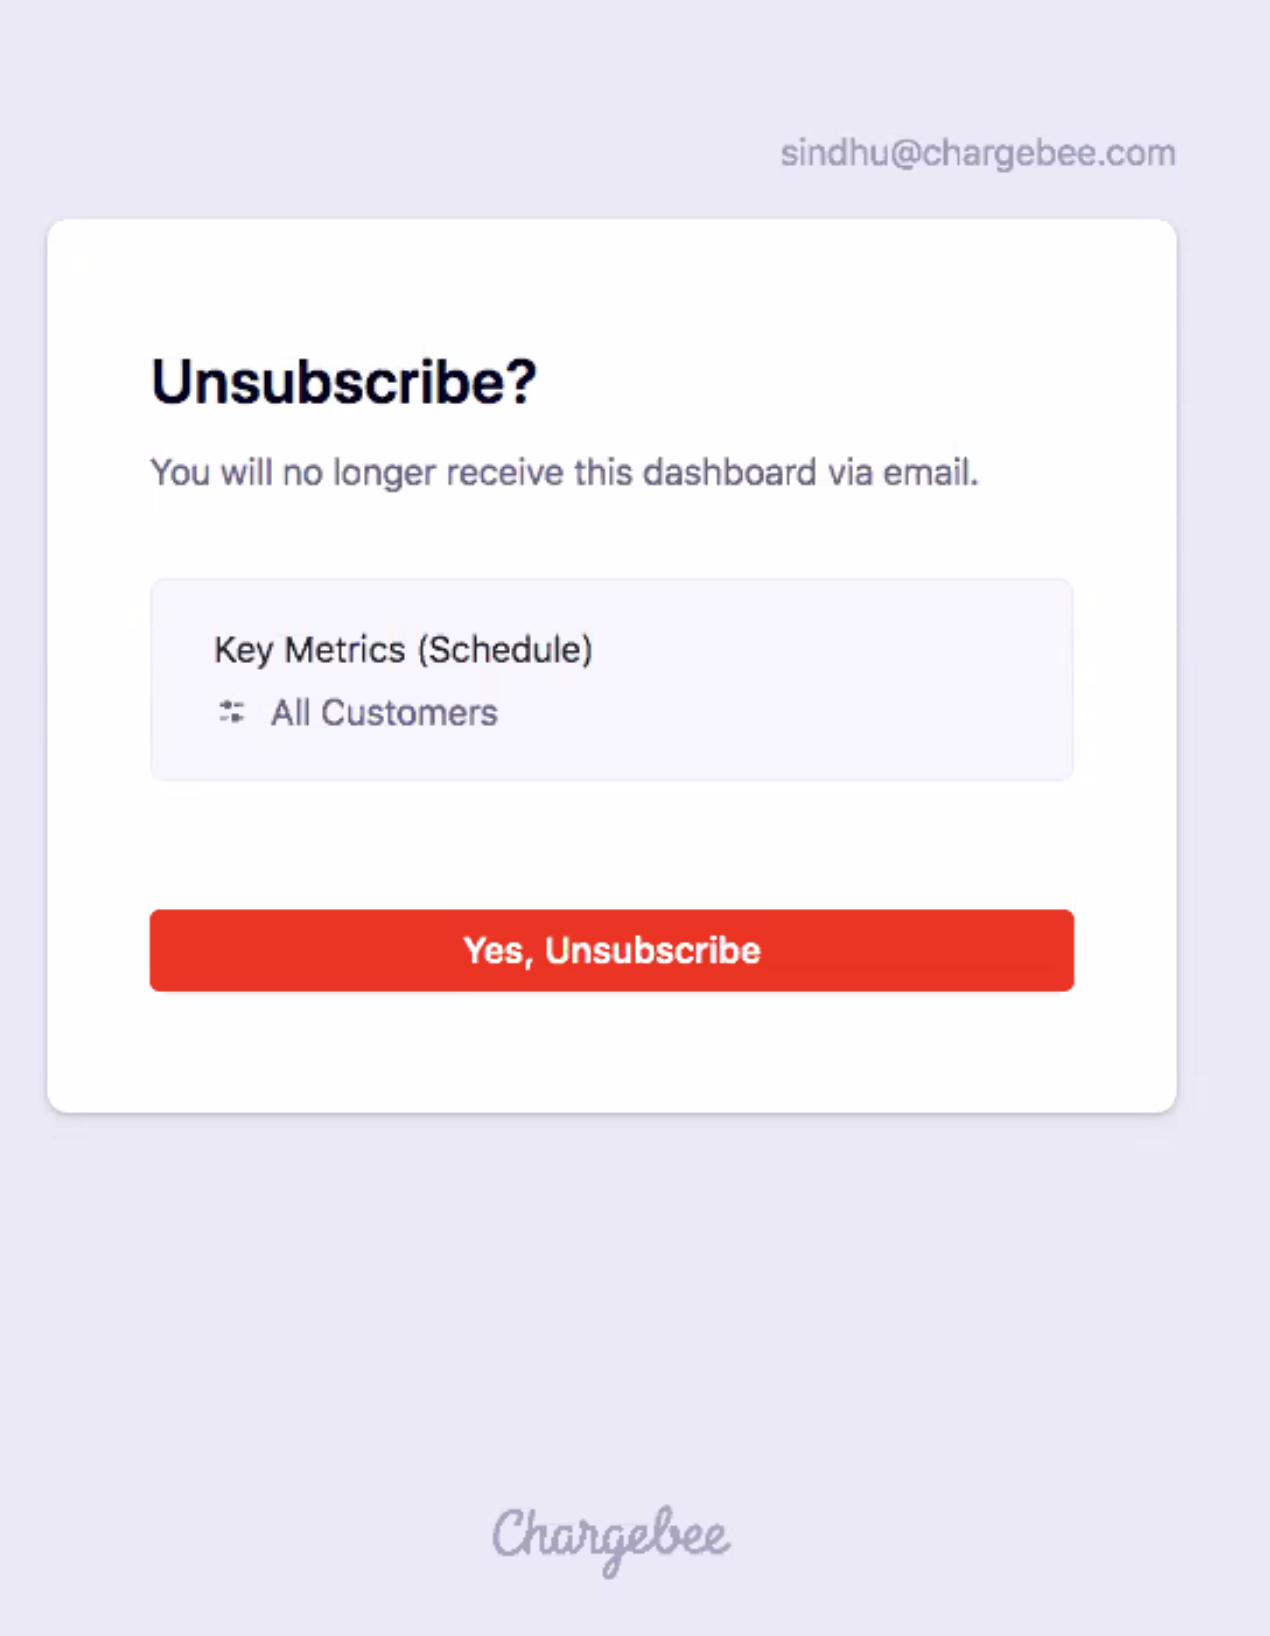
Users can unsubscribe to the dashboard by selecting the Unsubscribe option in the email.
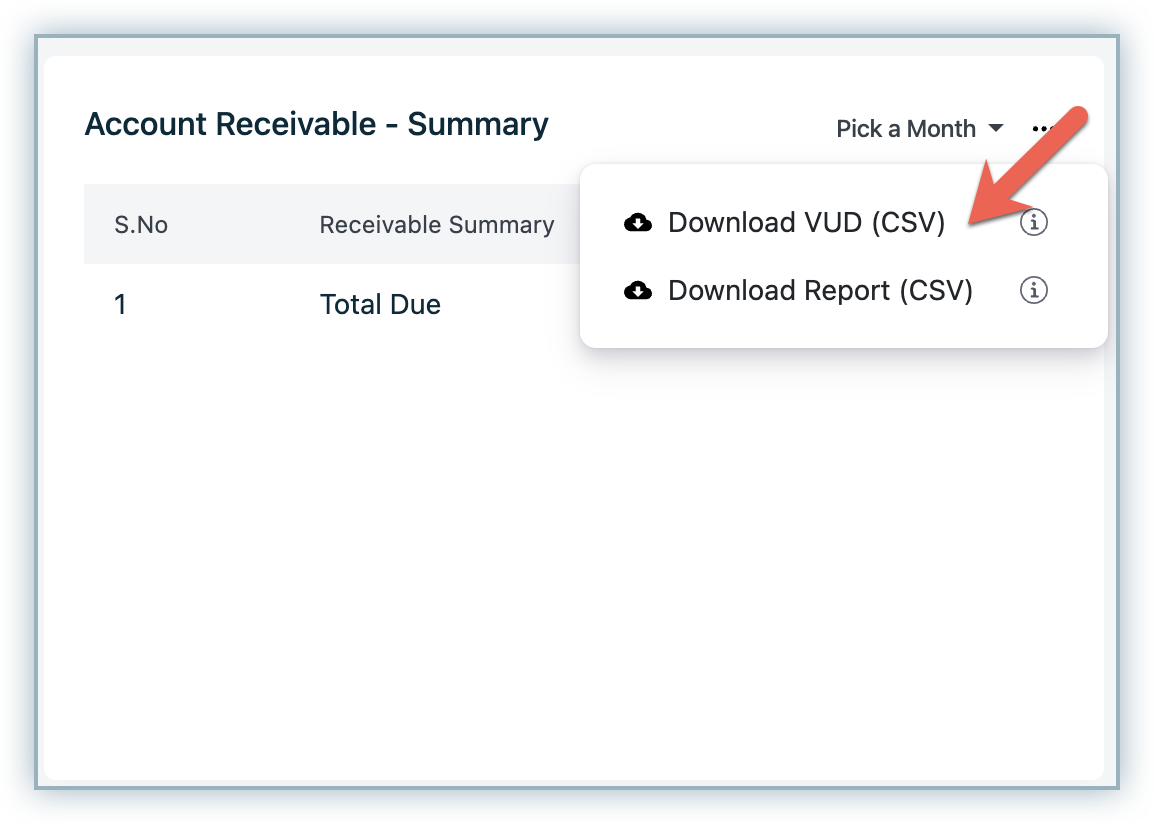
Downloading and viewing underlying data
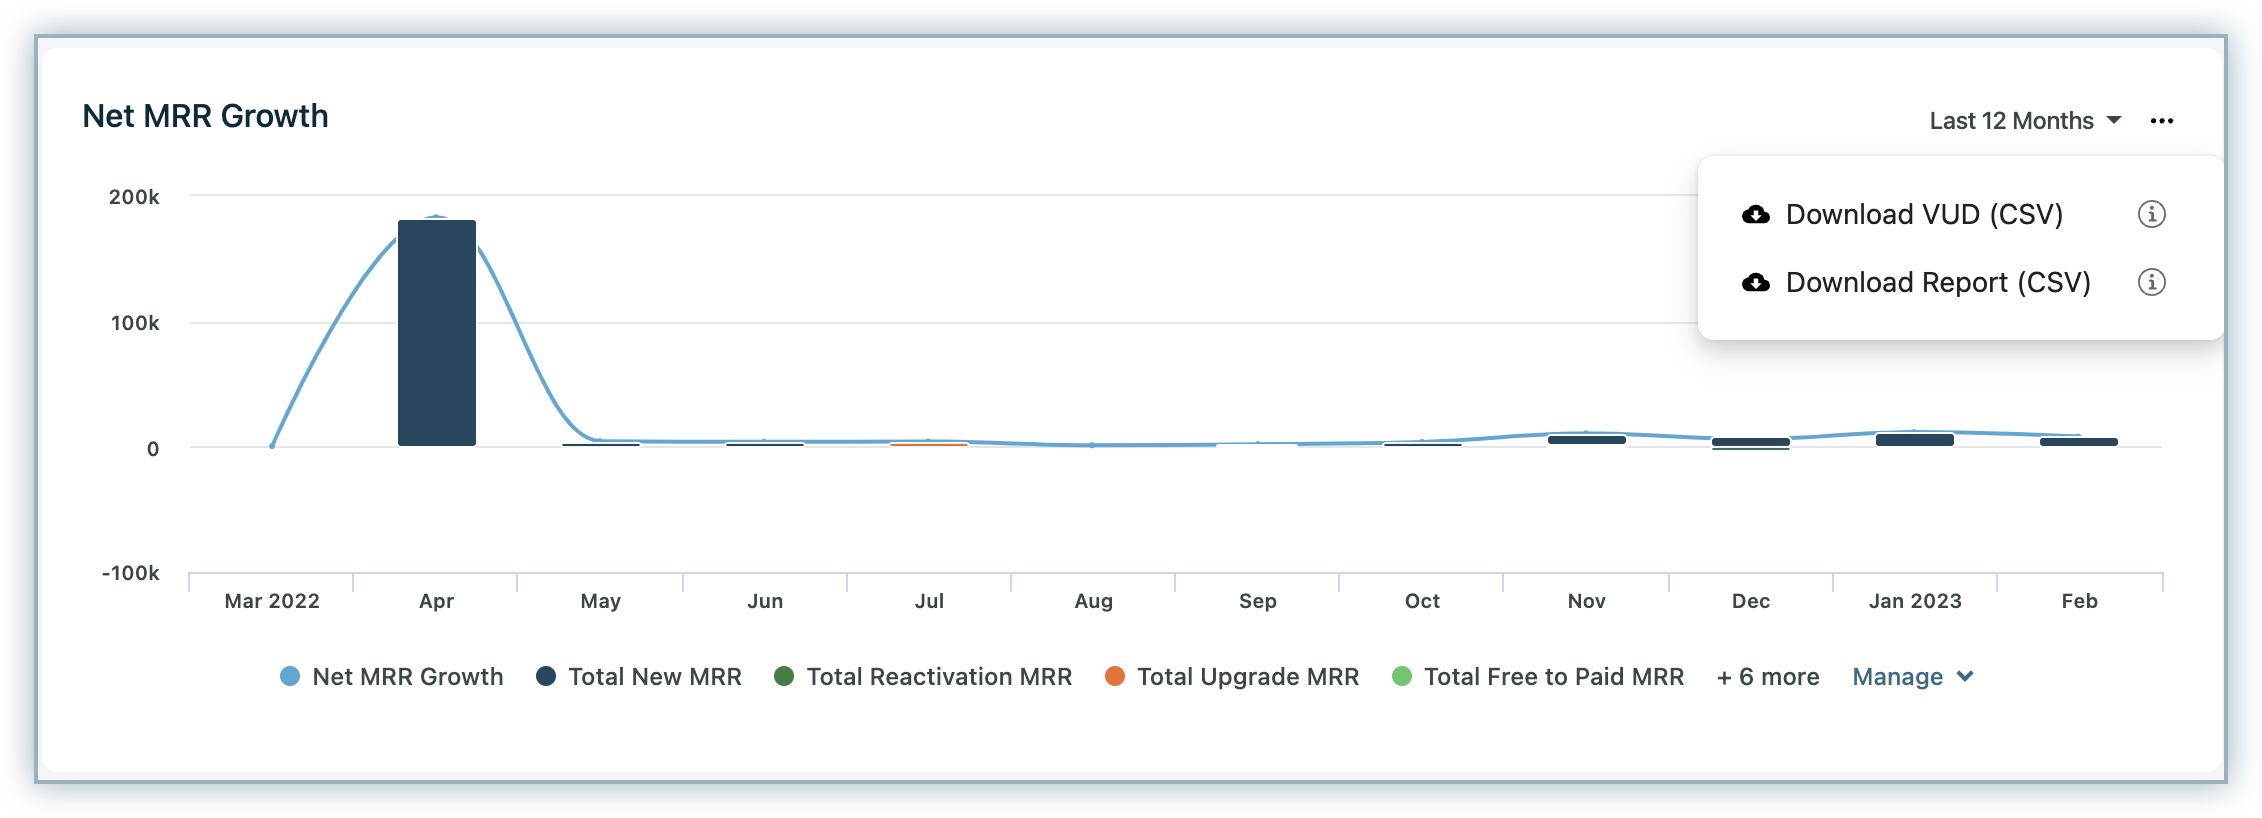
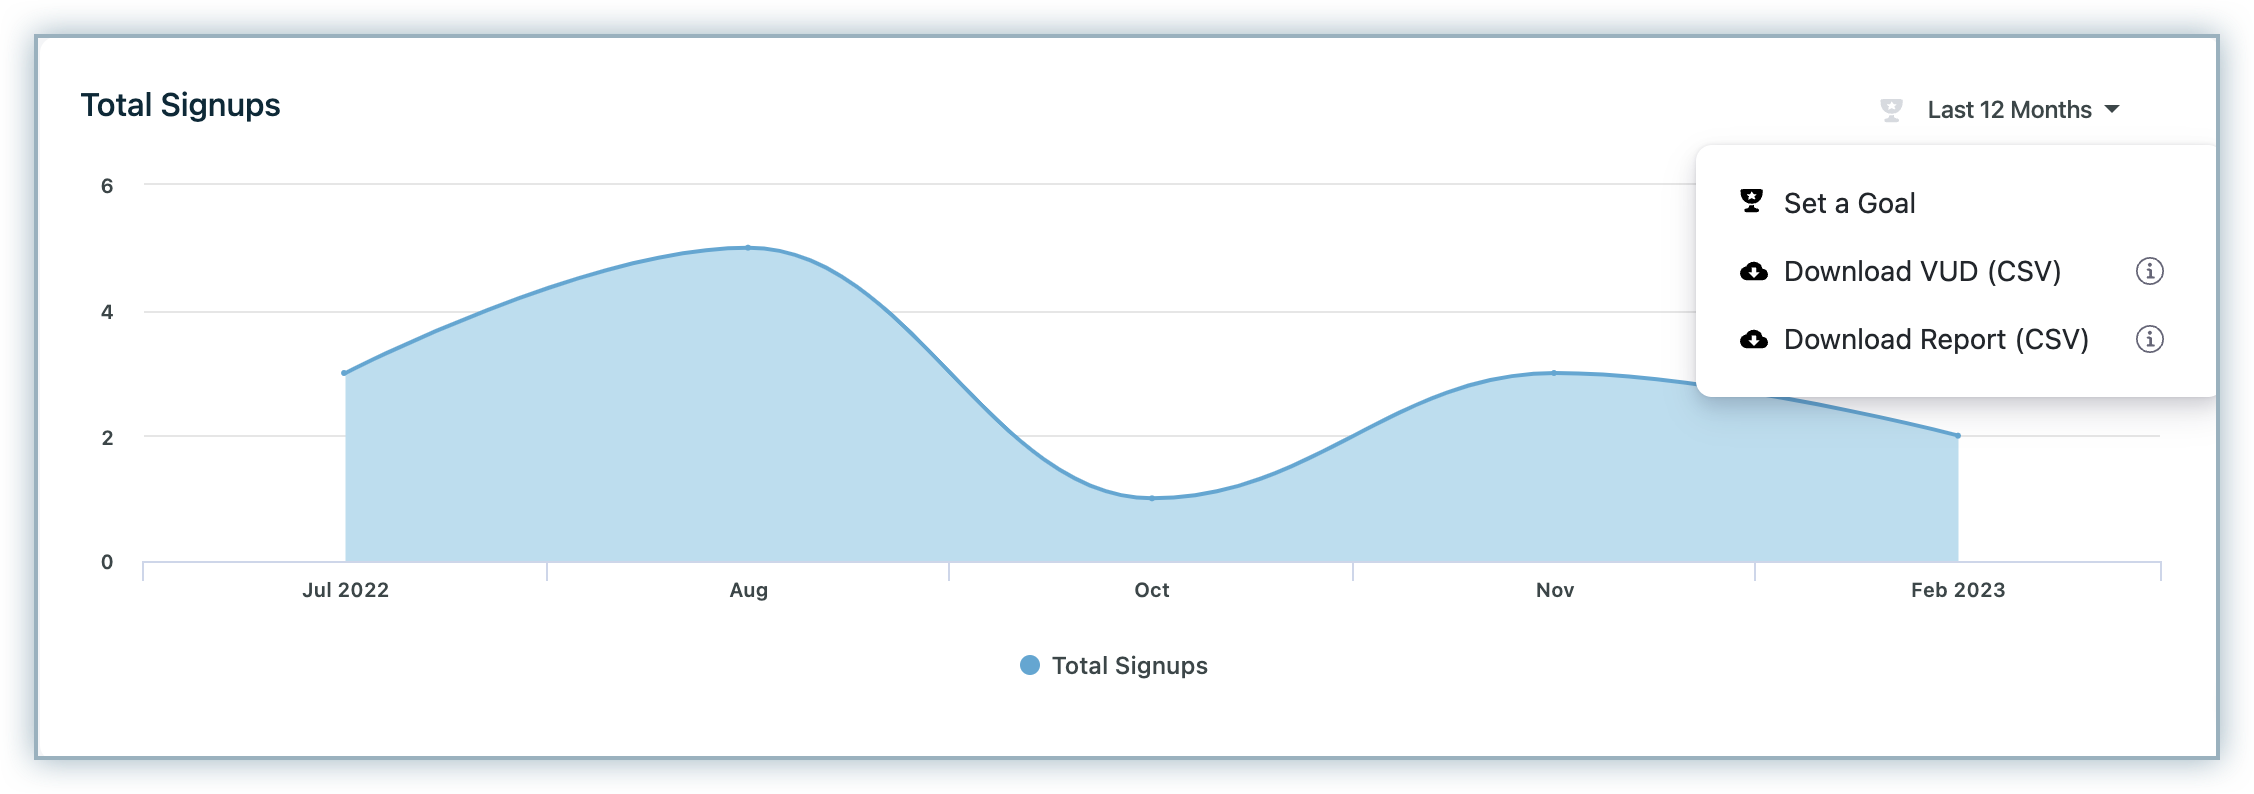
You can download the report and view underlying data by clicking the more icon (ellipsis icon) and choosing the appropriate option.
The download report option converts the chart to a tabular format and downloads it as a CSV file.
The Download VUD option downloads all the underlying data in the report in a CSV format.
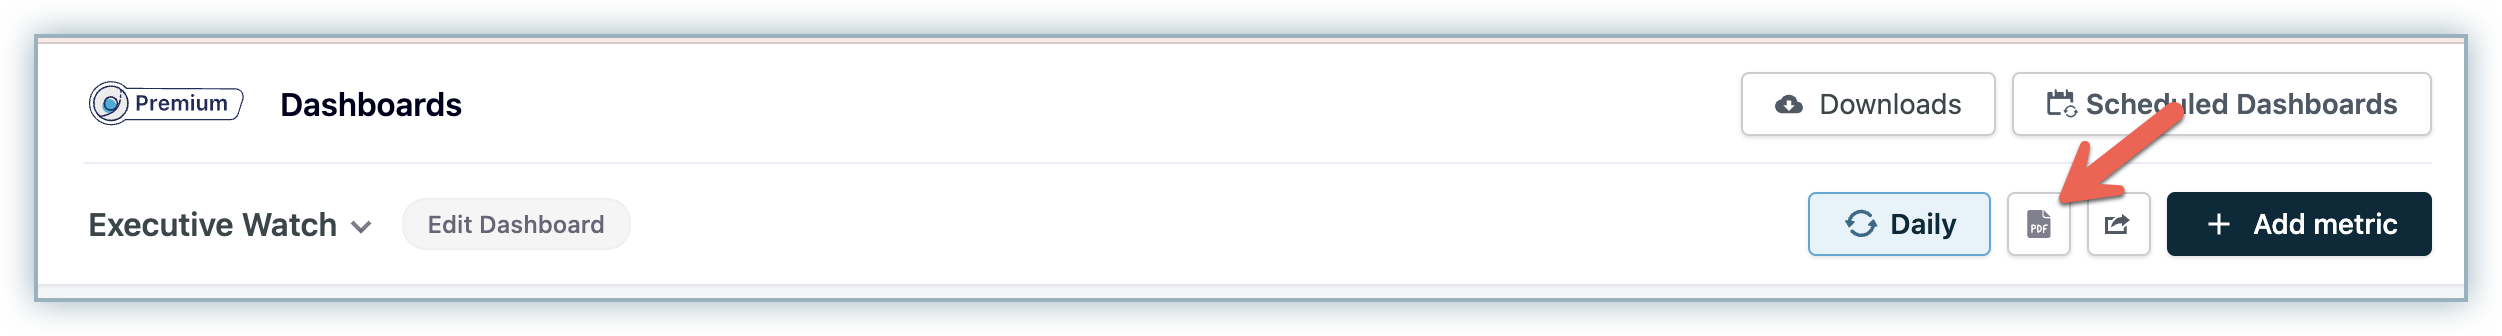
You can download the whole dashboard as a PDF by clicking the PDF option in the dashboard.
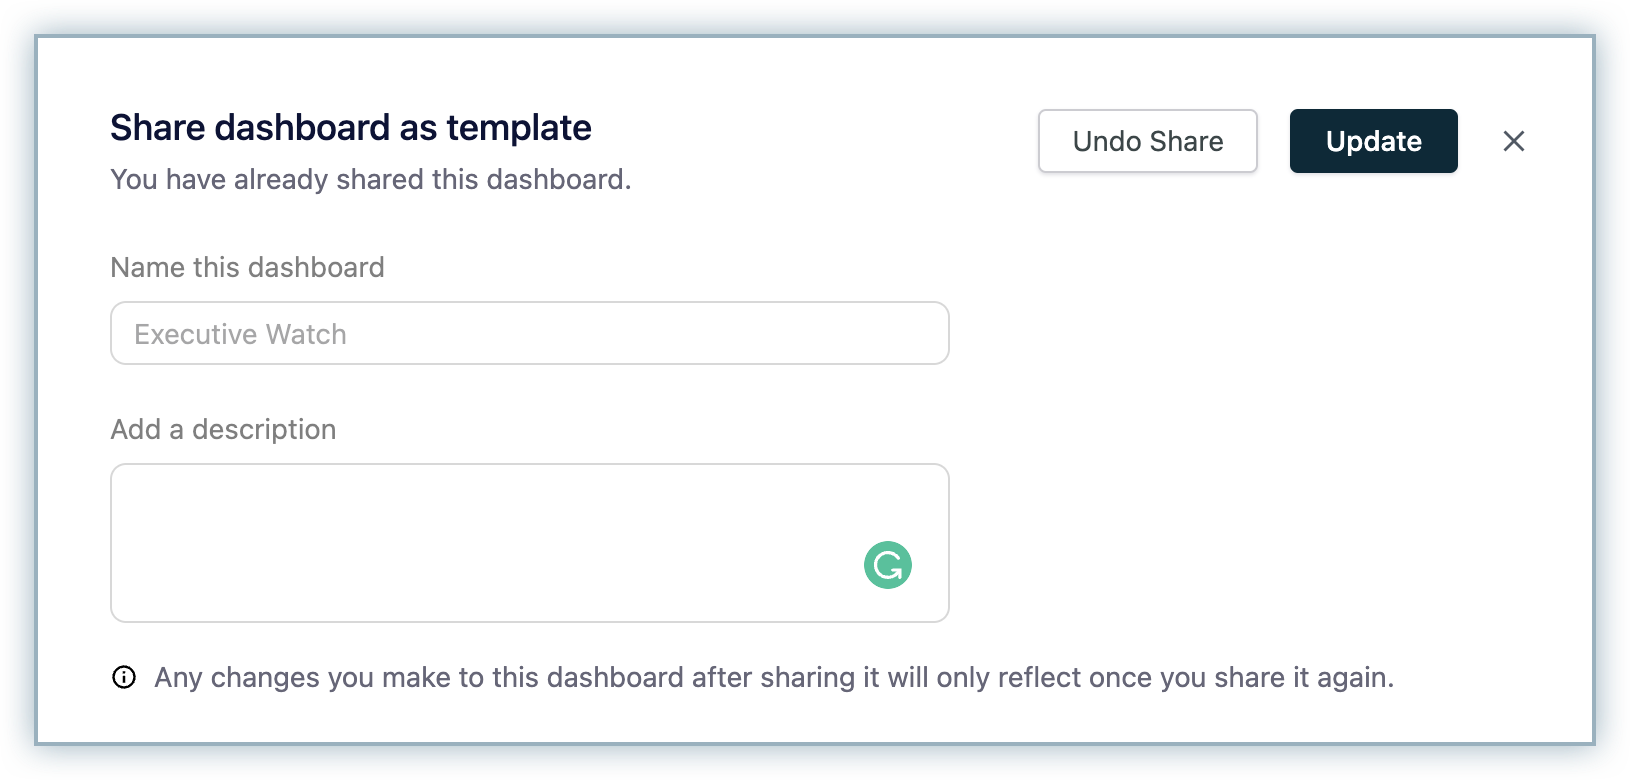
Sharing a dashboard
The dashboards that you create are specific to your account. If you want your colleagues to access the dashboard, you must share it with them.
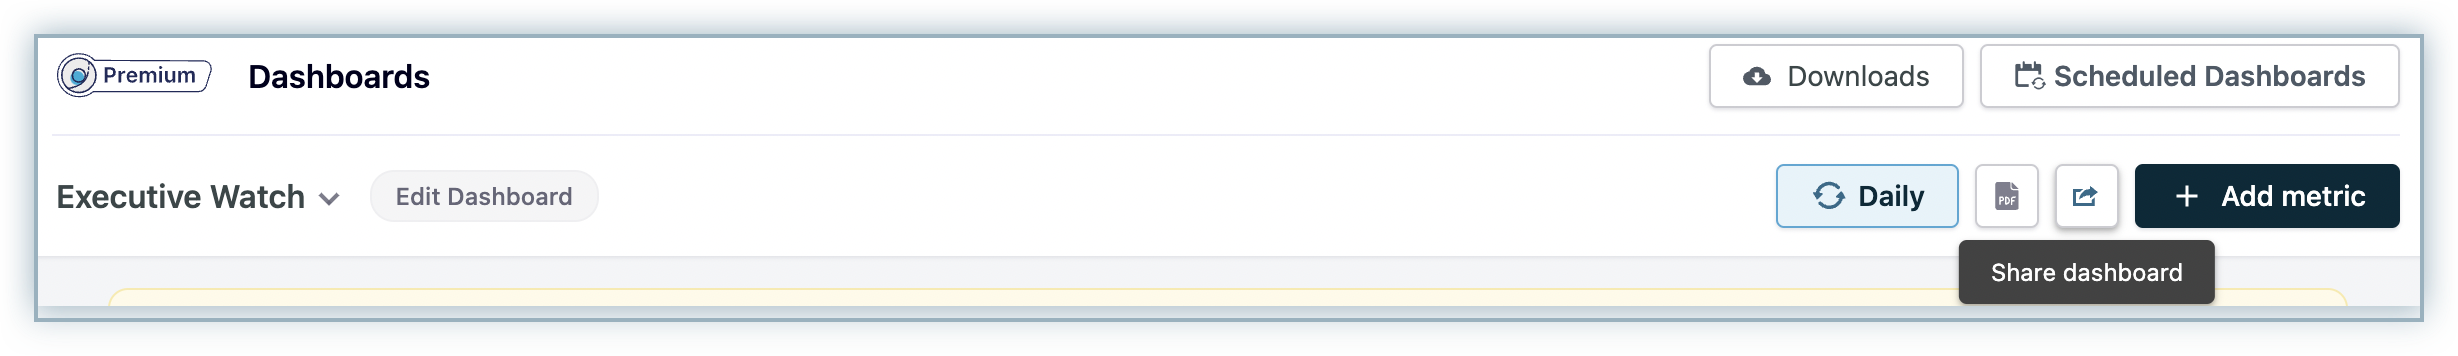
To share the dashboard, click Share dashboard.
The Share dashboard as template dialog opens. Enter the description and click Share.
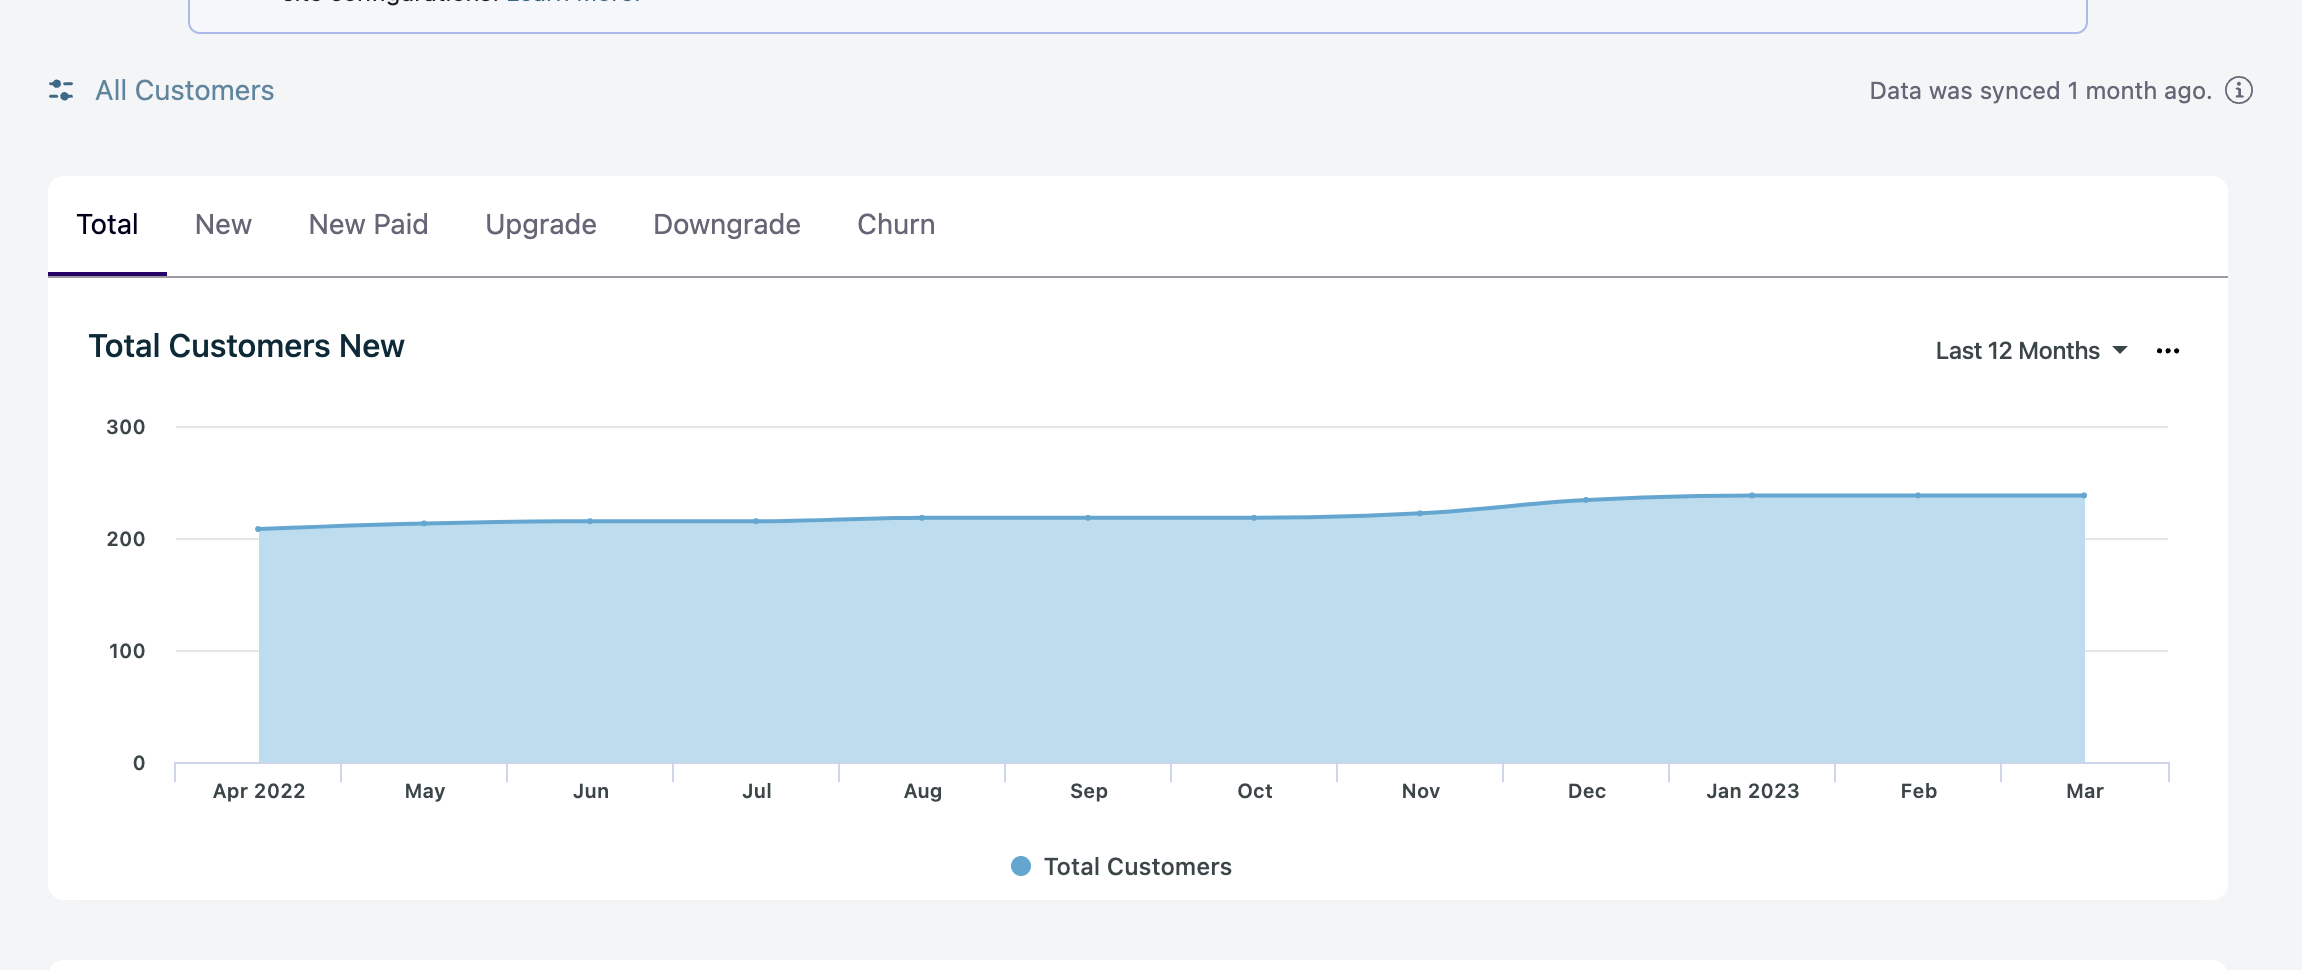
Customer insights
The Customer Insights tab allows you to view reports at a customer level (all the other dashboards display reports at subscription level).
There are 2 levels at which you can view the reports: Customer level and Parent level.
The parent level view is applicable if you have set up Account Hierarchy.
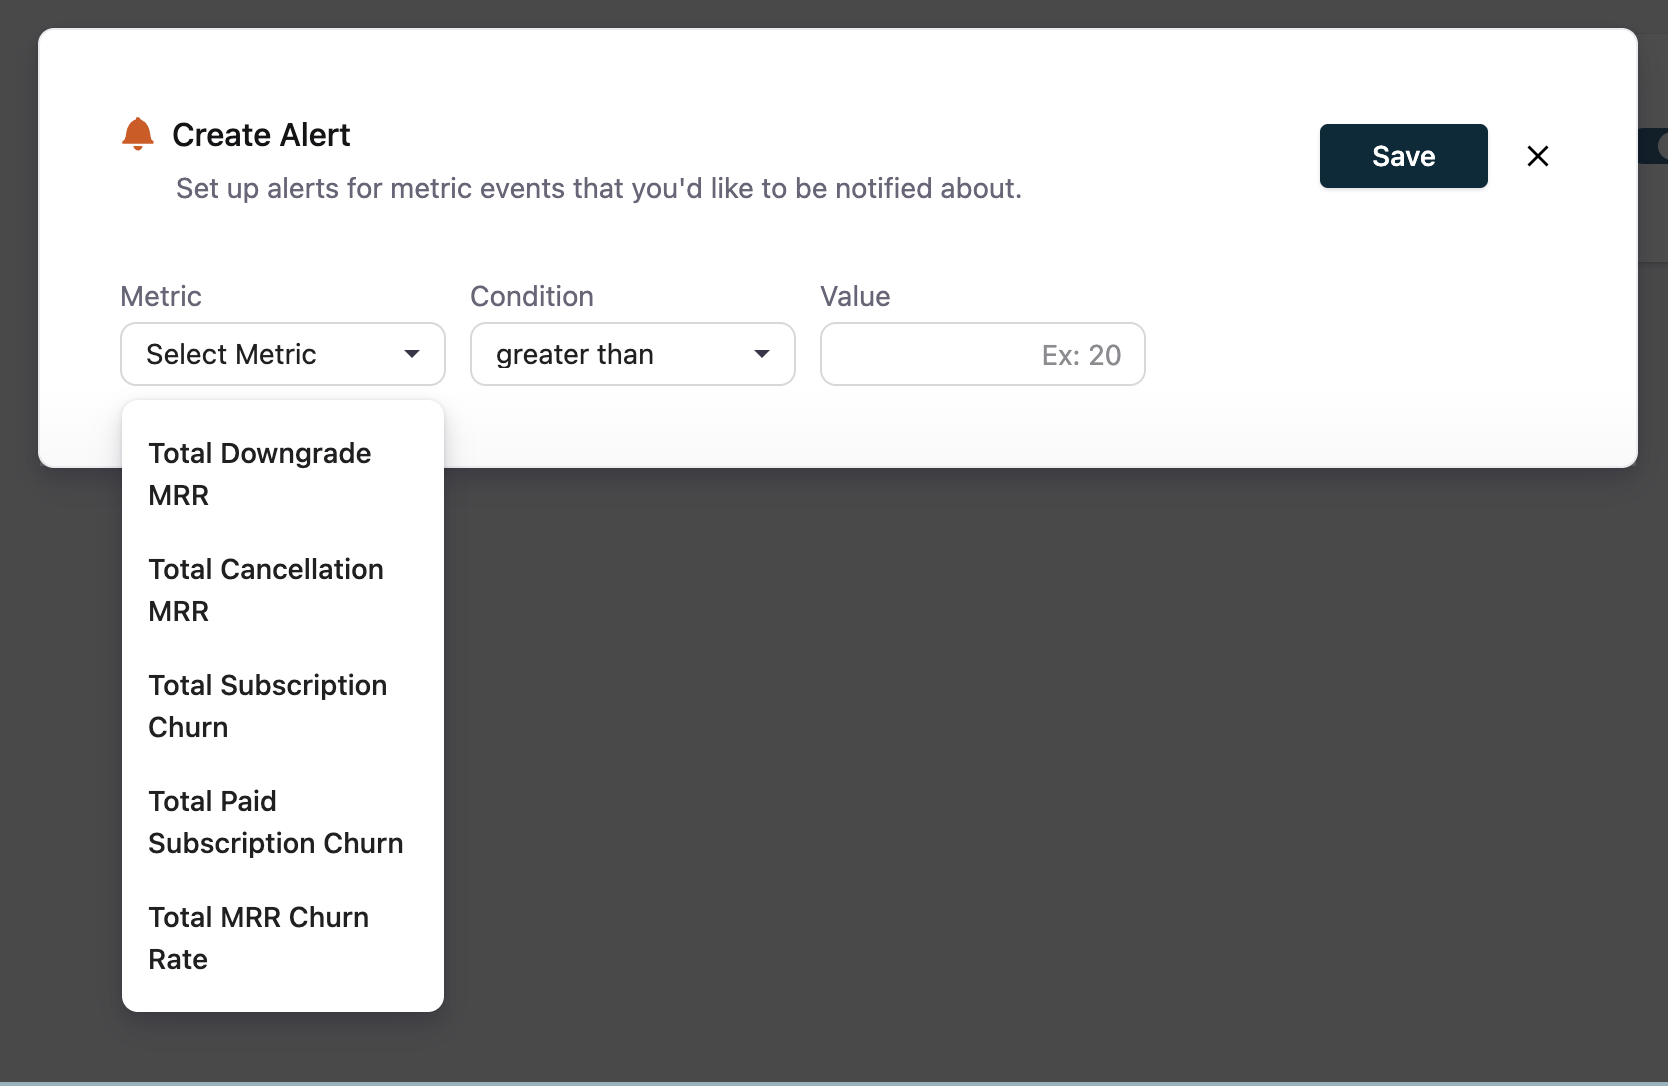
Alerts
Alerts are created to notify you when the metric meets the set condition. An email will be triggered to your email when the applied condition is met. You can create an alert for the following metrics.
- Downgrade MRR
- Cancellation MRR
- Total Subscription Churn
- Paid Subscription Churn
- Gross MRR Churn Rate
To create an alert:
-
Click RevenueStory > Alerts and Goals.
-
Click Create an Alert.
-
Select the Metric.
-
Enter the Condition and Value.
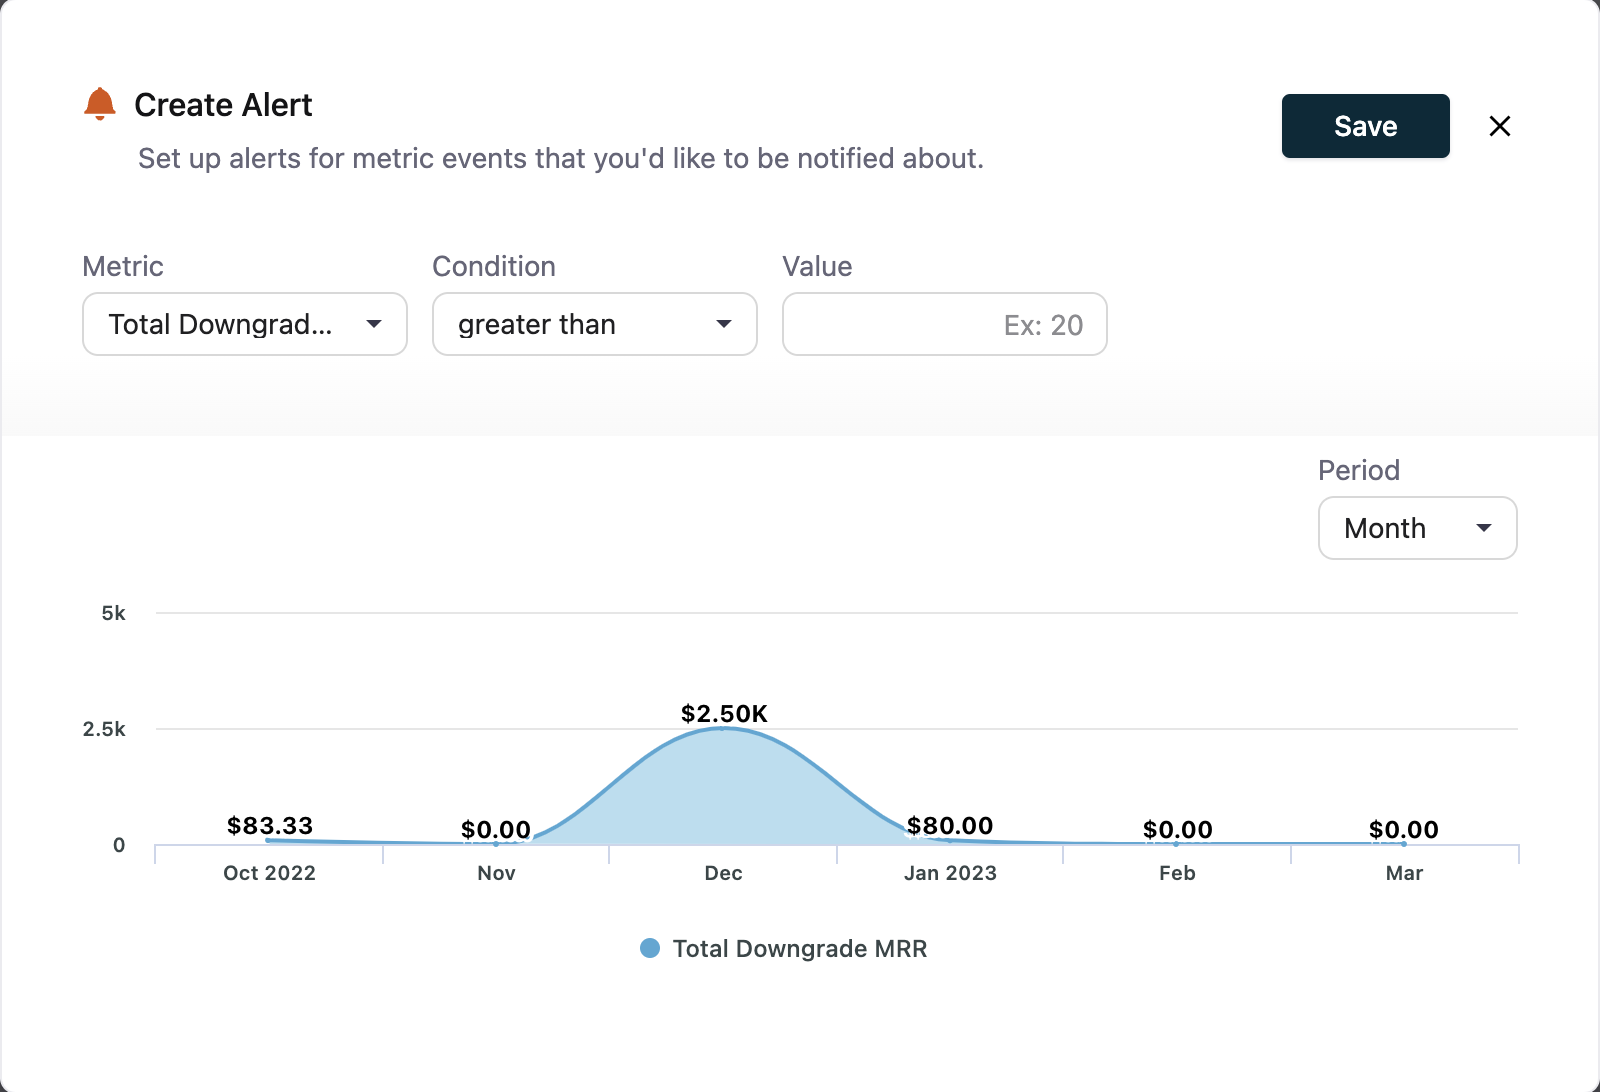
-
Click Save.
You have now added the alert. You can view and manage all the alerts from the Alerts and Goals tab.
Goals
Goals are used to set a threshold value for the metric. You can create goals for the following metrics in Chargebee.
- New MRR
- Signups
- Activations
- Upgrade MRR
- Total MRR
- Total active paid subscriptions
- Net MRR growth (KPI only)
To set a goal:
-
Click the ellipsis in the metric and click Set a Goal
-
Select the Type. You can add a fixed threshold or a percentage of the previous month.
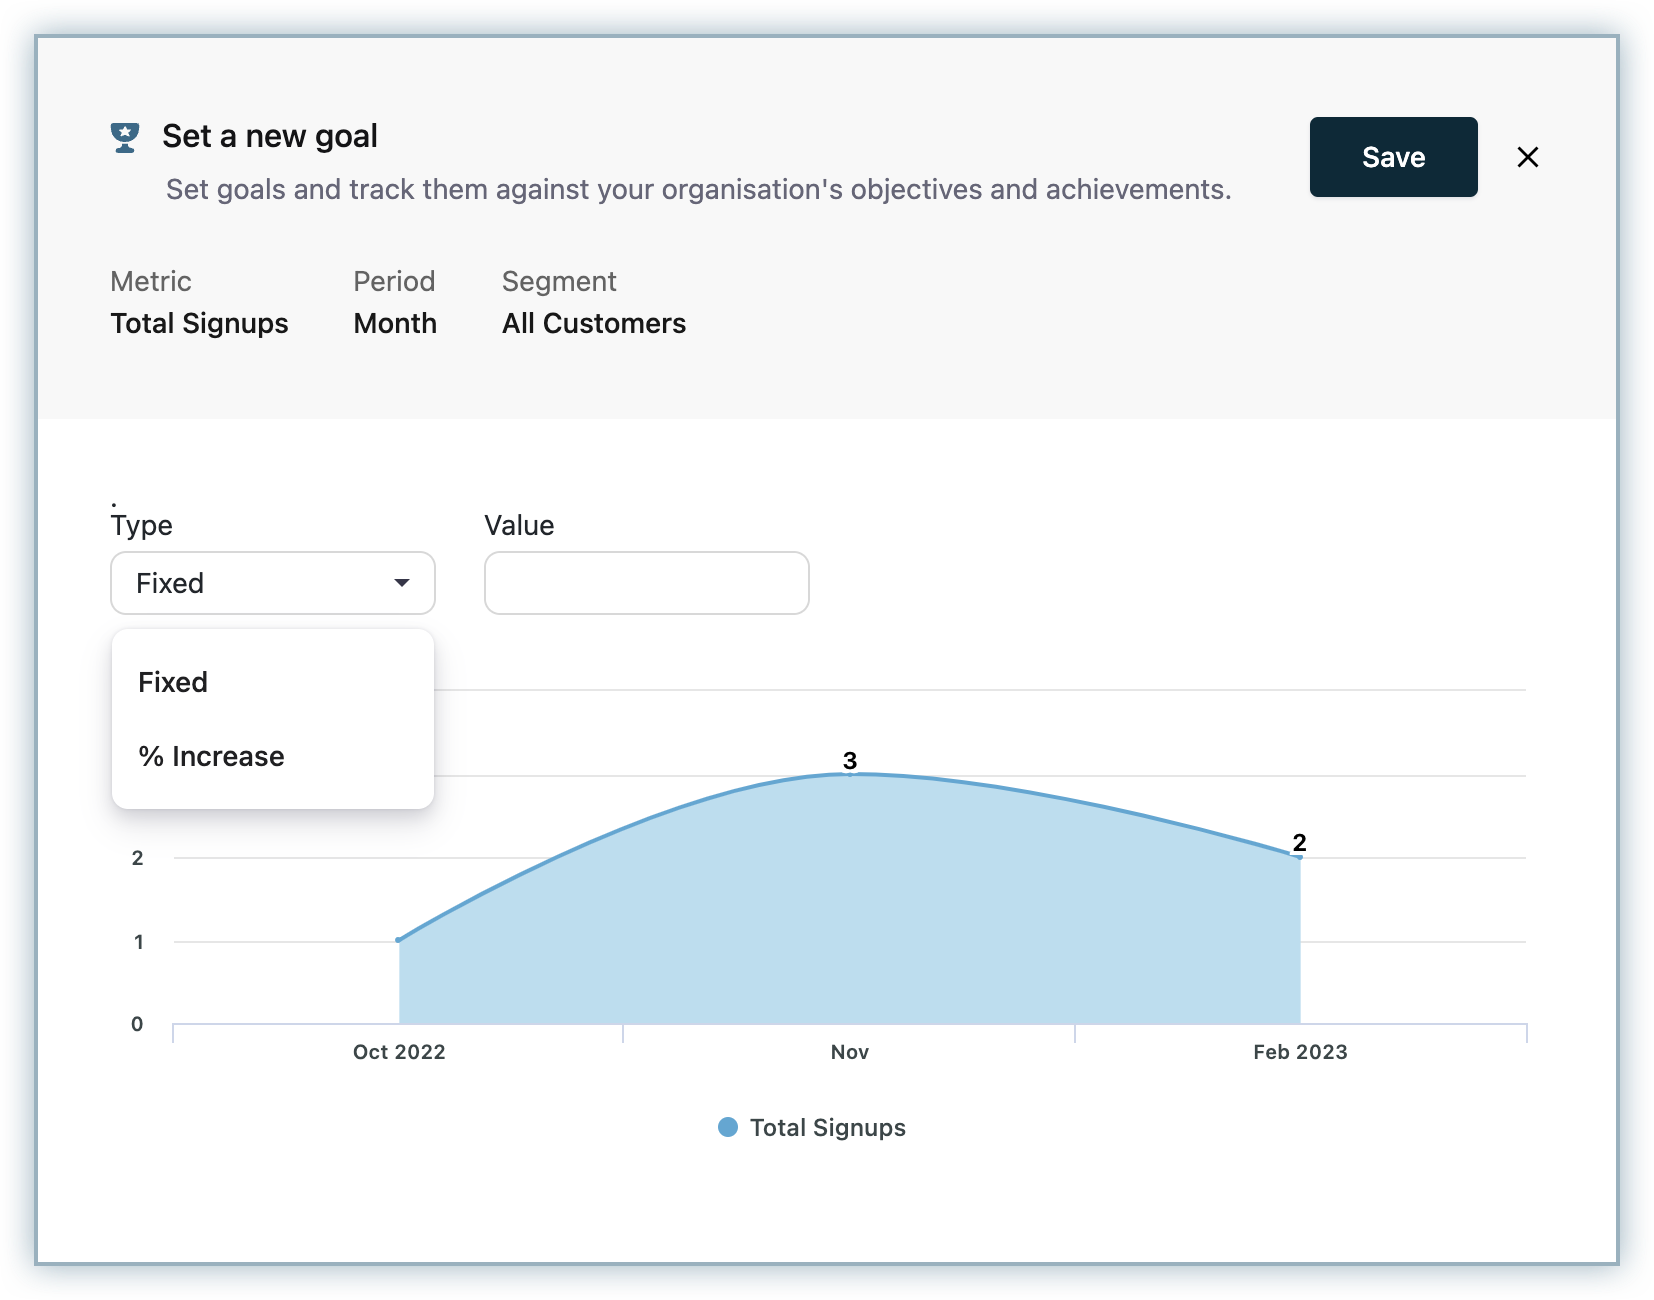
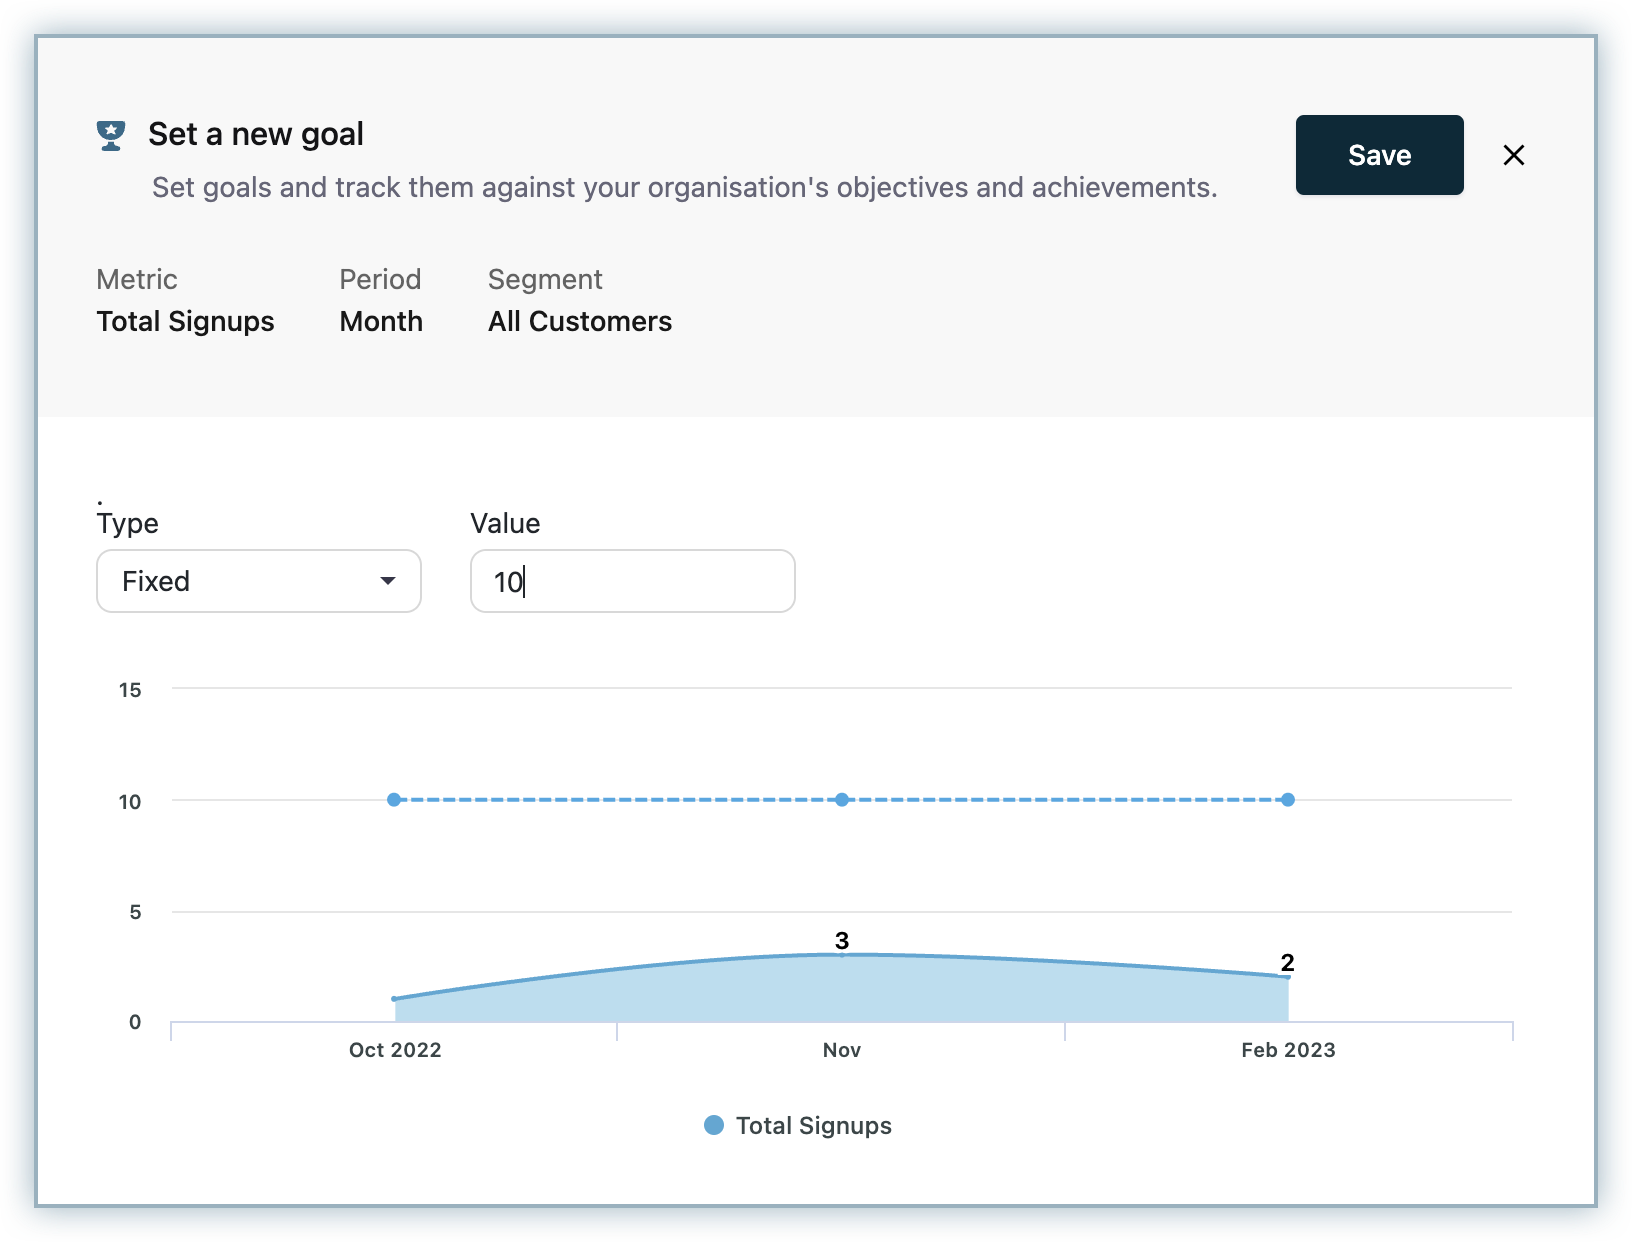
-
Enter the value and click Save.
You can view and manage all the goals from the Alerts and Goals tab.
Report builder
Report Builder is a powerful capability that allows you to create your own reports. The information in Chargebee is remodeled as data sources (tables) thereby enabling you to visualize any data that you want as insightful reports. Using this feature, you can transform raw data into actionable insights.
You can create Summary or Detailed Reports using the fields (columns) from different data sources.
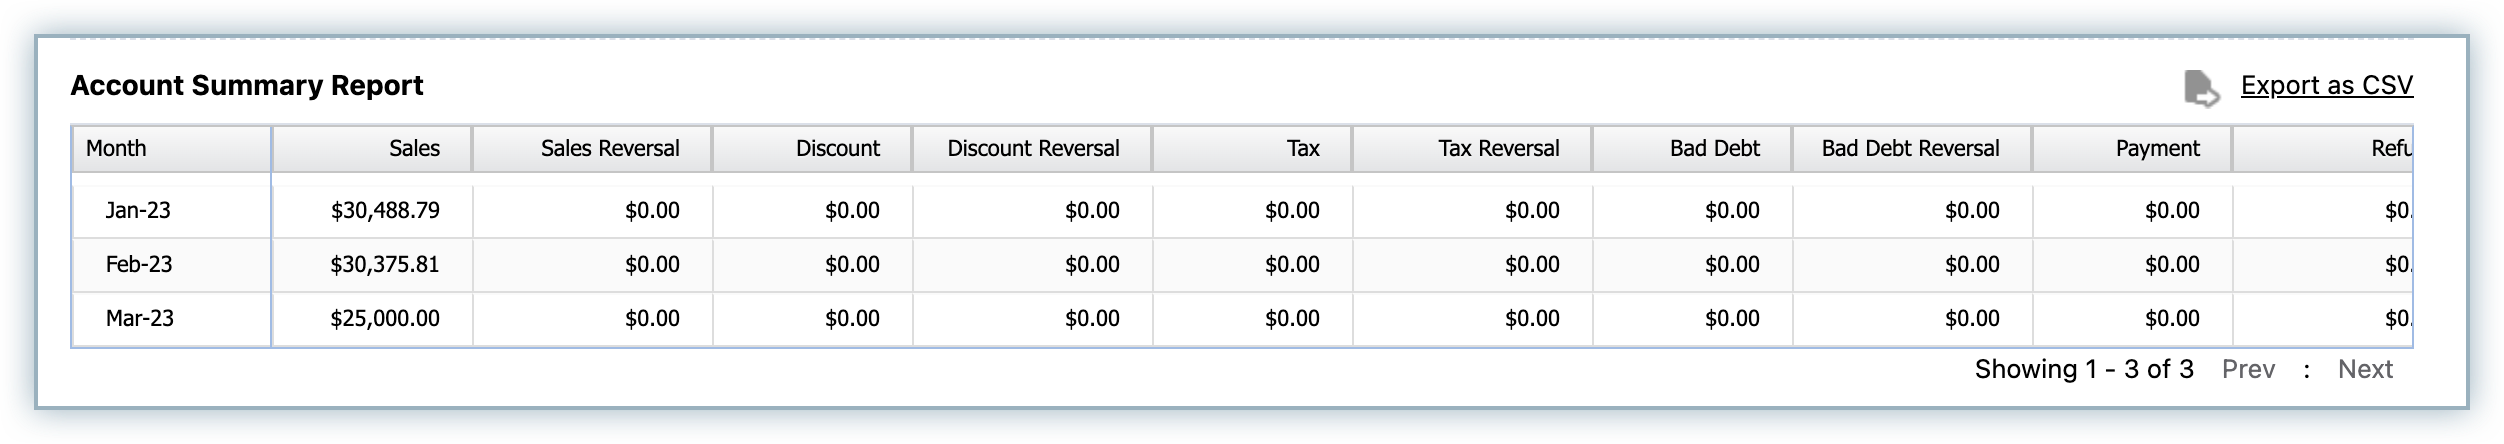
Account Summary Report
The Account Summary report is a monthly report of your sales, discounts, bad debts, aging balance, and reversals, that can be used for accounting purposes.
Following is the list of metrics calculated and the calculation logic:
- Sales: This is the sum of the amount of all the invoices generated over that particular month (Invoice date filter). This includes tax, and discounts applied on the invoice. This also includes voided invoices. Includes voided credit notes (here voided_at date filter for credit notes) which do not have reason code as a write-off.
Sales = Sum(Amount of invoices in status of Paid/Payment Due/Not Paid/Voided/ Posted, whose invoice date falls in the month) + Sum(Amount of voided credit notes (not write off case) which are voided in that month)
- Sales Reversal: This is the sum of the amount of all invoices that are voided over a particular month (meaning voided date filter is applied not Invoice date as in Sales). Example: If an invoice created in June is voided in the month of July, then the sales of the month of June will have the invoice amount summed while the Sales Reversal of the month of July will add this voided invoice amount. This also includes credit notes created over the month whose reason code is not a write-off.
Sales Reversal = Sum(Amount of invoices in status Void and voided at date falls in that month) + Sum(Amount of credit notes(not write off case) which are created over that month)
- Discounts: This is the sum of the discount amount applied over all invoices including voided invoices ( Invoice date filter). This also includes discounts from the voided credit notes( voided_at date filter here). This includes coupons and promotional credits.
Discounts = Sum(discount applied in invoices in status of Paid/Payment Due/Not Paid/Voided/Posted, whose invoice date falls in the month) + Sum (Discounts over the voided credit notes which are voided in that month)
- Discount Reversal: This is the sum of the discount amount applied over all voided invoices ( Voided at date filter applied). This also includes the sum of credit notes.
Discounts Reversal = Sum(Discount applied over invoices in status Void and voided at date falls in that month) + Sum(Discounts of credit notes which are created over that month)
- Tax: This is the sum of the tax amount applied over all invoices including voided invoices(Invoice date filter). This also includes tax from the voided credit notes(voided_at date filter here).
Tax = Sum(Tax applied in invoices in status of Paid/Payment Due/ Not Paid/Voided/ Posted, whose invoice date falls in the month) + Sum (Tax over the voided credit notes which are voided in that month)
- Tax Reversal: This is the sum of the tax amount applied over all voided invoices ( Voided at date filter applied). This also includes the sum of tax applied over credit notes.
Tax Reversal = Sum(Tax applied over invoices in status Void and voided at date falls in that month) + Sum(Tax of credit notes which are created over that month)
- Bad Debt: This is the sum of the credit notes that have reason code as a write-off.
Bad Debt = Sum(Amount in Credit Notes that has reason code as write off based on created at)
- Bad Debt Reversal: This is the sum of the voided credit notes that have reason code as a write-off.
Bad Debt Reversal = Sum(Amount in voided credit notes that has reason code write off based on voided at date)
- Payments: This has a sum of all the transactions amount with the type "Payment" and date includes the transaction date or settled date in that particular month. Those with the type "Payment Reversal" are multiplied by -1.
Payment = Sum(Transactions Amount with type (Payment) whose transaction date without settled at date falls under the month) + Sum(Transactions Amount with type Payment whose settled date falls under the month) - Sum(Transactions Amount with type Payment Reversal)
- Refunds: This has a sum of all the transactions amount with the type "Refund" based on the transaction date filter of that particular month.
Refund = Sum(Transactions Amount with type "Refund" based on transaction date)
AR Aging Analysis
Aging is tracked historically in RevenueStory.
Example
Consider an invoice was aging in November 2022 (i.e., the previous month), and this invoice was paid in December 2022 (i.e., the current month). In this case, it will continue to show up in the Aging history of November 2022, demanding it has been paid in the current month.
Your account receivable balance moves across months based on various transactions that have happened in the month for your subscriptions. You may use the equation below to calculate the ending balance for the month based on various transactions that have happened in the month on various accounts.
Closing balance of Accounts Receivable Balance (Current due and overdue) (opening balance of next month) = Opening Accounts Receivable Balance (Last months Accounts Receivable balance) + Sales(net of discount)+ Tax - Sales Reversal(net of discount reversal) - Tax Reversal - Bad Debt +Bad Debt Reversal - Payment(inclusive of tax) - Excess Payments + Refund + Rounding off +- Exchange Rate
Here the opening balance for the month is the closing account receivable balance for the previous month. All other components such as Sales, Sales reversals, Tax, Tax reversals, Payments, refunds are taken from the account summary report.
Please note that the closing account receivables balance calculated from the equation above may not completely add up to the actual closing balance shown for the month in the A/R aging report. This could be due to multiple reasons including but not limited to:
- Any excess payments recorded in the reporting month.
- Any offline payments which are backdated and are settling an aging invoice from the previous month. (Currently previous months aging balance reported does not reduce based on such payments)
- Exchange rate fluctuations. (In case of multi-currency sites)
In case your business operations involve any of the above three scenarios, it is recommended that customers use accounting software such as Xero and QuickBooks to generate more accurate reports or reconcile balances manually by taking the export of their transactions at the end of every month for reporting purposes.
AR Aging Summary
This report displays the total due amount for a particular month. You can choose a particular month for which you want to view the Total Due using the Pick a Month dropdown.
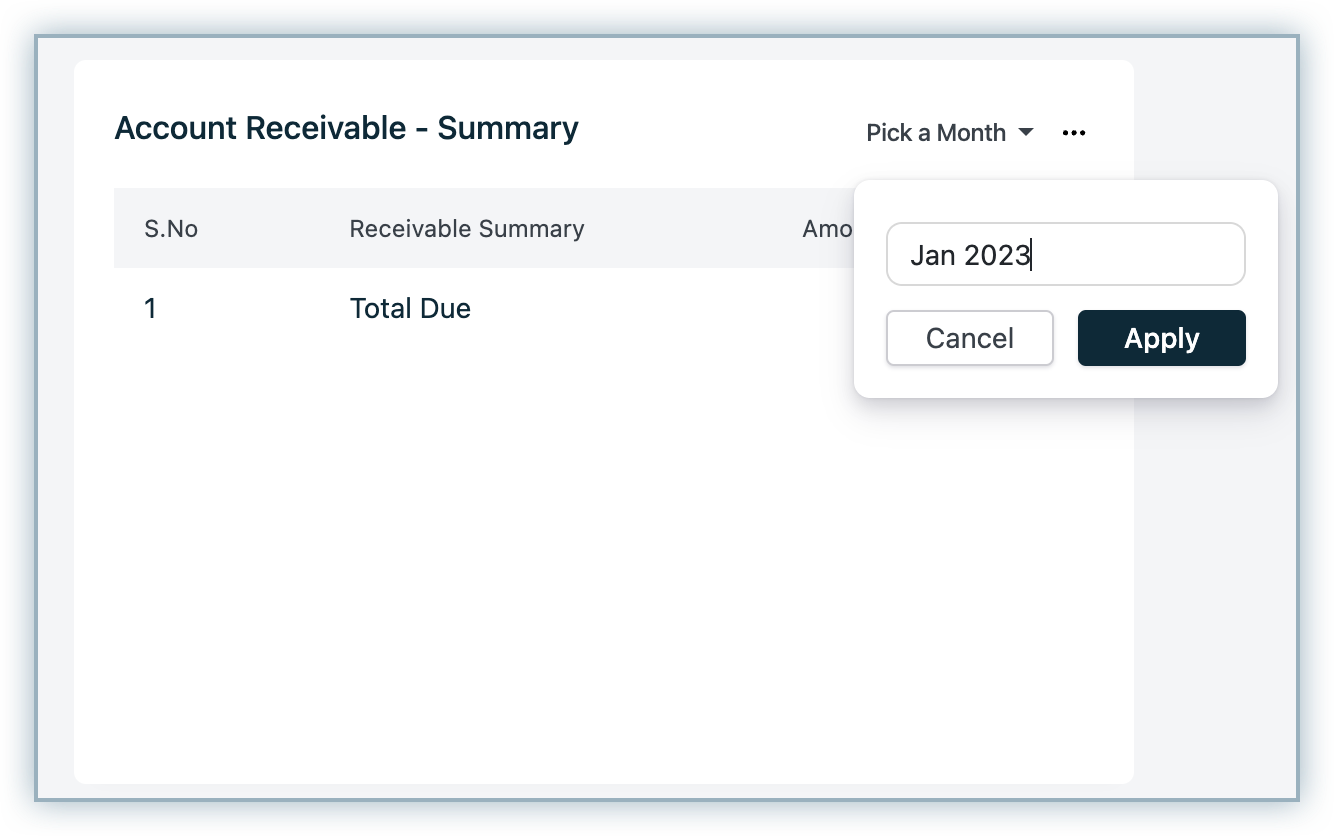
You can also download the report as a VUD or CSV file by clicking the ellipsis icon.
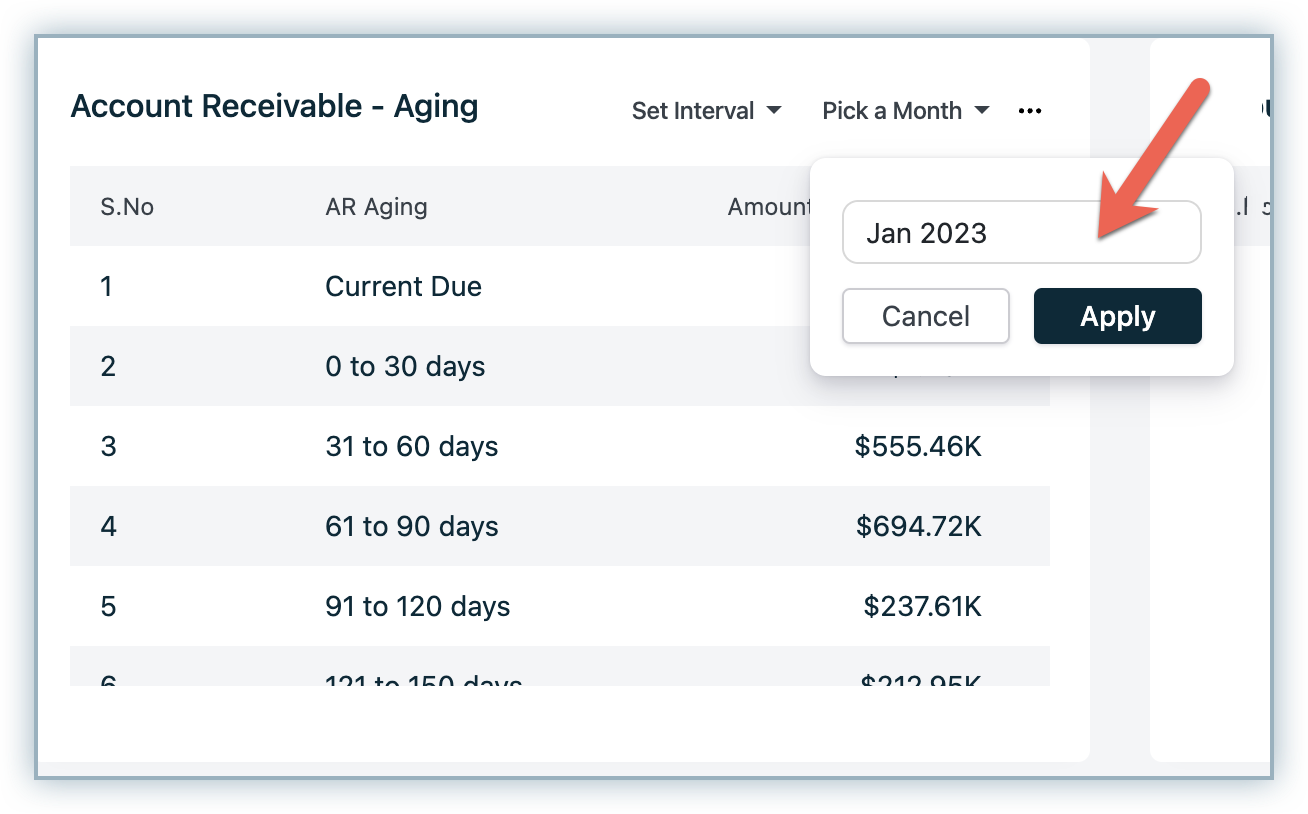
AR Aging by Buckets
This report gives you the breakdown of the total due amount in different aging categories. You can configure the aging categories using the Set Interval and categorize them by buckets.
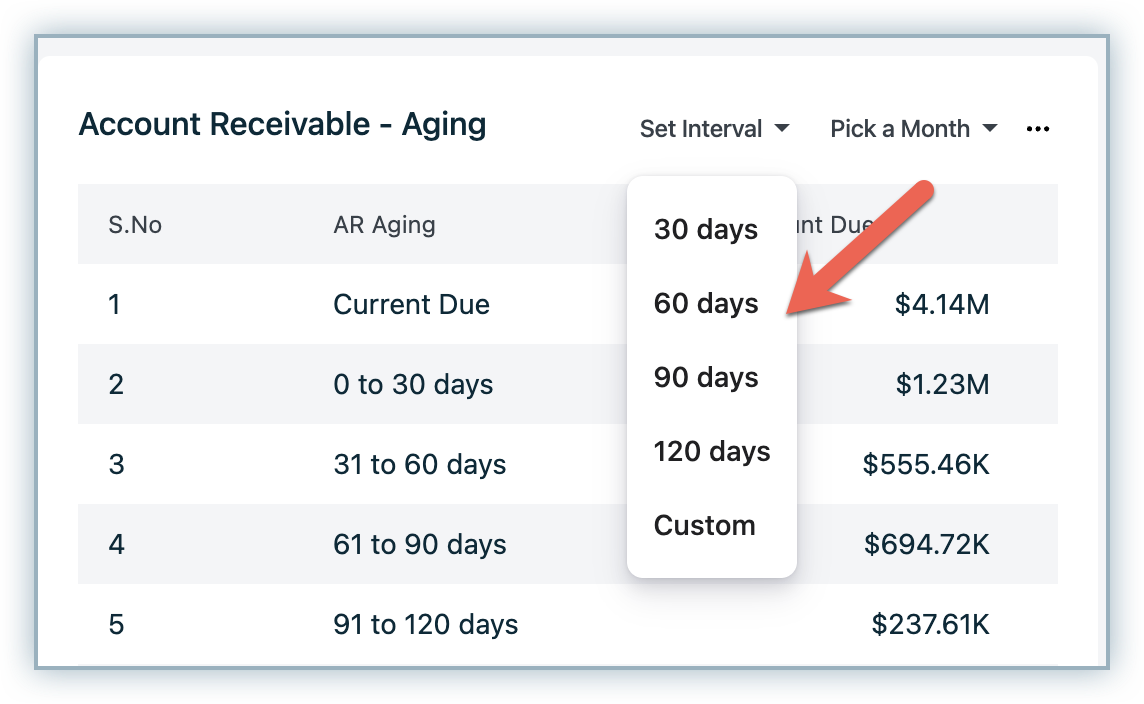
You can also choose to select a particular month using the drop-down.
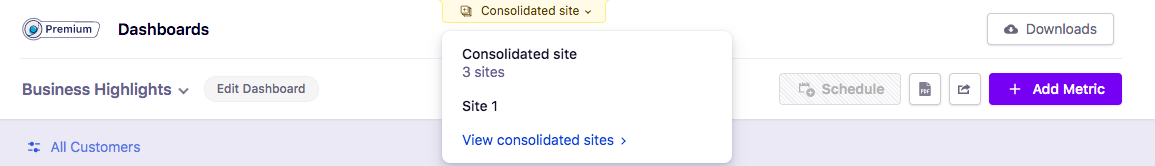
Site consolidation
As an analyst, you might be taking care of multiple sites and would want to see the consolidated reports across sites. RevenueStory's site consolidation feature allows you to consolidate data from different Live sites.
Note
- This is a premium feature. Please contact Chargebee Support to enable this.
- The feature currently supports consolidation of data only on Live sites and not Test sites.
Update on September 25, 2020.
When using site consolidation, you can use the site filter option to switch between the consolidated site and the primary site.
If you have 3 sites say Site 1, Site 2, and Site 3. You can choose a site, let's say Site 1 as a primary site. The primary site will contain the consolidated information from Site 1, Site 2, and Site 3. You can use the Site Filter option to switch between the primary site and your consolidated site. This gives you the leverage to view the information pertaining to the primary site as well as the consolidated information.
Please note that Site Filter will not be enabled by default, if you wish to use this feature, contact Chargebee Support.
Exchange Rates for Consolidated Sites
Consider you have 3 sites, say Site 1, Site 2, and Site 3. The selected primary site will contain the consolidated information from Site 1, Site 2, and Site 3. Assume the following configurations for the respective sites. These individual Sites consider using the type of exchange rate configured(Automatic/Manual).
| Name of the Site | Exchange Rate Configuration |
|---|---|
| Site 1 (Primary) | Manual |
| Site 2 | Automatic |
| Site 3 | Manual |
The consolidated site will always make use of the Automatic exchange rates irrespective of the exchange rates configured for individual sites.
Unified customer view
The site consolidation feature of RevenueStory allows you to consolidate data across different sites. Sometimes when you enable site consolidation there can be a scenario where the same customer is present in more than one of the sites. For example, a company called Acme can have multiple sites for each of its products - Acme CRM, Acme Books, Acme Marketing. Now, there is a possibility that a single customer (say John Doe) is using all of these products, which means there is a record for John Doe in all of the sites.
Now, when site consolidation is enabled, John Doe is counted thrice, as the record is available in three different sites. To avoid this, follow the below steps:
- Create a single line text custom field for the customer object in Chargebee. To learn about creating custom fields refer to this document.
- Add the same value in the custom field for the customer across the sites. For example, the customer John Doe has a subscription with Acme CRM, Acme Books and Acme Marketing. This means that, John Doe's information is available in all the three sites. You need to add the same custom value, say ‘X' for John Doe on all the three sites.
- The custom field that you have created here must be mapped with the Unique Customer Handle custom field in RevenueStory. Please write to Chargebee Support to map the custom fields.
- Once the mapping is done, the metrics on the Customer Insights dashboard in RevenueStory will be computed based on the Unique Customer Handle.
Note
- If the same customer is accidentally given values that do not match, they are accounted as separate customers.
- In case the custom field is left empty for a customer, the field is automatically populated with the default merchant handle and the customer is accounted as a separate customer.
RevenueStory considers my exchange rates for calculation
RevenueStory imports the same logic from the Chargebee for exchange rates. Transactions made in the additional currencies will be converted to the base currency using the exchange rates that you configure in them, for reporting purposes. Learn more.You can set the exchange rates automatically or manually.
Setting up Manual Exchange Rates
To set up Additional Currencies using manual exchange rates follow these steps:
- Click on the ellipsis icon appearing next to the currency type under Additional Currencies.
- Click Manage and then select "I'll set the exchange rate myself".
- Click Apply to confirm.
Automatic Exchange Rates
If you choose Auto as the Exchange Rate Type, RevenueStory uses the exchange rates available with the currency layer and Open Exchange Rates.
Here's how Chargebee picks up exchange rates for reporting business metrics:
Scenario: 1
If today is 4th August 2016,
- The previous day's (3rd August 2016) closing rates will be synced with RevenueStory from the exchange rate sources.
- The synced rates will be used for transactions occurring from 00:30 UTC onward.
- For transactions occurring before 00:30 UTC, RevenueStory will use the closing rates from 2nd August.
- If RevenueStory fails to sync with the exchange rate sources on 4th August 2016, the last available exchange rates will be used.
- For transactions dated before 2011, the closest available exchange rate for 2011 will be used for conversion.
Scenario: 2
If today is 31st December 2020, and the manual exchange rates are configured for the month of January 2021.
- On 31st December it would continue to use the manual exchange rates.
- The synced manual rates will be used for transactions until it is modified.
- If modified the exchange rates are applied on the 1st, February the rates are applied from the same day.
Scenario: 3
If the manual exchange rates are not configured for a period. If today is 31st January 2020, and if the exchange rates are not configured for the month of January.
- When the user has not configured a manual exchange rate then RevenueStory defers to the automated exchange rate for the month of January.
- These automated exchange rates are applied until the exchange rate is next modified by the user.
Was this article helpful?