Docs
With Starter Churn Insights, you can create a personalized cancel page to collect valuable feedback from customers and understand why your customers are leaving.
The reports available within Starter Churn Insights will help you answer these questions:
Starter Churn Insights provides a dashboard and several reports available in-app and via email.
The dashboard contains five out-of-the-box reports to provide a high-level overview of your cancel page performance:
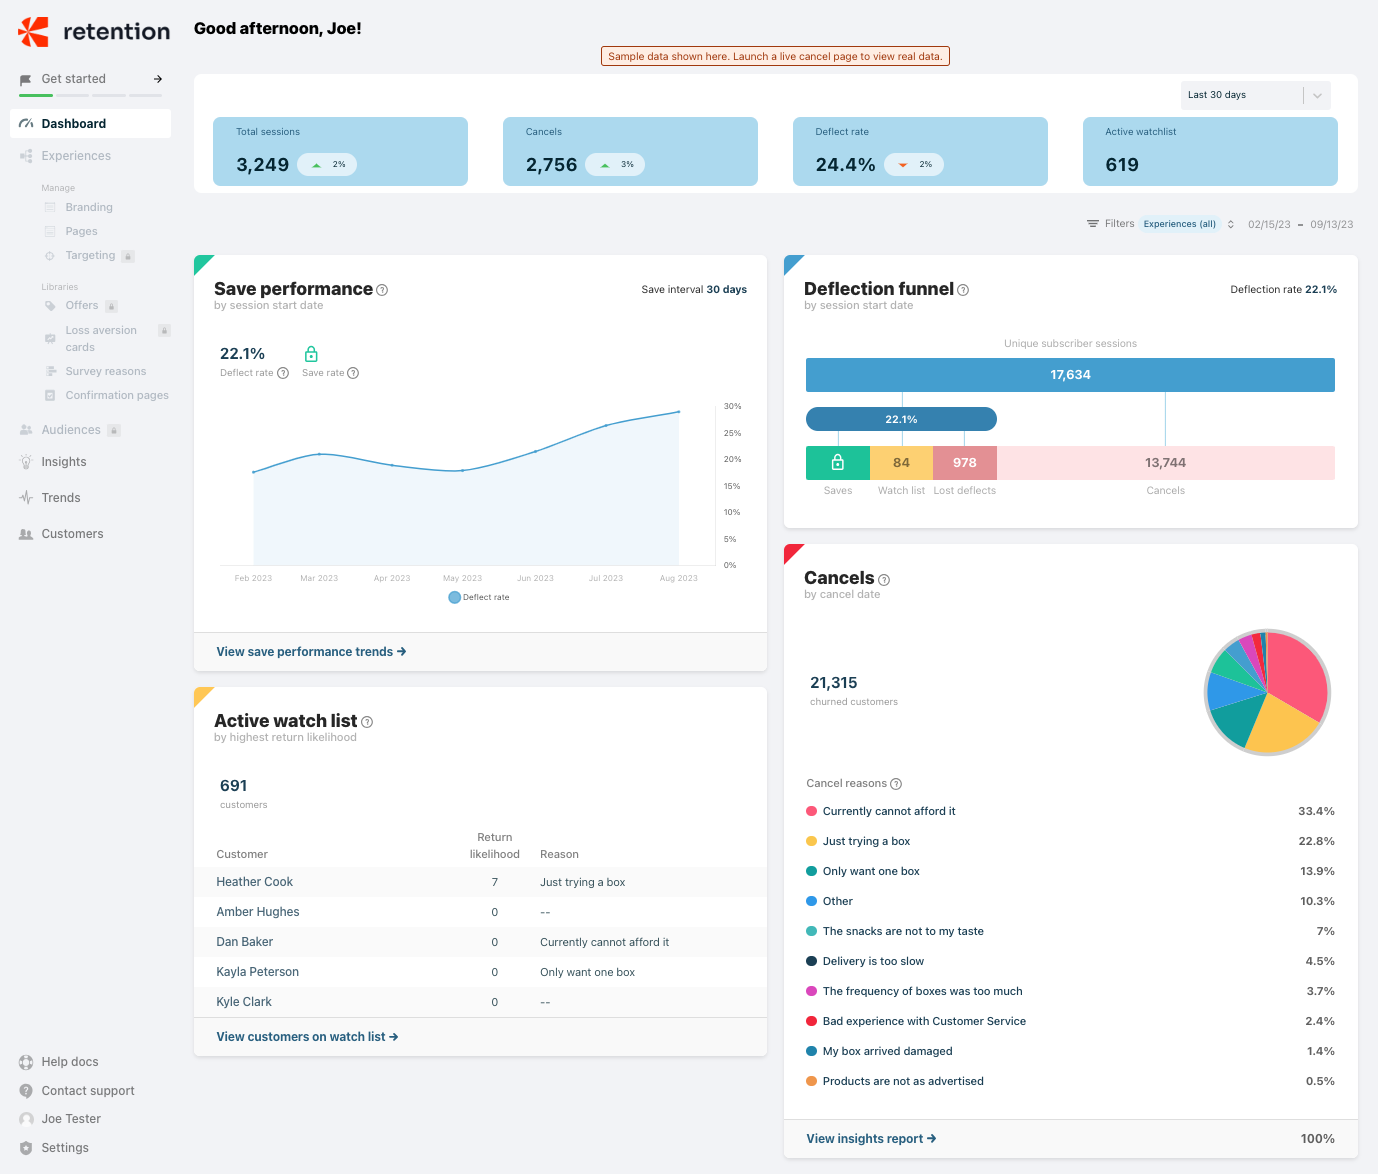
Located at the top of the dashboard, the Pulse report allows you to quickly view key metrics for your cancel page:
You can view the data for the last 7 days, last 30 days, or month to date.
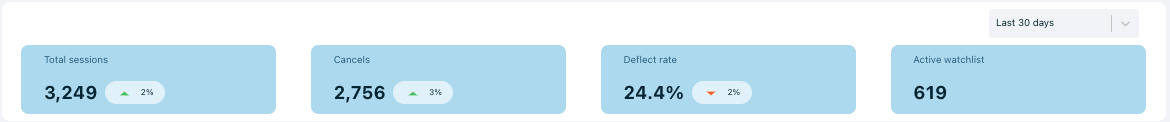
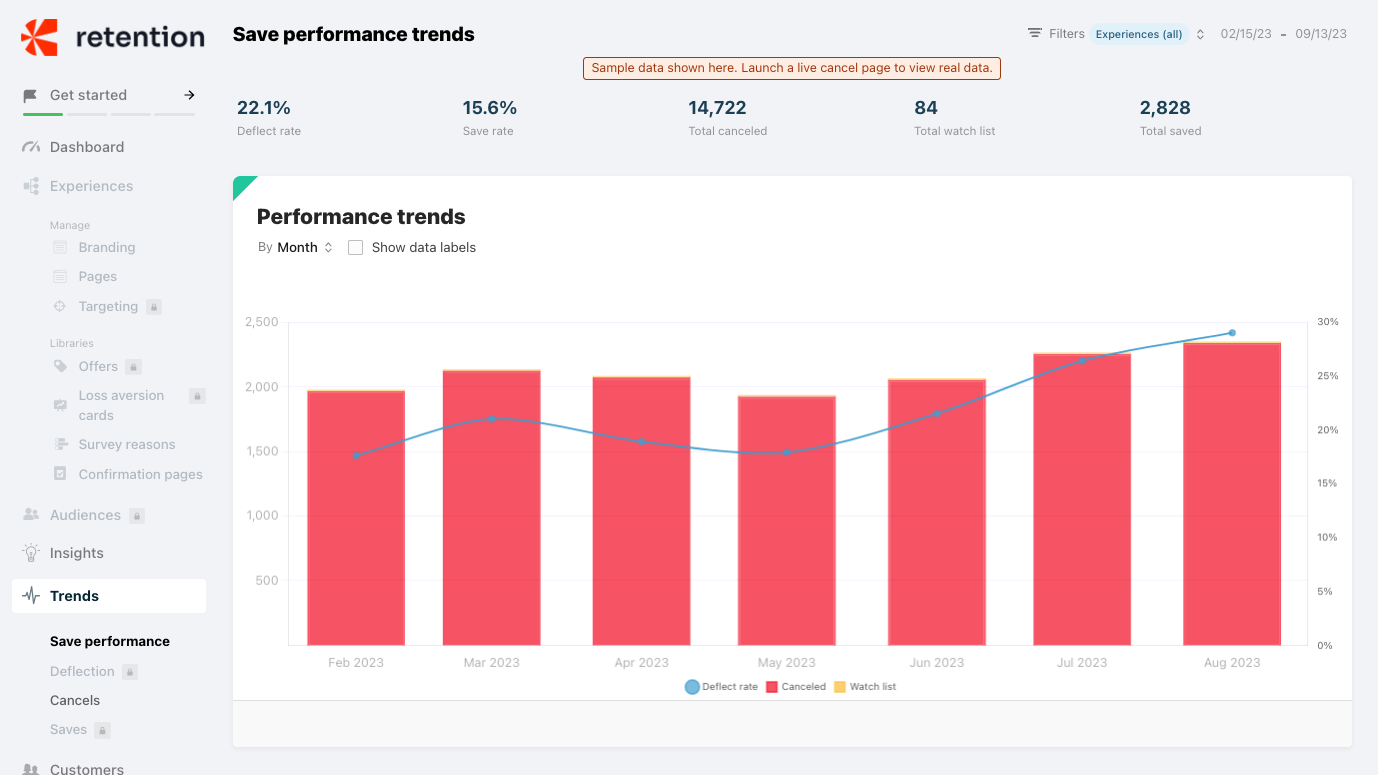
The Save performance report captures the deflect rate over the period specified in the date range filter. The deflect rate represents the percentage of customers who saw the cancel page and exited the page without canceling. The save rate, which is not available for the free version of Starter, represents the % of customers who deflected and remain a paying customer 30 days after the deflect event. Click the link at the bottom of the report to go to the Saves trend report for more details.
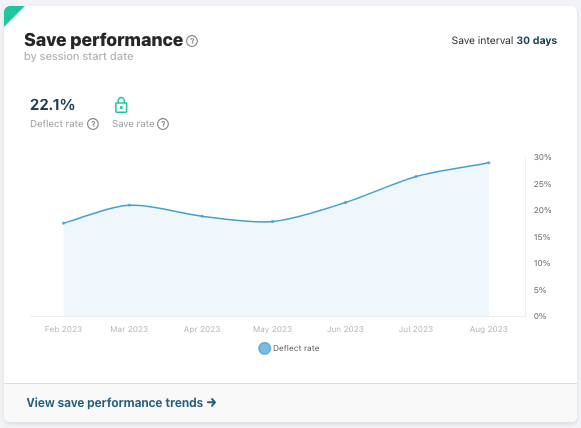
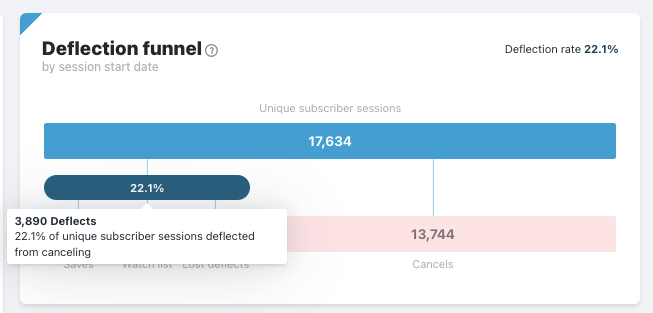
The Deflection funnel report captures the total cancel page traffic volume over the period specified in the date range filter and performance by outcome:
Hover over the bar to get more details for the outcome.
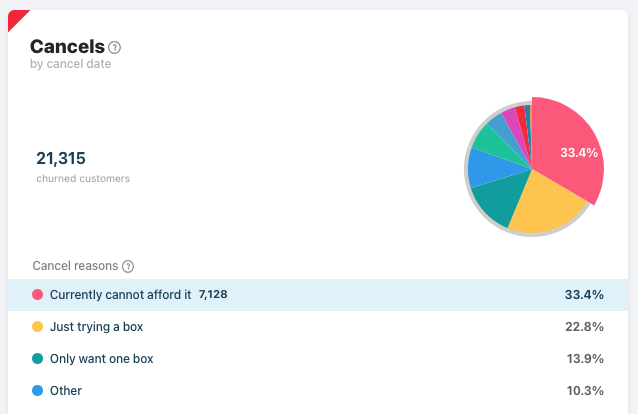
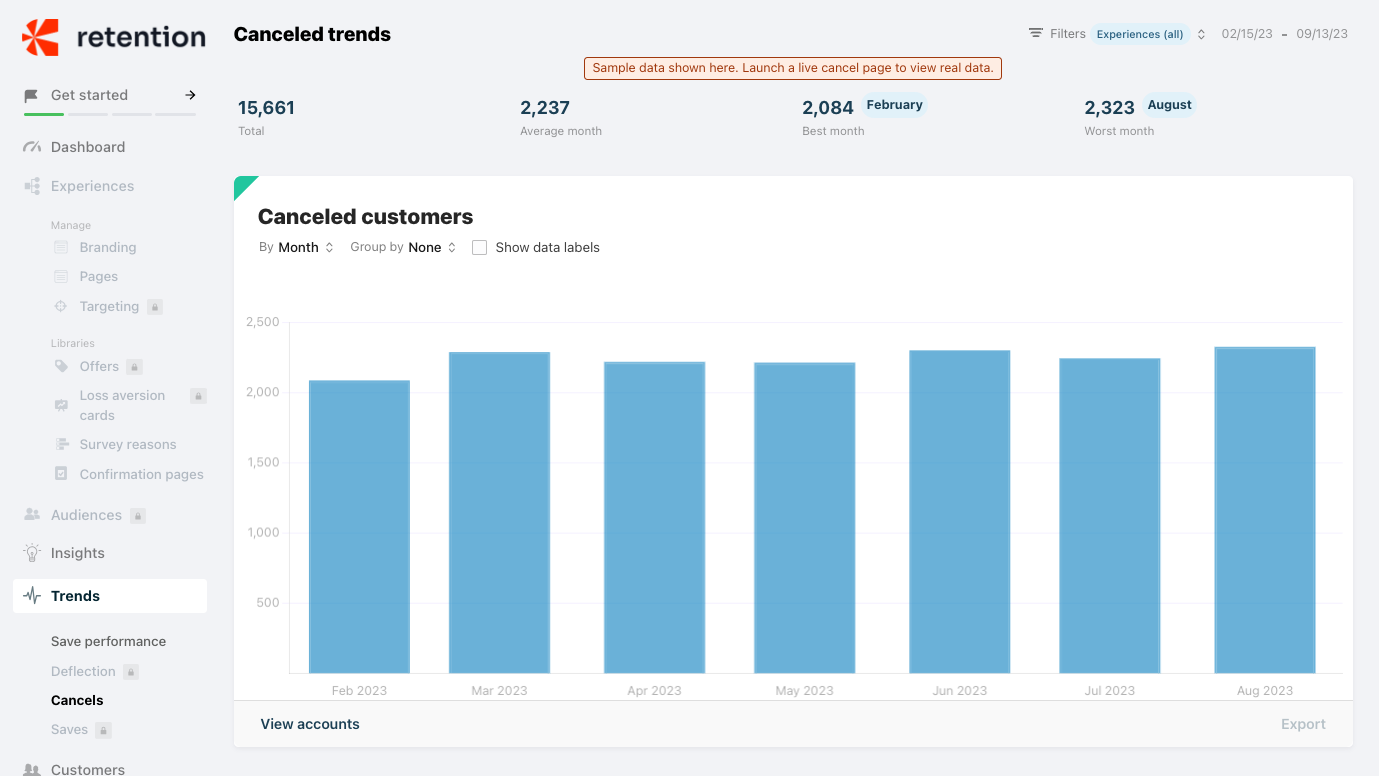
The Cancels report shows the total number of canceled customers during the specified time period and break down by cancel reason. Click the link at the bottom of the report to go to the Cancel insights report for more details.
You can hover over the cancel reason in the list to view the number of canceled customers for the reason and show in the pie chart.
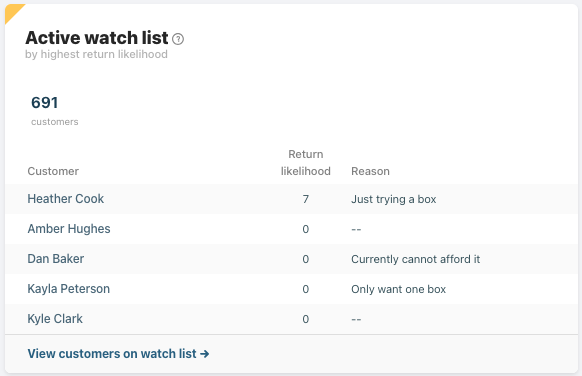
Customers who exit the cancel page without canceling are still at risk of churning at a later time. The Active watchlist report includes the total count of customers who saw the cancel page but did not cancel, as well as the top five customers based on highest likelihood of return.
Click on the link at the bottom of the report to go to the Customers > Watchlist report to get a full, detailed list of customers on the watchlist.
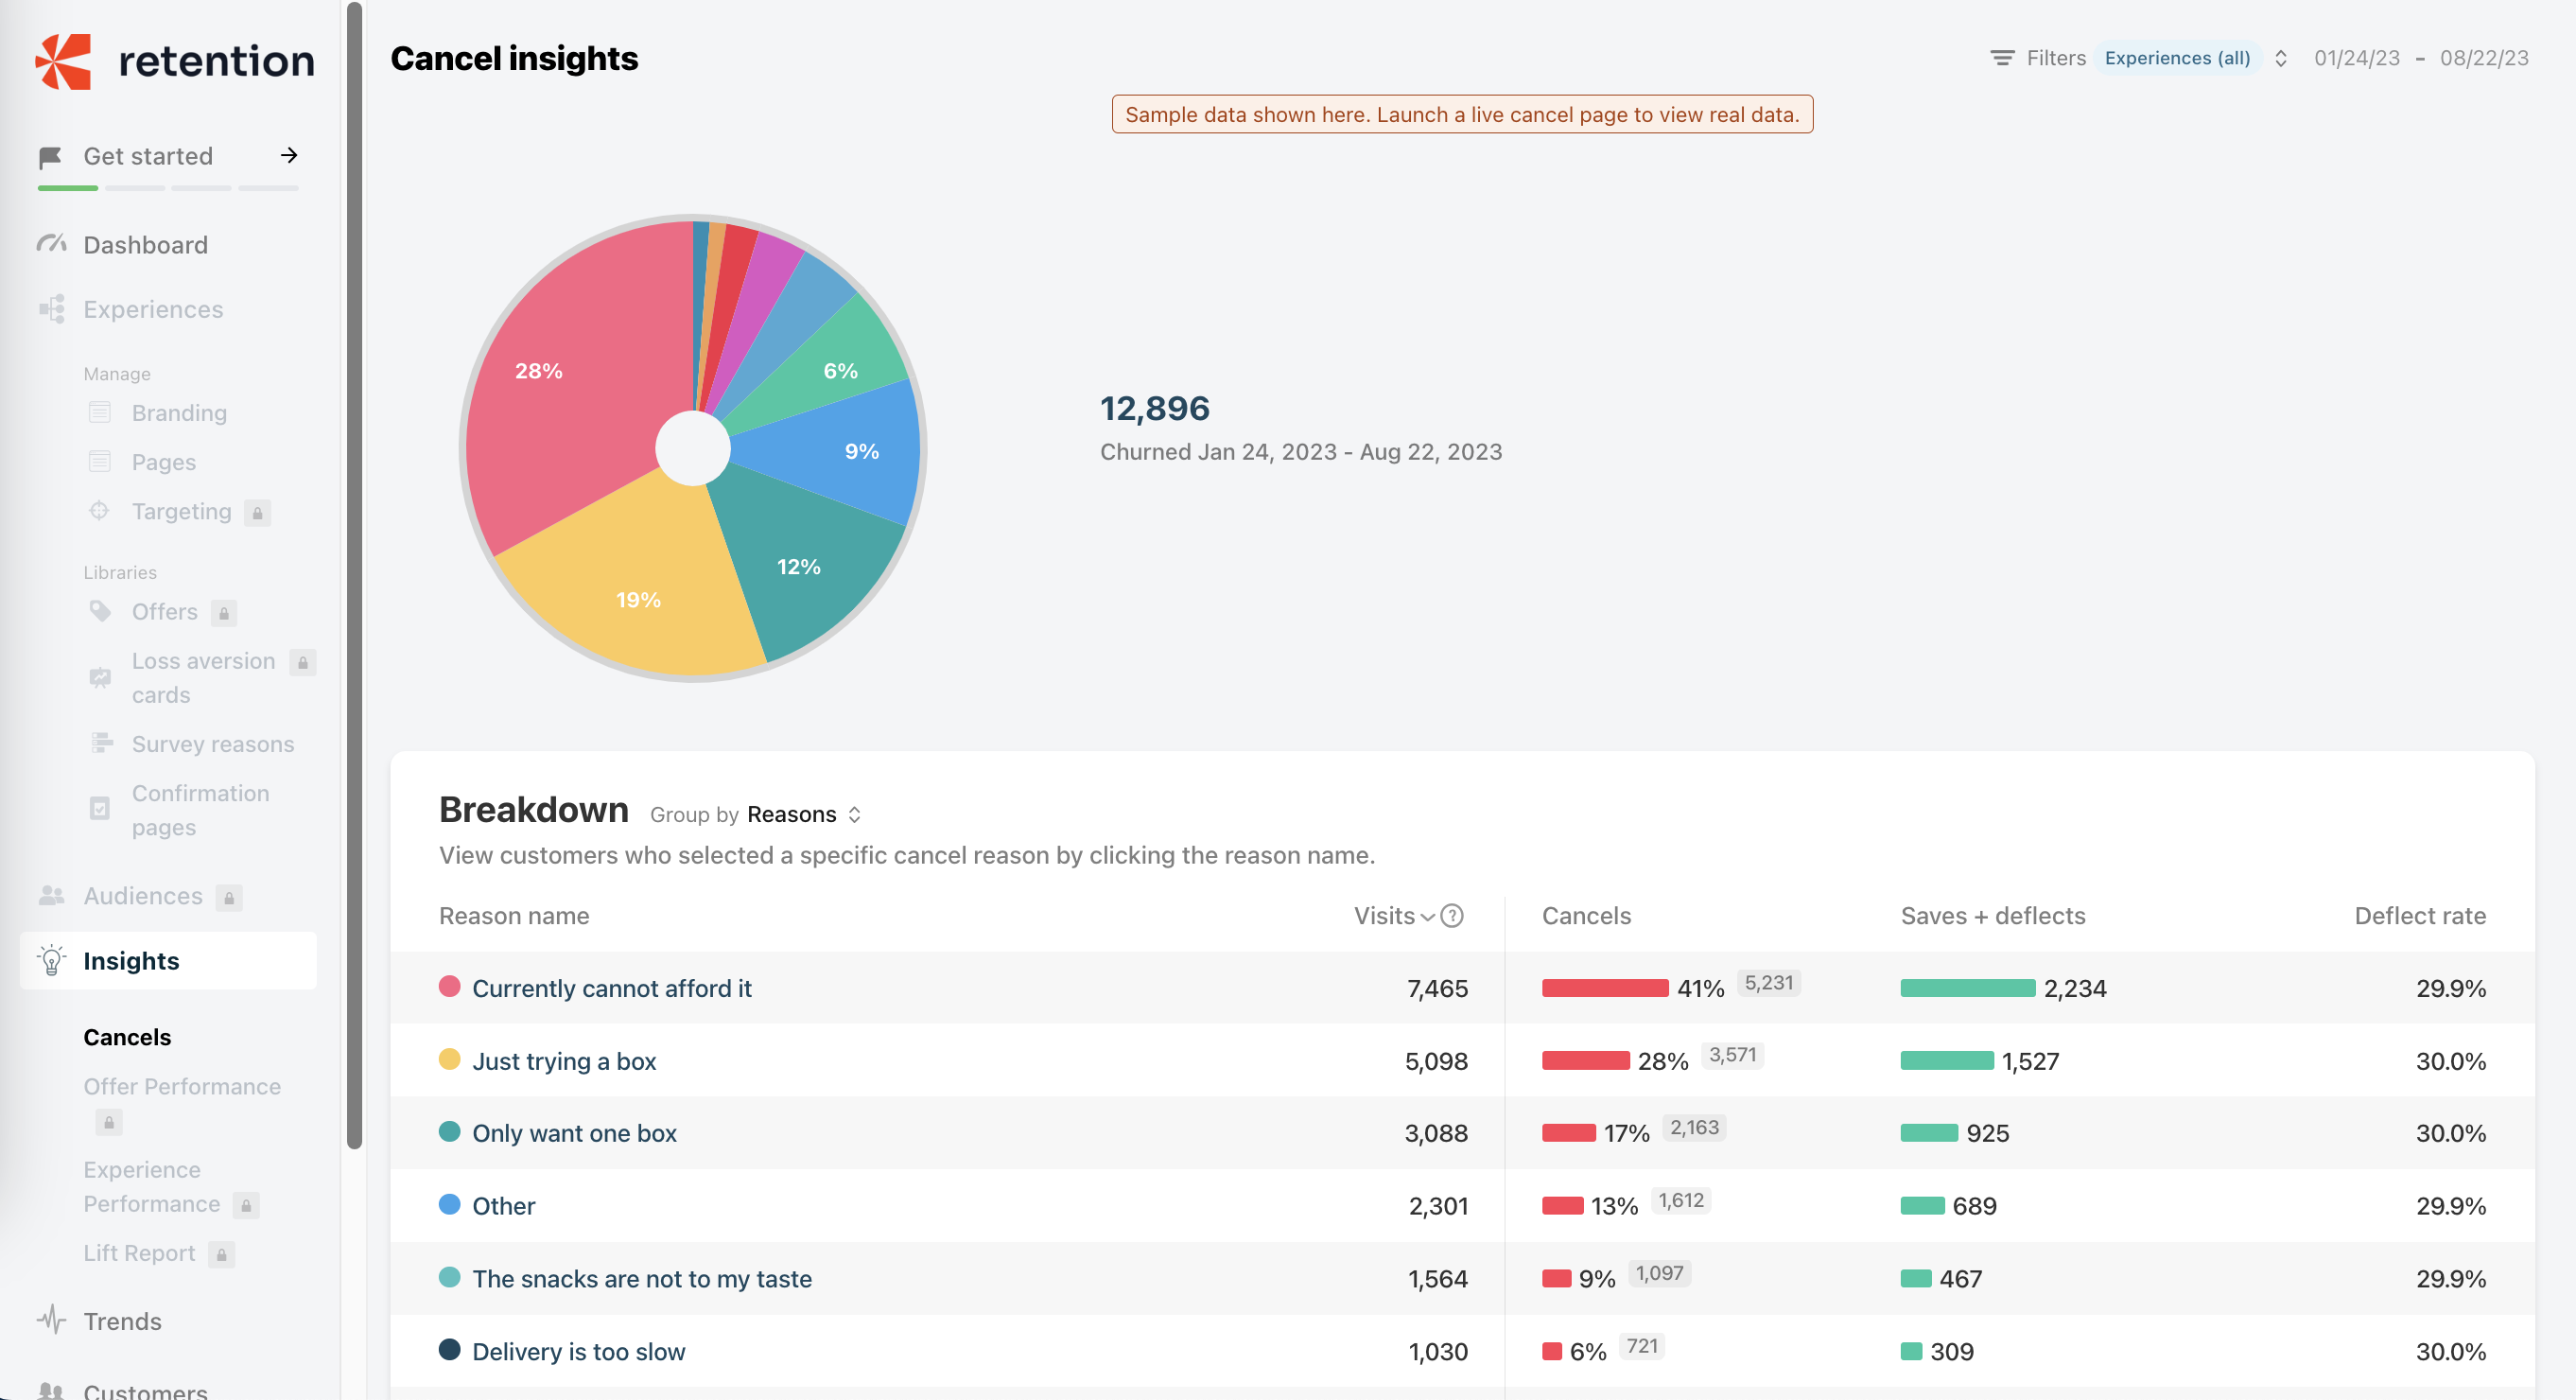
The Cancel insights report provides additional details on your cancel reasons. In addition to the cancel volume and breakdown by cancel reason, you can view the impact of cancel reasons on deflect rate.
The Cancel and Save performance trends reports show how your cancel and deflects evolve over time. You can adjust the grouping by day, week, or month.
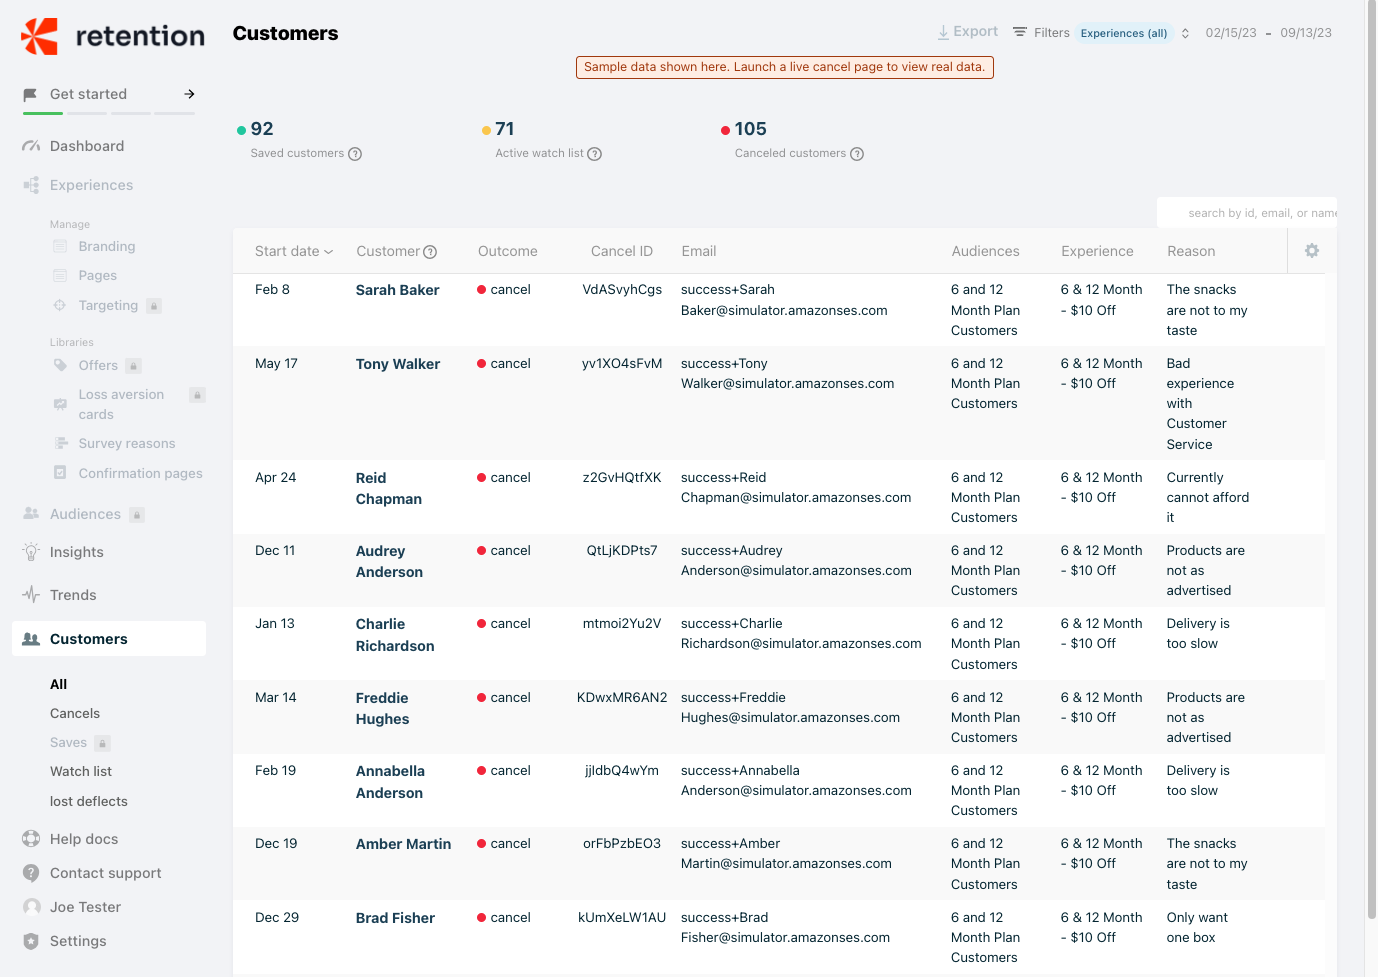
The Customers report provides a list of all your customers who visited the cancel page, broken out by outcome.
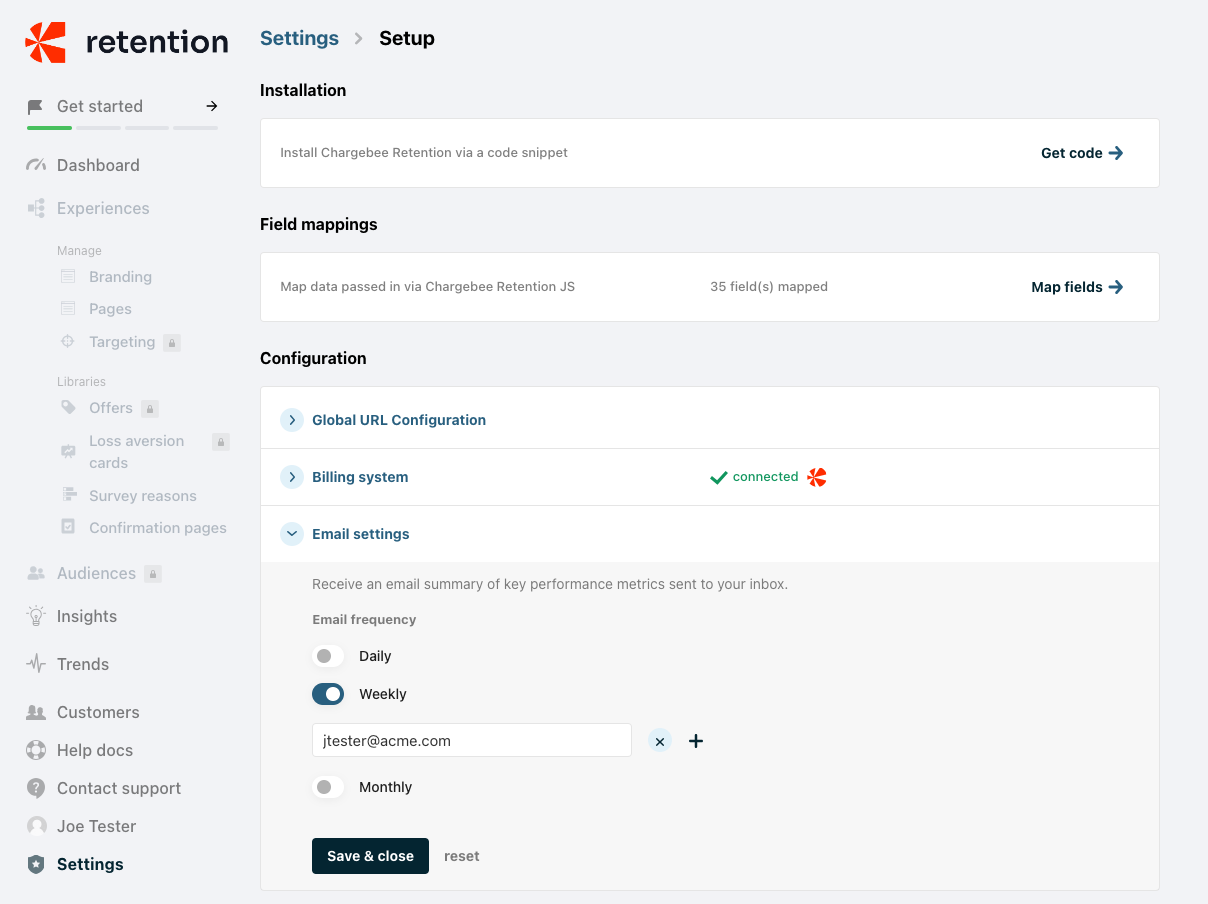
When signing up for Starter, you will be added to a weekly digest email that sends a summary of key Retention metrics for your business:
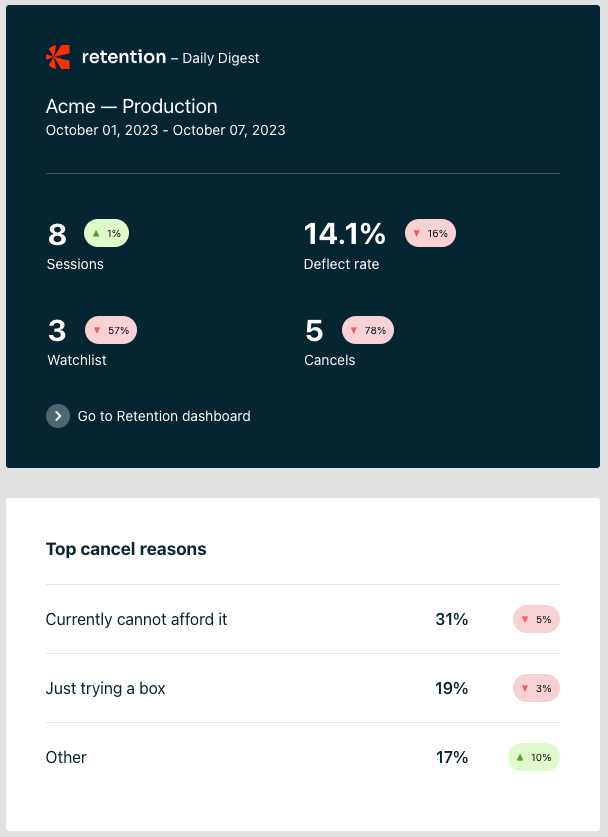
You can also choose to receive the email daily or monthly and add other team members to the email distribution list. These team members do not need to have access to the Retention app.
If you have any questions about Starter Churn Insights, please contact retention-support@chargebee.com.
